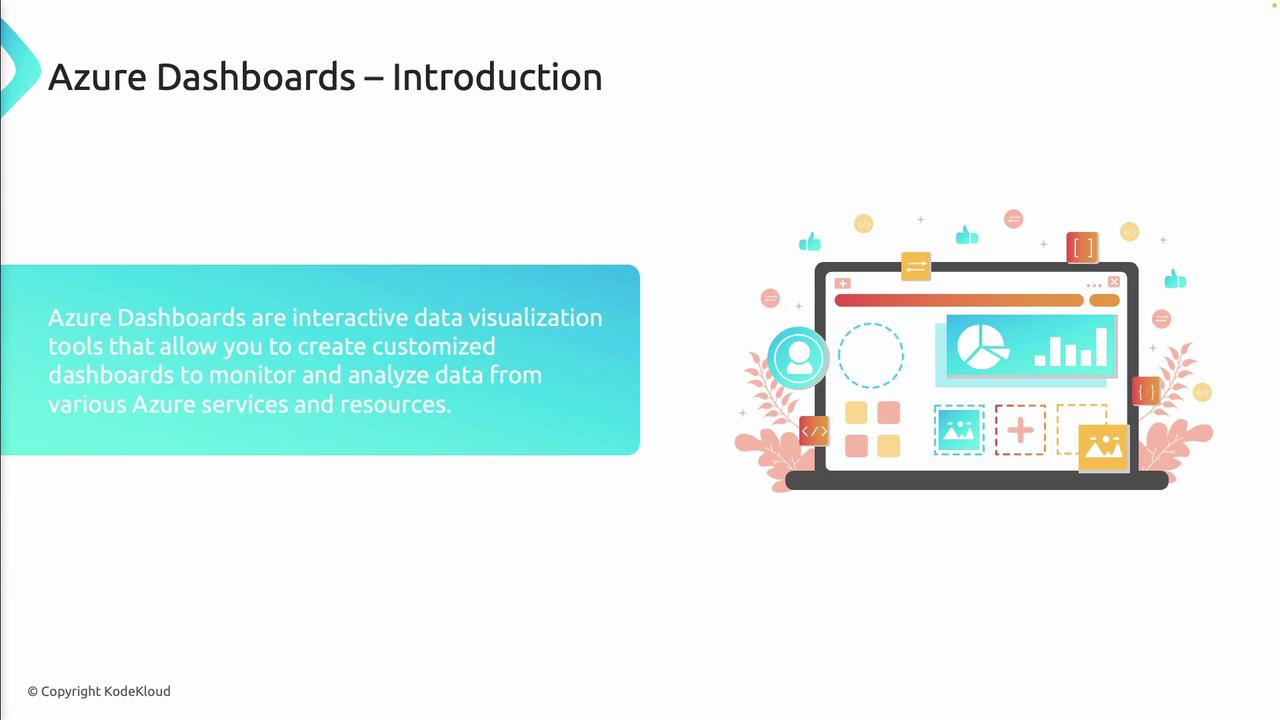
Azure dashboards provide a unified, interactive interface to monitor performance, utilization, and health metrics across your Azure infrastructure. By aggregating data from Azure services and external sources, these customizable dashboards help DevOps teams gain actionable insights, optimize costs, and accelerate troubleshooting.
The image is an introduction to Azure Dashboards, highlighting their use as interactive data visualization tools for creating customized dashboards to monitor and analyze data from Azure services. It includes a graphic of a laptop displaying various data visualization elements.

Key Features

Azure dashboards can be tailored to any team’s workflow. Use drag-and-drop tiles, custom queries, and built-in or third-party charts to surface the data that matters most.
The image is an introduction to Azure Dashboards, highlighting five features: Centralized Monitoring, Customizable Layouts, Integrated Data Sources, Sharing and Collaboration, and Automation and Scripting.

Common Use Cases

Integration with Azure Monitor and Log Analytics

Azure dashboards seamlessly integrate with Azure Monitor and Log Analytics to form a complete observability solution:
  • Collect metrics, activity logs, and custom telemetry across your cloud estate.
  • Run Kusto Query Language (KQL) queries to filter, aggregate, and correlate log data.
  • Pin chart and grid visualizations directly from Log Analytics or Application Insights.
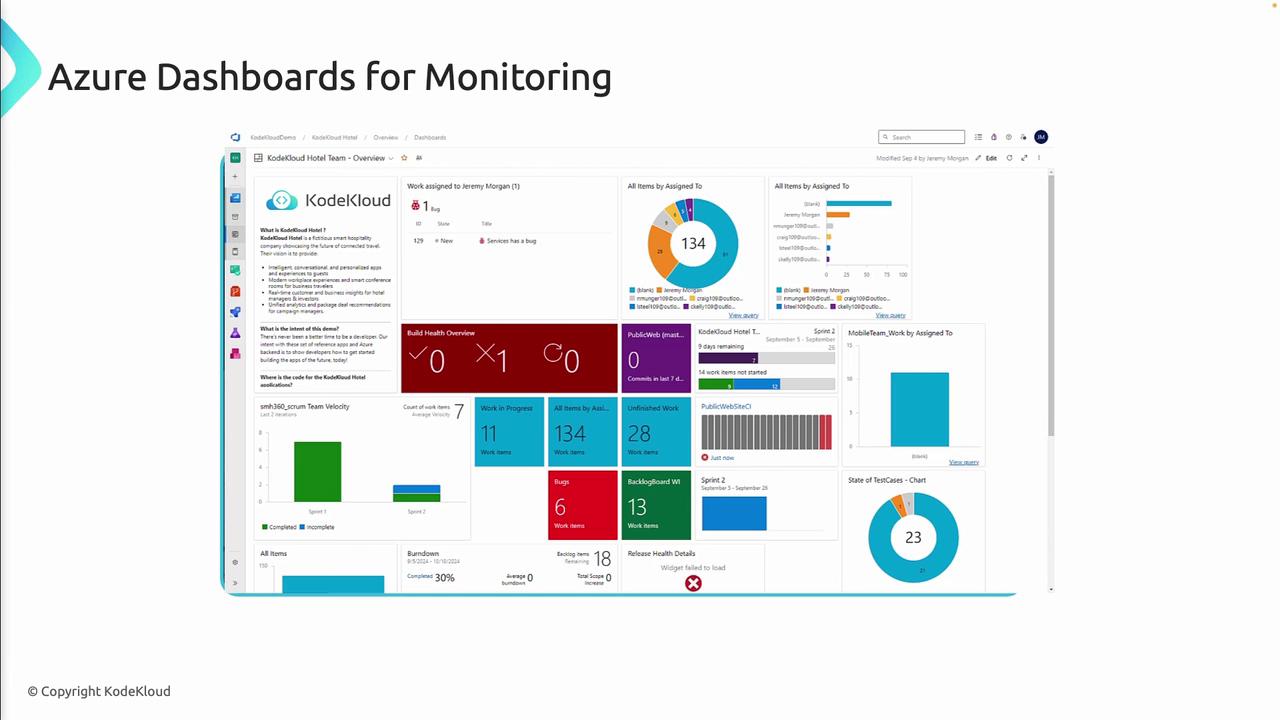
The image shows an Azure dashboard for monitoring, featuring various charts and graphs displaying data related to work assignments, build health, team velocity, and test cases.

Best Practices

  1. Design for Clarity
    Organize tiles by priority and group related metrics together.
  2. Select Actionable Metrics
    Surface only the data points that drive decisions or indicate anomalies.
  3. Integrate Diverse Data Sources
    Combine infrastructure, application, and security logs for a holistic view.
  4. Enforce Role-Based Access Controls
    Apply least-privilege permissions to protect sensitive dashboards.
Grant “Contributor” access only to trusted team members. Public dashboard links expose read-only data but should still be shared judiciously.
  1. Encourage Collaboration
    Leverage comments, annotations, and versioned templates so that teams can iterate on dashboard designs.
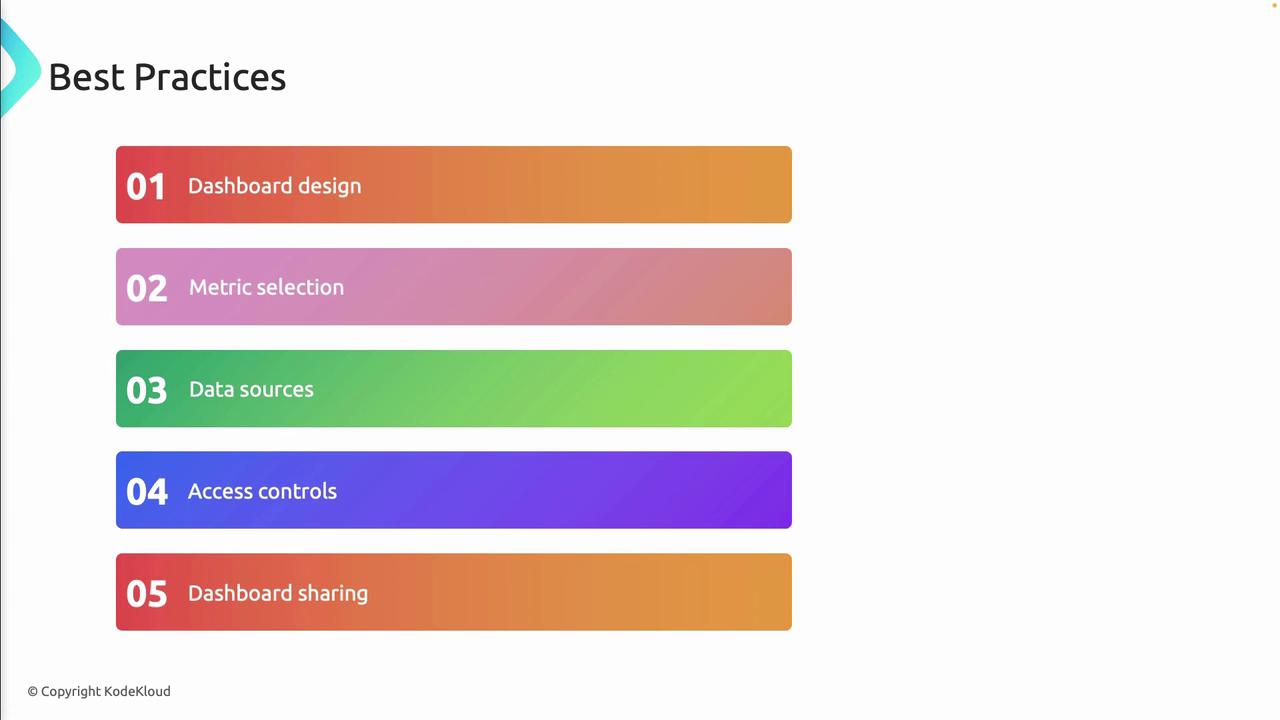
The image lists five best practices for dashboards: design, metric selection, data sources, access controls, and sharing, each in a colored bar.
Azure dashboards empower teams to monitor, analyze, and optimize cloud resources within a single pane of glass. By leveraging customization, automation, and deep integration with Azure Monitor and Log Analytics, you can accelerate troubleshooting, improve governance, and drive continuous improvement across your Azure environment.

Watch Video