Monitoring is a foundational component of any modern DevOps workflow. In this module, you’ll learn how to implement continuous monitoring in Azure by leveraging Azure Monitor and Log Analytics to proactively detect and remediate issues. Azure Monitor provides a unified platform to collect, analyze, and act on telemetry from both cloud and on-premises environments. With Log Analytics, you can craft powerful Kusto Query Language (KQL) queries that turn raw data into actionable insights. Together, these tools help you maintain high availability and performance across your applications and infrastructure.
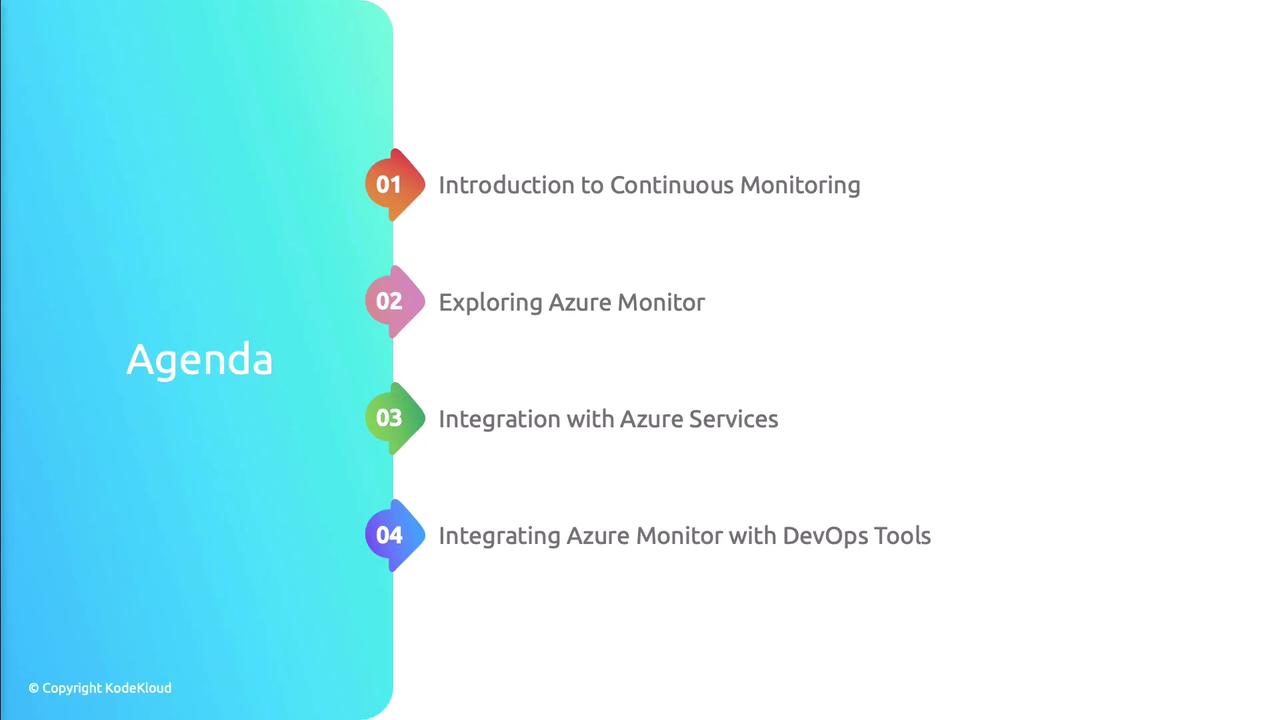
The image shows an agenda with four items related to Azure Monitor, including topics like continuous monitoring, integration with Azure services, and DevOps tools. The design features a gradient background and numbered sections.

Agenda


Practical Integration with DevOps Tools

In this section, we’ll walk through hands-on examples to integrate Azure Monitor into your CI/CD pipelines and operational workflows:
  1. Connecting Azure Monitor with popular DevOps platforms
  2. Configuring custom alerts to triage and respond faster
  3. Provisioning and managing Log Analytics workspaces via Infrastructure as Code
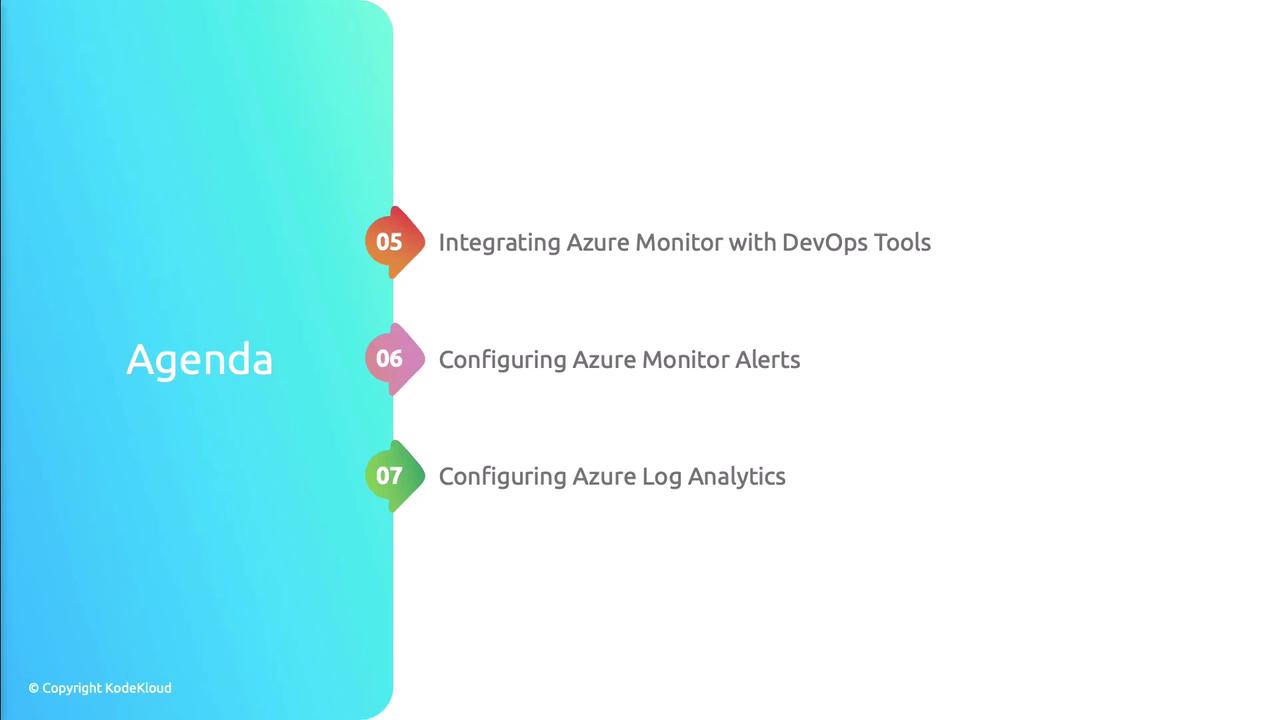
The image is an agenda slide listing three topics: integrating Azure Monitor with DevOps tools, configuring Azure Monitor alerts, and configuring Azure Log Analytics.
Automate workspace provisioning using ARM templates or Terraform.
Here’s a quick Azure CLI example to create a Log Analytics workspace:

Configuring Telemetry Collection

To achieve full-stack observability, you must collect telemetry across applications, VMs, containers, storage, and networks. Azure offers specialized solutions for each domain.
The image is a presentation slide titled "Configuring Collection of Telemetry by Using Various Azure Services," featuring a graphic of a network diagram on a blue gradient background.

Azure Telemetry Services Overview

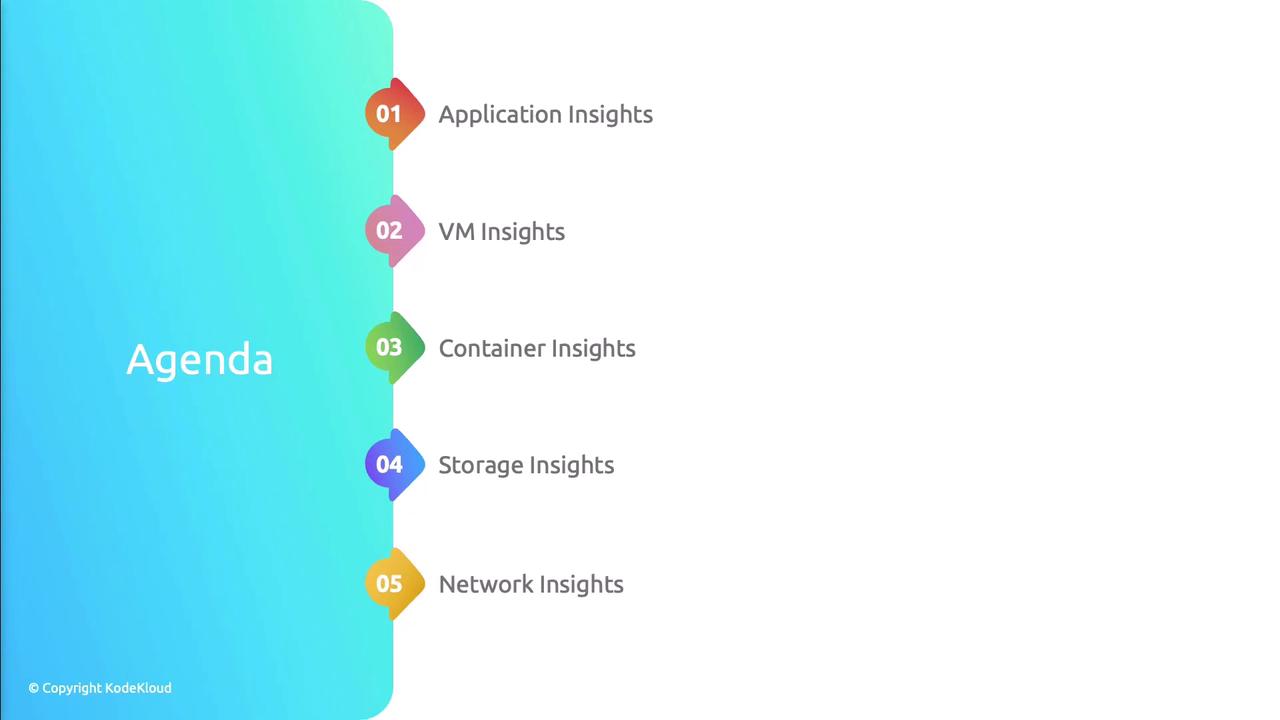
The image is a presentation slide with an agenda listing five insights: Application, VM, Container, Storage, and Network. The background is a gradient of blue and green.

By the end of this lesson, you’ll be able to:
  • Set up data collection across multiple Azure services
  • Author KQL queries to analyze and correlate logs and metrics
  • Build interactive dashboards in Azure Monitor and Log Analytics

Watch Video