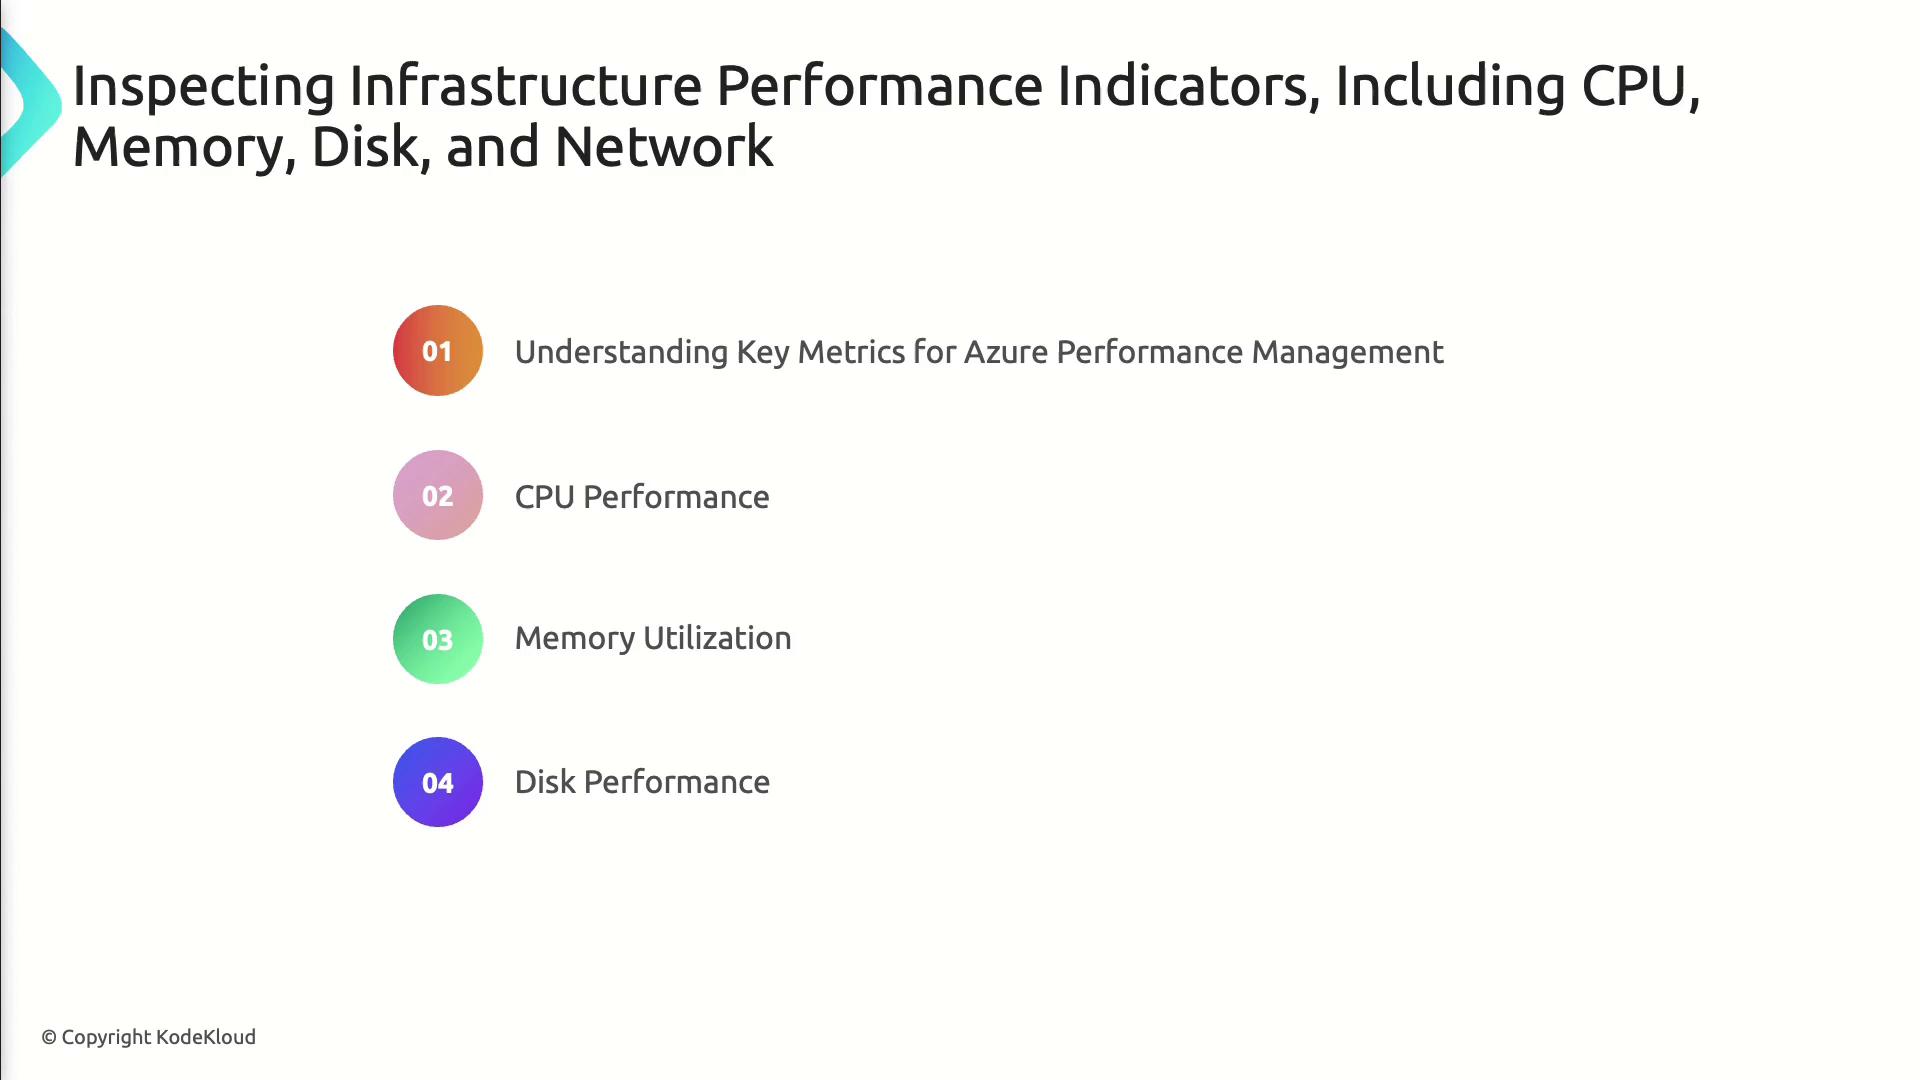
- Track critical infrastructure metrics (CPU, memory, disk, network)
- Configure Azure monitoring services and alerts
- Analyze usage and application performance telemetry
- Build custom dashboards and follow best practices for Azure performance management
Understanding core infrastructure metrics lets you proactively manage Azure resources and avoid bottlenecks.
Key Metrics Overview
| Metric | Definition | Azure Monitor Metric Name | Typical Threshold |
|---|---|---|---|
| CPU Usage | Percentage of CPU capacity in use | Percentage CPU | 70% |
| Memory Utilization | Ratio of committed vs. available memory | Available Memory | 80% |
| Disk I/O | Read/write operations per second | Disk Read/Write Ops/Sec | Varies by workload |
| Network Throughput | Inbound/outbound bytes per second | Network In/Out Bytes | Varies by workload |

Import these metrics into Azure Monitor to visualize trends, set alerts, and automate scaling actions.
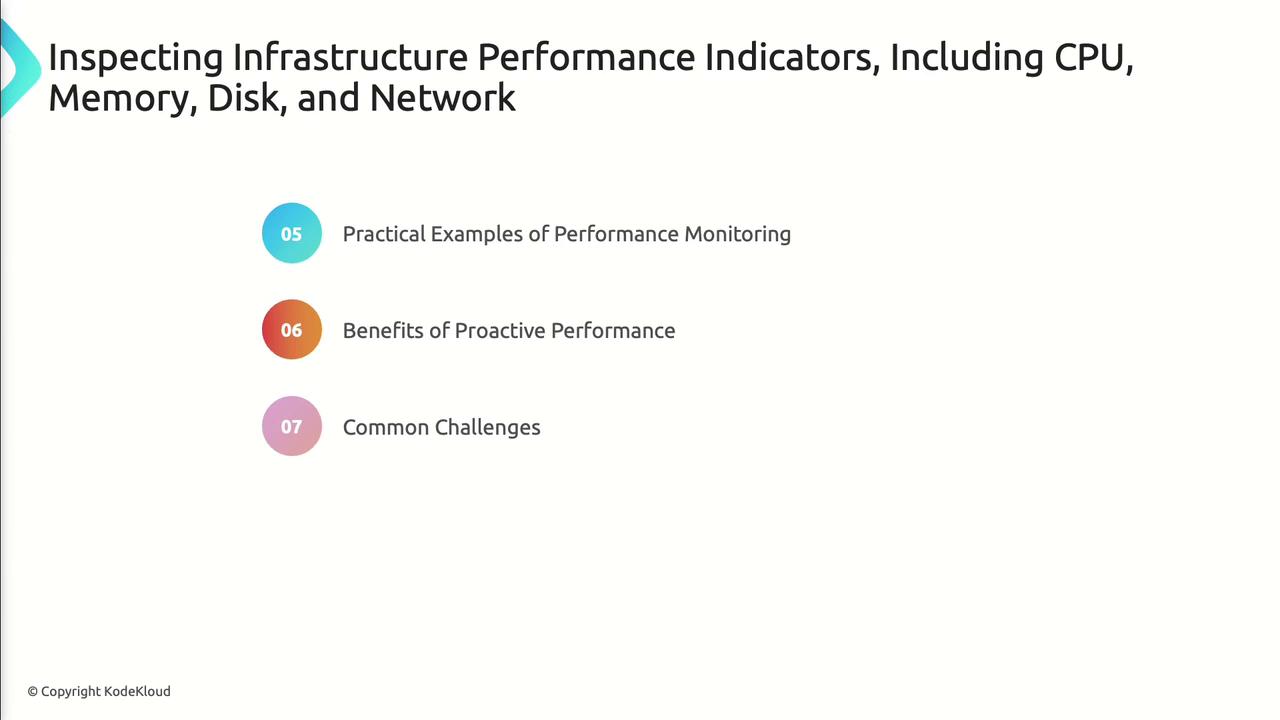
Practical Monitoring Scenarios
- Scenario 1: Scale out a compute cluster when CPU usage exceeds 75% for 5 minutes
- Scenario 2: Trigger an alert on sustained disk latency spikes in a database VM
- Scenario 3: Throttle network-intensive workloads to prevent bandwidth saturation

Benefits & Challenges
| Benefit | Challenge |
|---|---|
| Early issue detection | Alert fatigue if thresholds too strict |
| Optimized resource utilization | Data overload without proper filtering |
| Reduced downtime and faster MTTR | Misconfigured alerts can mask real issues |
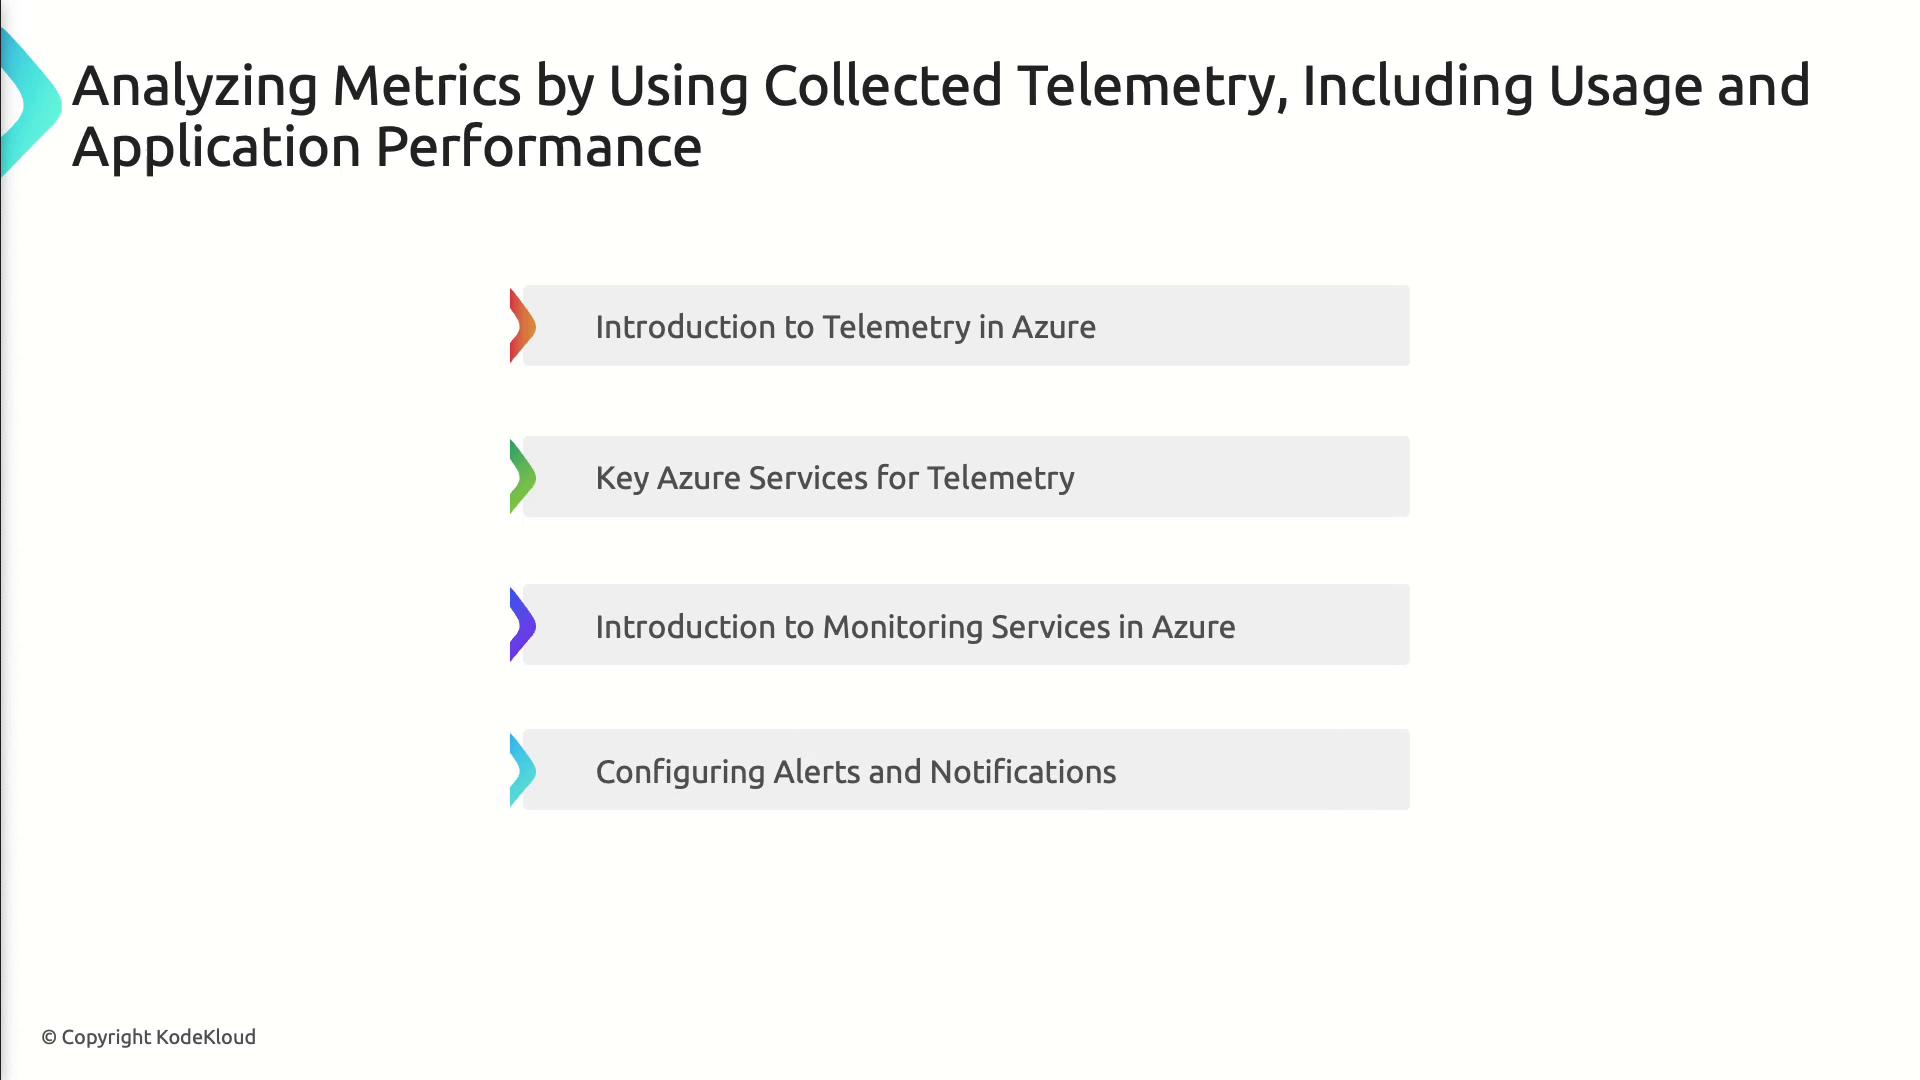
Telemetry data provides deeper insights into application usage and performance.

Configuring Alerts
- Navigate to Azure Monitor > Alerts
- Create an Alert Rule for a selected metric
- Define Action Groups to notify, log, or trigger automation
Avoid setting excessive alert rules. Prioritize critical metrics to reduce noise and ensure timely response.
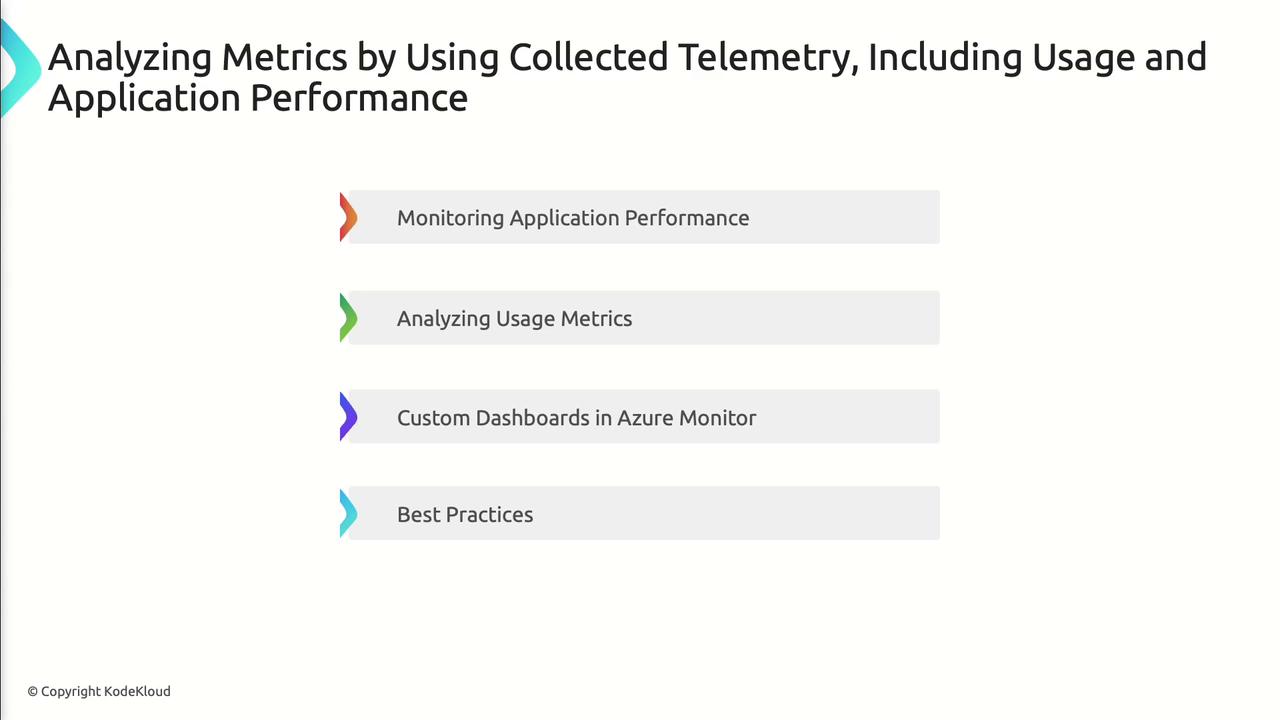
Building Custom Dashboards
- Pin metric charts from multiple resources
- Use Workbooks for interactive reports
- Share dashboards with your team via Azure Portal
Monitor end-to-end application health by analyzing real usage metrics, dependencies, and response times.

Best Practices
- Enable Application Insights for distributed tracing
- Define Failure Anomalies to catch performance regressions
- Leverage Live Metrics Stream during load testing
- Tag resources consistently for grouped telemetry analysis