One major reason to monitor GitOps operators is to detect and alert when applications or clusters drift from their desired state. A common stack for this is Prometheus + Alertmanager for metrics and alerts, and Grafana for visualization. In this lesson we configure Prometheus and Grafana to collect Argo CD metrics and visualize them. The demo uses the kube-prometheus-stack Helm chart, which bundles Prometheus, Alertmanager, Grafana, node-exporter, and related components.
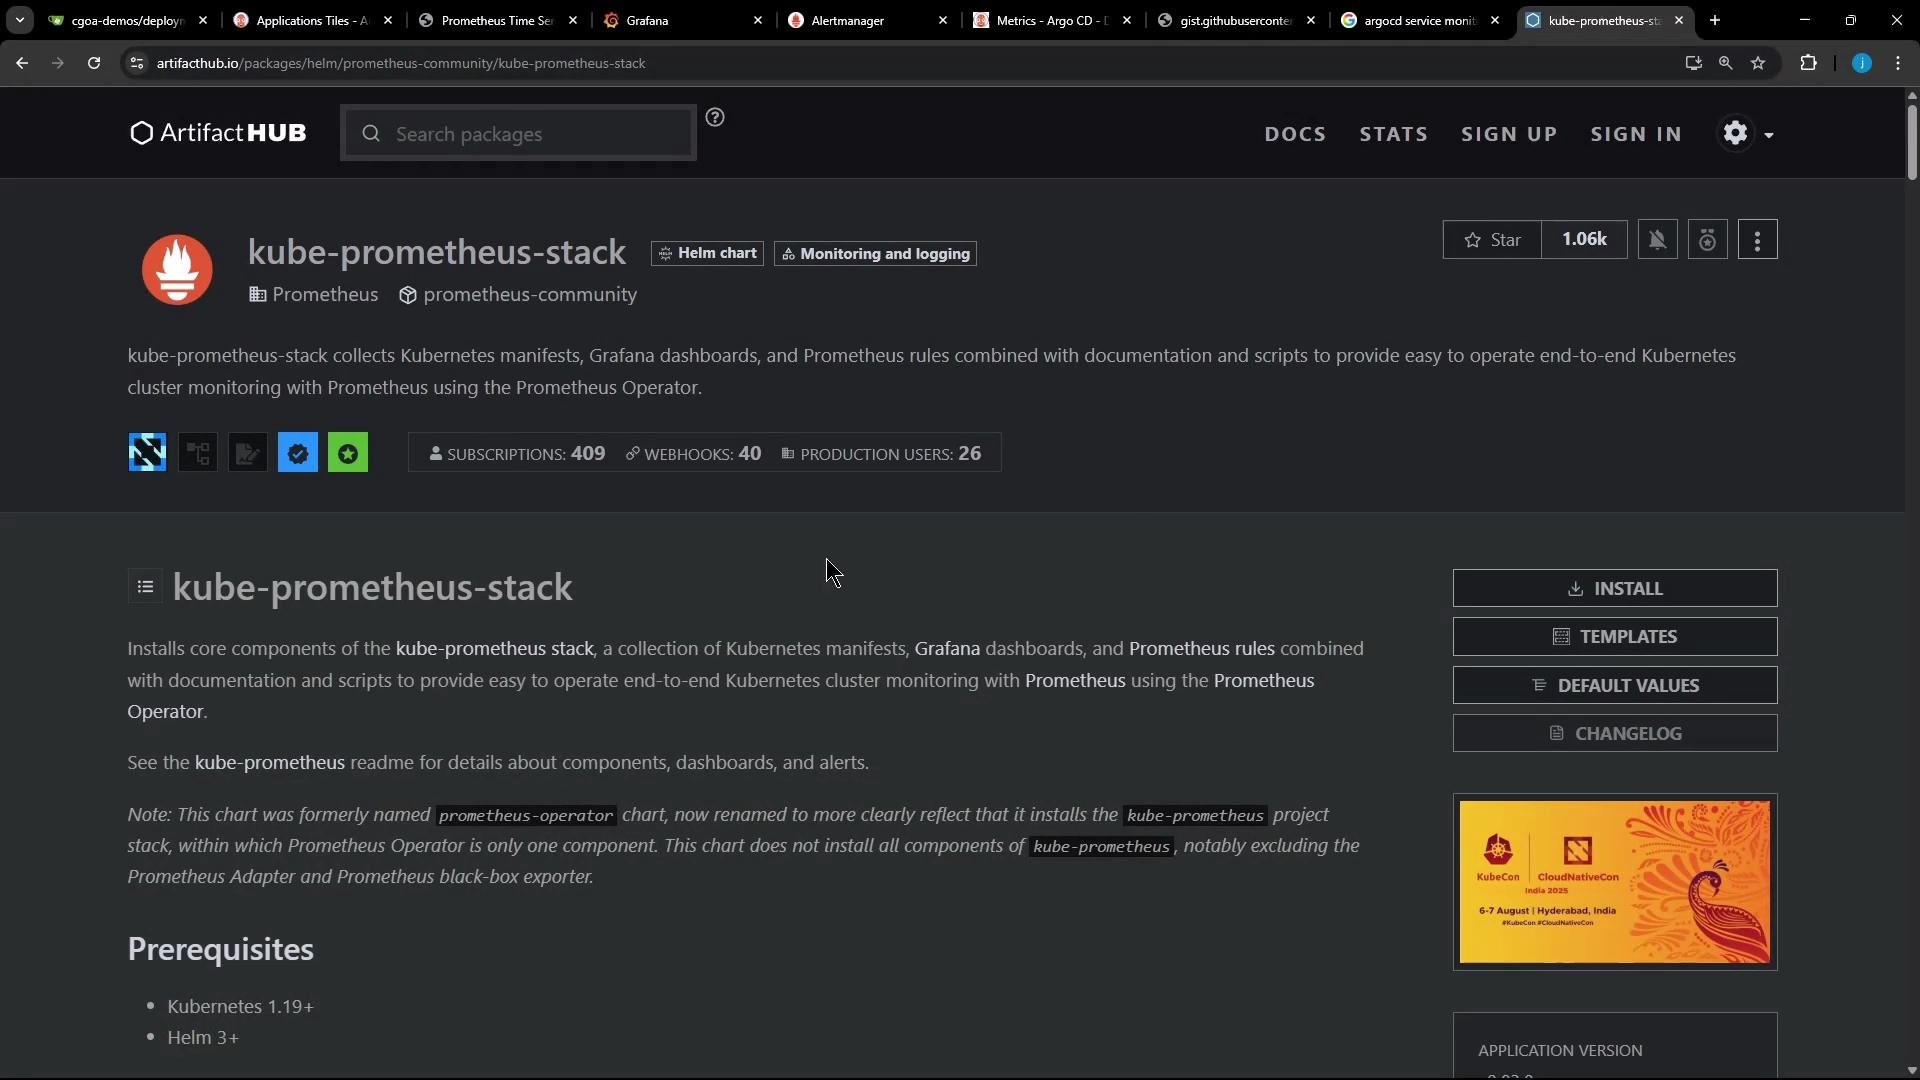
The image shows a webpage from Artifact Hub describing the "kube-prometheus-stack," a Helm chart for Kubernetes cluster monitoring with Prometheus. It includes options for installation, templates, and default values, along with prerequisites and additional information.
I deployed kube-prometheus-stack into the monitoring namespace. A quick pod check shows Alertmanager, Prometheus, Grafana and other components running (one node-exporter pod is CrashLoopBackOff in this environment — not relevant to Argo CD scraping):
kubectl -n monitoring get pods
NAME                                                              READY   STATUS             RESTARTS   AGE
alertmanager-kode-kloud-prometheus-stack-alertmanager-0           2/2     Running            0          102m
kode-kloud-prometheus-stack-operator-57cb9b6f-zcfpg               1/1     Running            0          102m
kode-kloud-prometheus-stack-grafana-6d5bd7b56-22kbw              3/3     Running            0          102m
kode-kloud-prometheus-stack-kube-state-metrics-6965679658-pwc5   1/1     Running            0          102m
kode-kloud-prometheus-stack-prometheus-node-exporter-jjbf        0/1     CrashLoopBackOff   24         102m
prometheus-kode-kloud-prometheus-stack-prometheus-0              2/2     Running            0          102m
All of the stack services are exposed via NodePort for local browser access (Prometheus, Grafana, Alertmanager). Components and their roles:
ComponentRole / Use CaseExample check
PrometheusMetrics collection & rule evaluationkubectl -n monitoring get pods
GrafanaDashboards & visualizationsImport Argo CD dashboard JSON
AlertmanagerRoute and deliver alerts (Slack, email, etc.)Configure receivers & routes
node-exporterNode metrics for OS-level insightsnode-level telemetry

Expose Argo CD metrics to Prometheus

Argo CD exposes Prometheus metrics for several components (Application Controller, API Server, Repo Server, Notifications Controller, etc.). The Prometheus Operator discovers and scrapes services via ServiceMonitor custom resources. The Argo CD docs include example ServiceMonitor manifests that you can adapt.
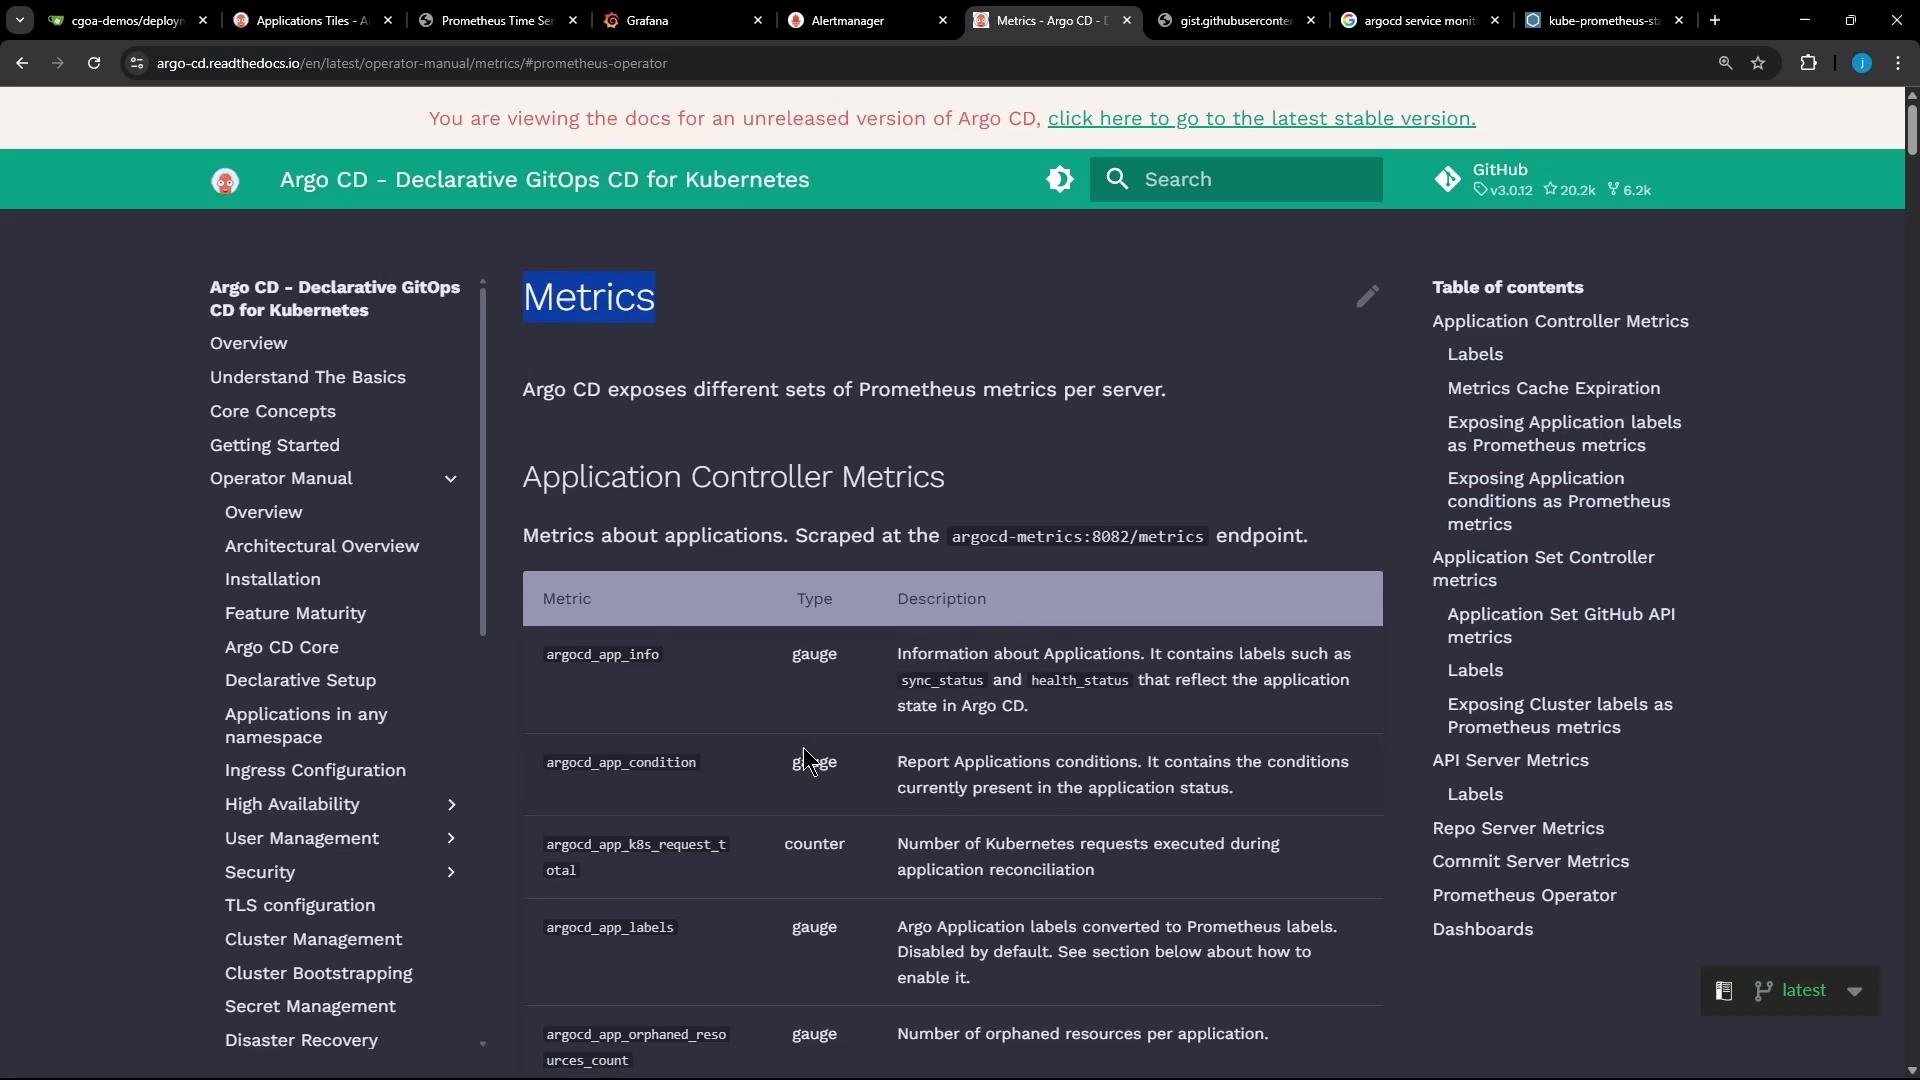
The image shows a documentation page for Argo CD, focusing on Prometheus metrics for the Application Controller. It includes a table detailing various metrics, types, and their descriptions.
A typical ServiceMonitor from the Argo CD docs:
apiVersion: monitoring.coreos.com/v1
kind: ServiceMonitor
metadata:
  name: argocd-metrics
  labels:
    release: prometheus-operator
spec:
  selector:
    matchLabels:
      app.kubernetes.io/name: argocd-metrics
  endpoints:
    - port: metrics
---
apiVersion: monitoring.coreos.com/v1
kind: ServiceMonitor
metadata:
  name: argocd-server-metrics
  labels:
    release: prometheus-operator
spec:
  selector:
    matchLabels:
      app.kubernetes.io/name: argocd-server
  endpoints:
    - port: metrics
Important: the metadata.labels.release value on each ServiceMonitor must match the serviceMonitorSelector configured in your Prometheus custom resource (managed by the Prometheus Operator). If they don’t match, Prometheus will ignore the ServiceMonitor.

Find the ServiceMonitor selector configured for Prometheus

Inspect the Prometheus custom resource in the monitoring namespace to discover which labels it accepts for ServiceMonitor discovery:
kubectl -n monitoring get prometheuses.monitoring.coreos.com -o yaml | grep -i servicemonitorselector -A5
A relevant snippet might look like:
serviceMonitorSelector:
  matchLabels:
    release: kode-kloud-prometheus-stack
shards: 1
version: v2.35.0
status:
  ...
In this environment Prometheus will only pick up ServiceMonitor objects with the label release: kode-kloud-prometheus-stack. Adjust your ServiceMonitor manifests to match.

ServiceMonitors for Argo CD

I created ServiceMonitor resources for Argo CD components and gave them the release label that matches the Prometheus selector (kode-kloud-prometheus-stack). These were applied to the argocd namespace. Summary of applied ServiceMonitors:
Resource Nameselector.matchLabelsPurpose
argocd-server-metricsapp.kubernetes.io/name: argocd-server-metricsScrape Argo CD API server metrics
argocd-repo-server-metricsapp.kubernetes.io/name: argocd-repo-serverScrape repo server metrics
argocd-notifications-controllerapp.kubernetes.io/name: argocd-notifications-controller-metricsScrape notifications controller
argocd-metricsapp.kubernetes.io/name: argocd-metricsScrape general Argo CD component metrics
Full YAML applied (already present in the cluster for this demo):
apiVersion: monitoring.coreos.com/v1
kind: ServiceMonitor
metadata:
  name: argocd-server-metrics
  labels:
    release: kode-kloud-prometheus-stack
spec:
  selector:
    matchLabels:
      app.kubernetes.io/name: argocd-server-metrics
  endpoints:
    - port: metrics
---
apiVersion: monitoring.coreos.com/v1
kind: ServiceMonitor
metadata:
  name: argocd-repo-server-metrics
  labels:
    release: kode-kloud-prometheus-stack
spec:
  selector:
    matchLabels:
      app.kubernetes.io/name: argocd-repo-server
  endpoints:
    - port: metrics
---
apiVersion: monitoring.coreos.com/v1
kind: ServiceMonitor
metadata:
  name: argocd-notifications-controller
  labels:
    release: kode-kloud-prometheus-stack
spec:
  selector:
    matchLabels:
      app.kubernetes.io/name: argocd-notifications-controller-metrics
  endpoints:
    - port: metrics
---
apiVersion: monitoring.coreos.com/v1
kind: ServiceMonitor
metadata:
  name: argocd-metrics
  labels:
    release: kode-kloud-prometheus-stack
spec:
  selector:
    matchLabels:
      app.kubernetes.io/name: argocd-metrics
  endpoints:
    - port: metrics

Apply ServiceMonitors

Apply the manifests into your Argo CD namespace. In this demo I applied them directly from a Gist:
kubectl -n argocd apply -f https://gist.githubusercontent.com/sidd-harth/e21ee180c39e6ecef659066120dcd8ef/raw/3cf7b3b5ebda888e3a4069fe61dff01eb1329617/argocd-servicemonitors.yml
Expected output:
servicemonitor.monitoring.coreos.com/argocd-metrics created
servicemonitor.monitoring.coreos.com/argocd-server-metrics created
servicemonitor.monitoring.coreos.com/argocd-repo-server-metrics created
servicemonitor.monitoring.coreos.com/argocd-notifications-controller created
Prometheus (via the Prometheus Operator) will detect new ServiceMonitor objects and reload configuration automatically. It can take a minute or two for targets to appear as up.
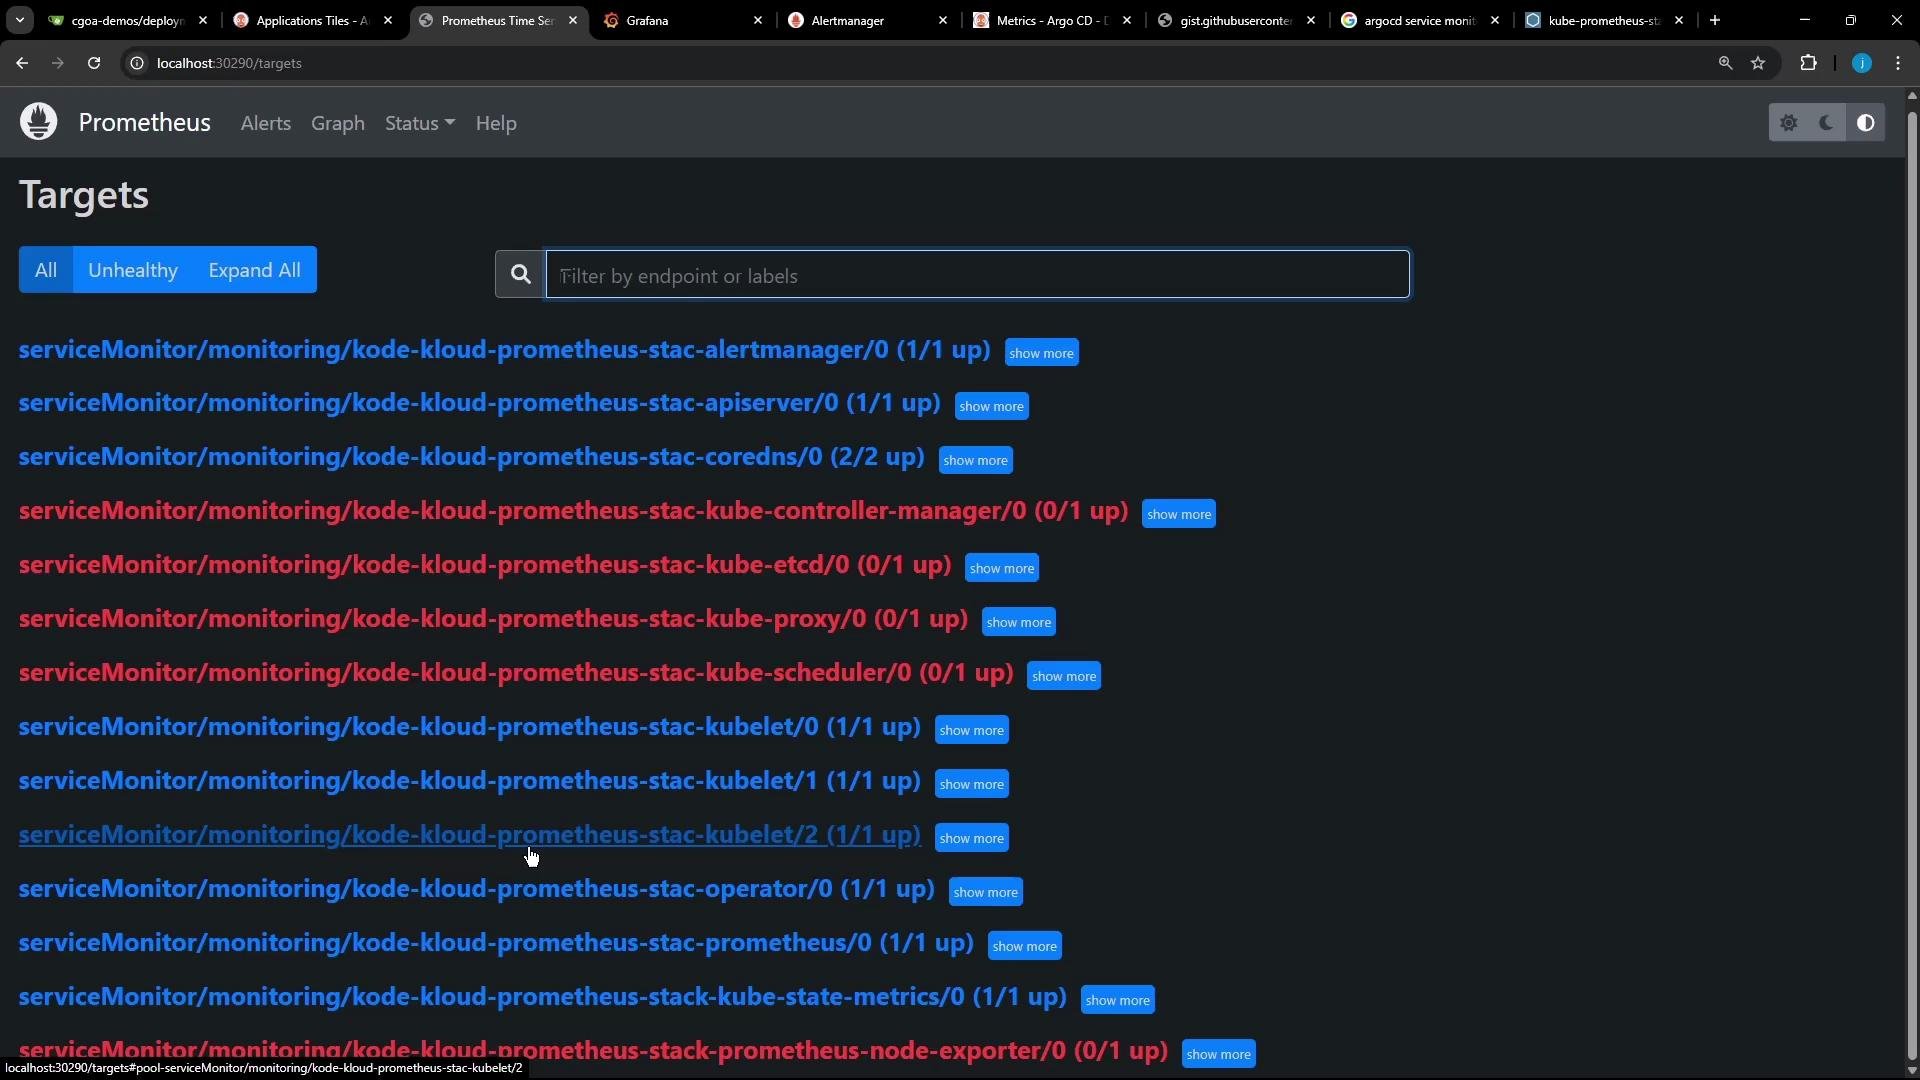
This image shows a Prometheus monitoring dashboard displaying a list of service targets with their health status, labeled as "up" or "down".

Working with Grafana dashboards

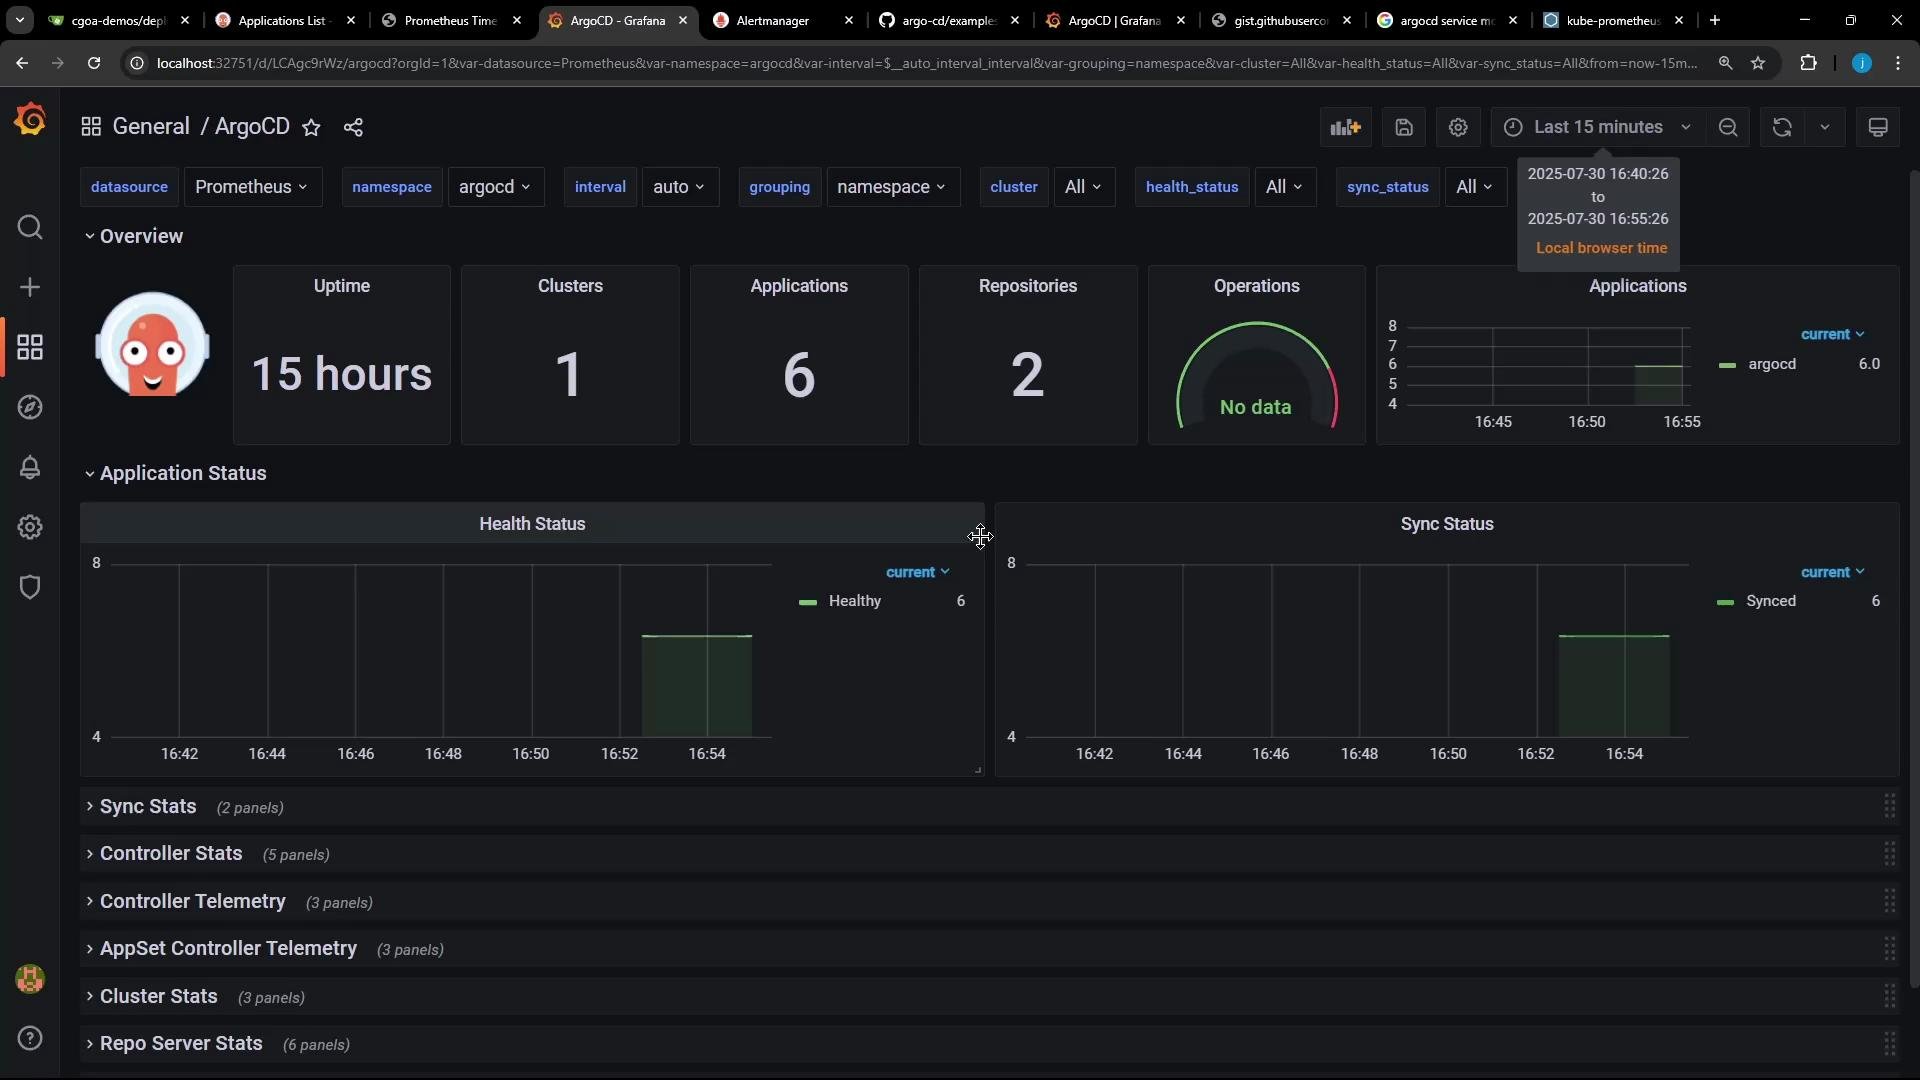
Argo CD provides a community Grafana dashboard (JSON) that you can import to visualize key metrics: number of applications, health, sync status, repository counts, and component-level metrics. You can import via JSON upload or by URL. A minimal snippet of the dashboard metadata:
{
  "timezone": "",
  "title": "ArgoCD",
  "uid": "LCAgc9rWz",
  "version": 2,
  "weekStart": ""
}
The dashboard uses Prometheus as the data source and filters metrics by namespace/cluster. After importing, panels show application counts, health/sync trends, repository statistics, and component metrics.
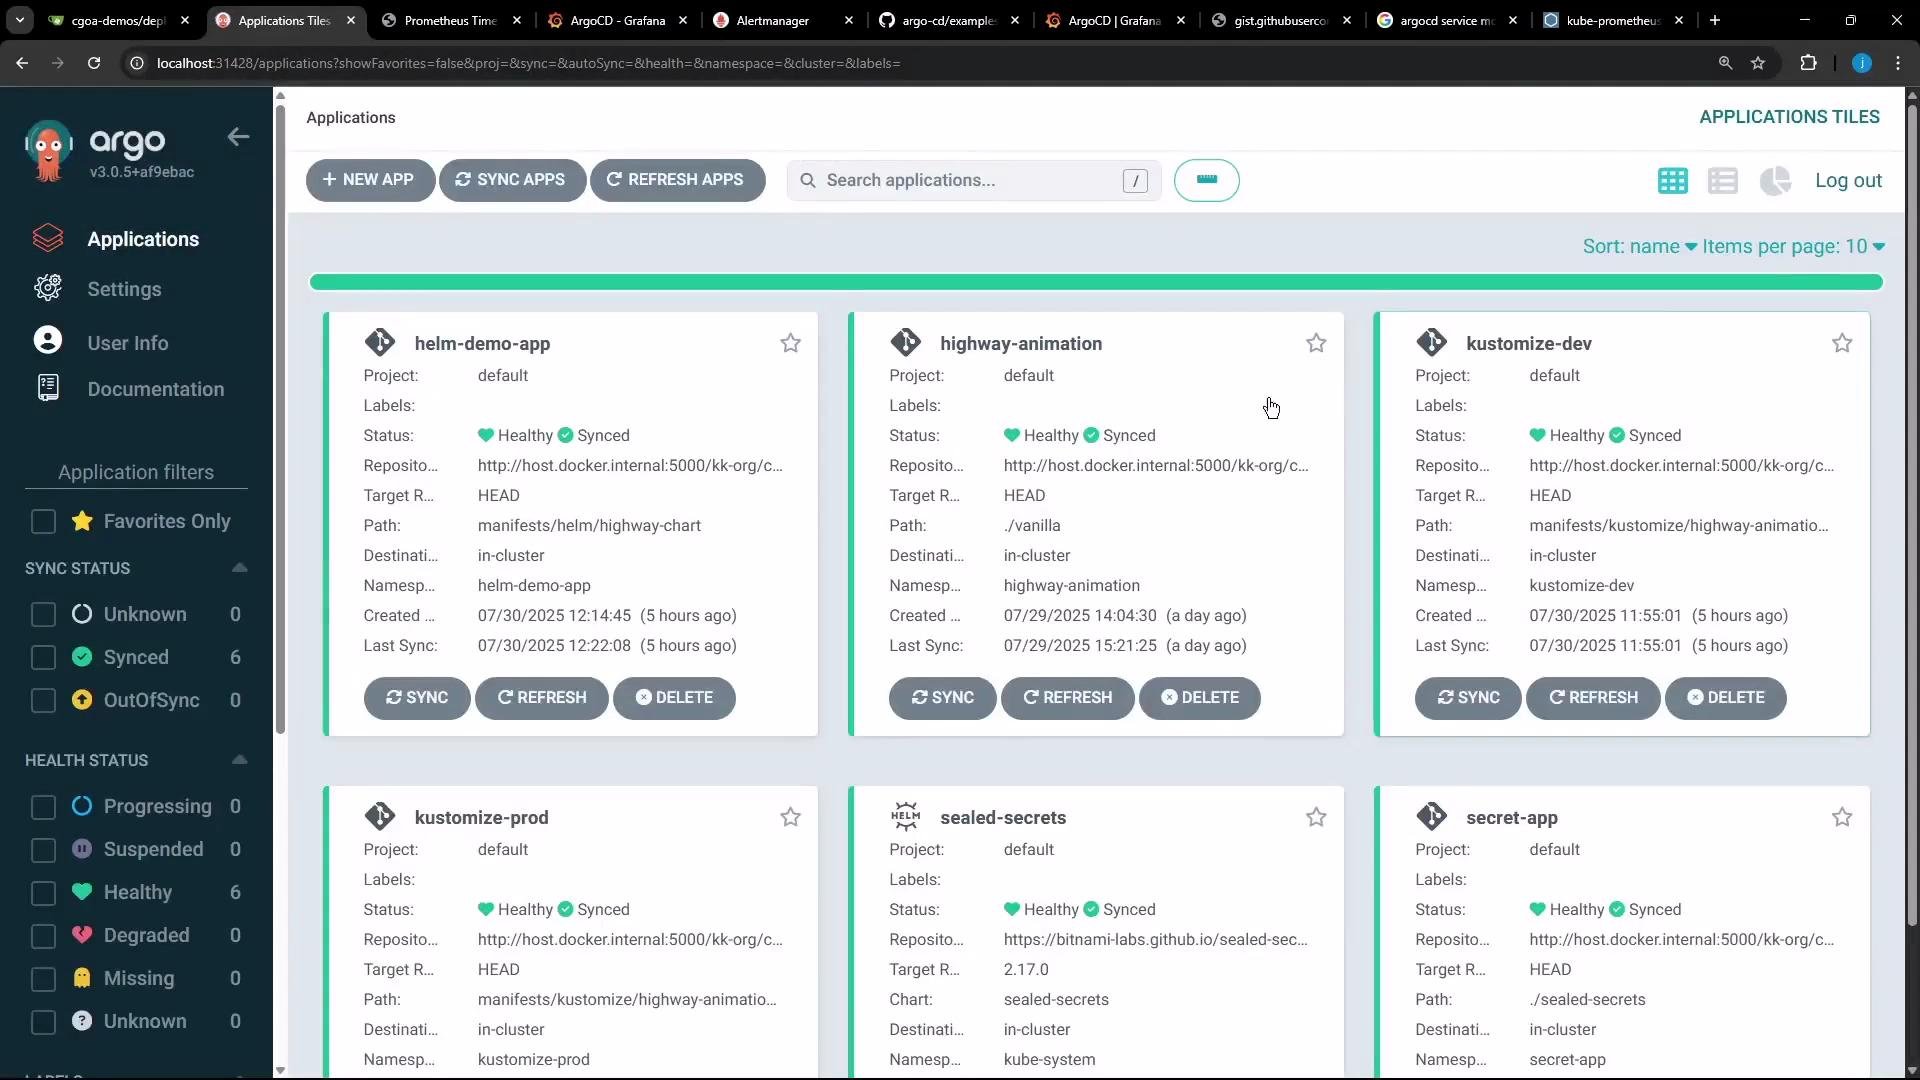
The image shows the Argo CD dashboard displaying a list of applications with details such as project name, status, and synchronization information. Each application is marked as "Healthy" and "Synced" with options for syncing, refreshing, or deleting.
The Argo CD UI confirms the number of applications and repositories surfaced by Grafana:
This image shows a dashboard for ArgoCD in Grafana, displaying metrics such as uptime, clusters, applications, and repositories. It includes graphs for application health and sync status over a specified time interval.
Once Prometheus scrapes the Argo CD ServiceMonitor targets, Grafana panels querying Prometheus will populate (applications synced/healthy, server/repo statistics, etc.).

Next steps — Alerting with Alertmanager

With metrics and dashboards in place, the next step is to author Prometheus alerting rules that detect conditions such as:
  • Application drift from desired state
  • Unexpected auto-syncs or sync failures
  • Repository errors or connection problems
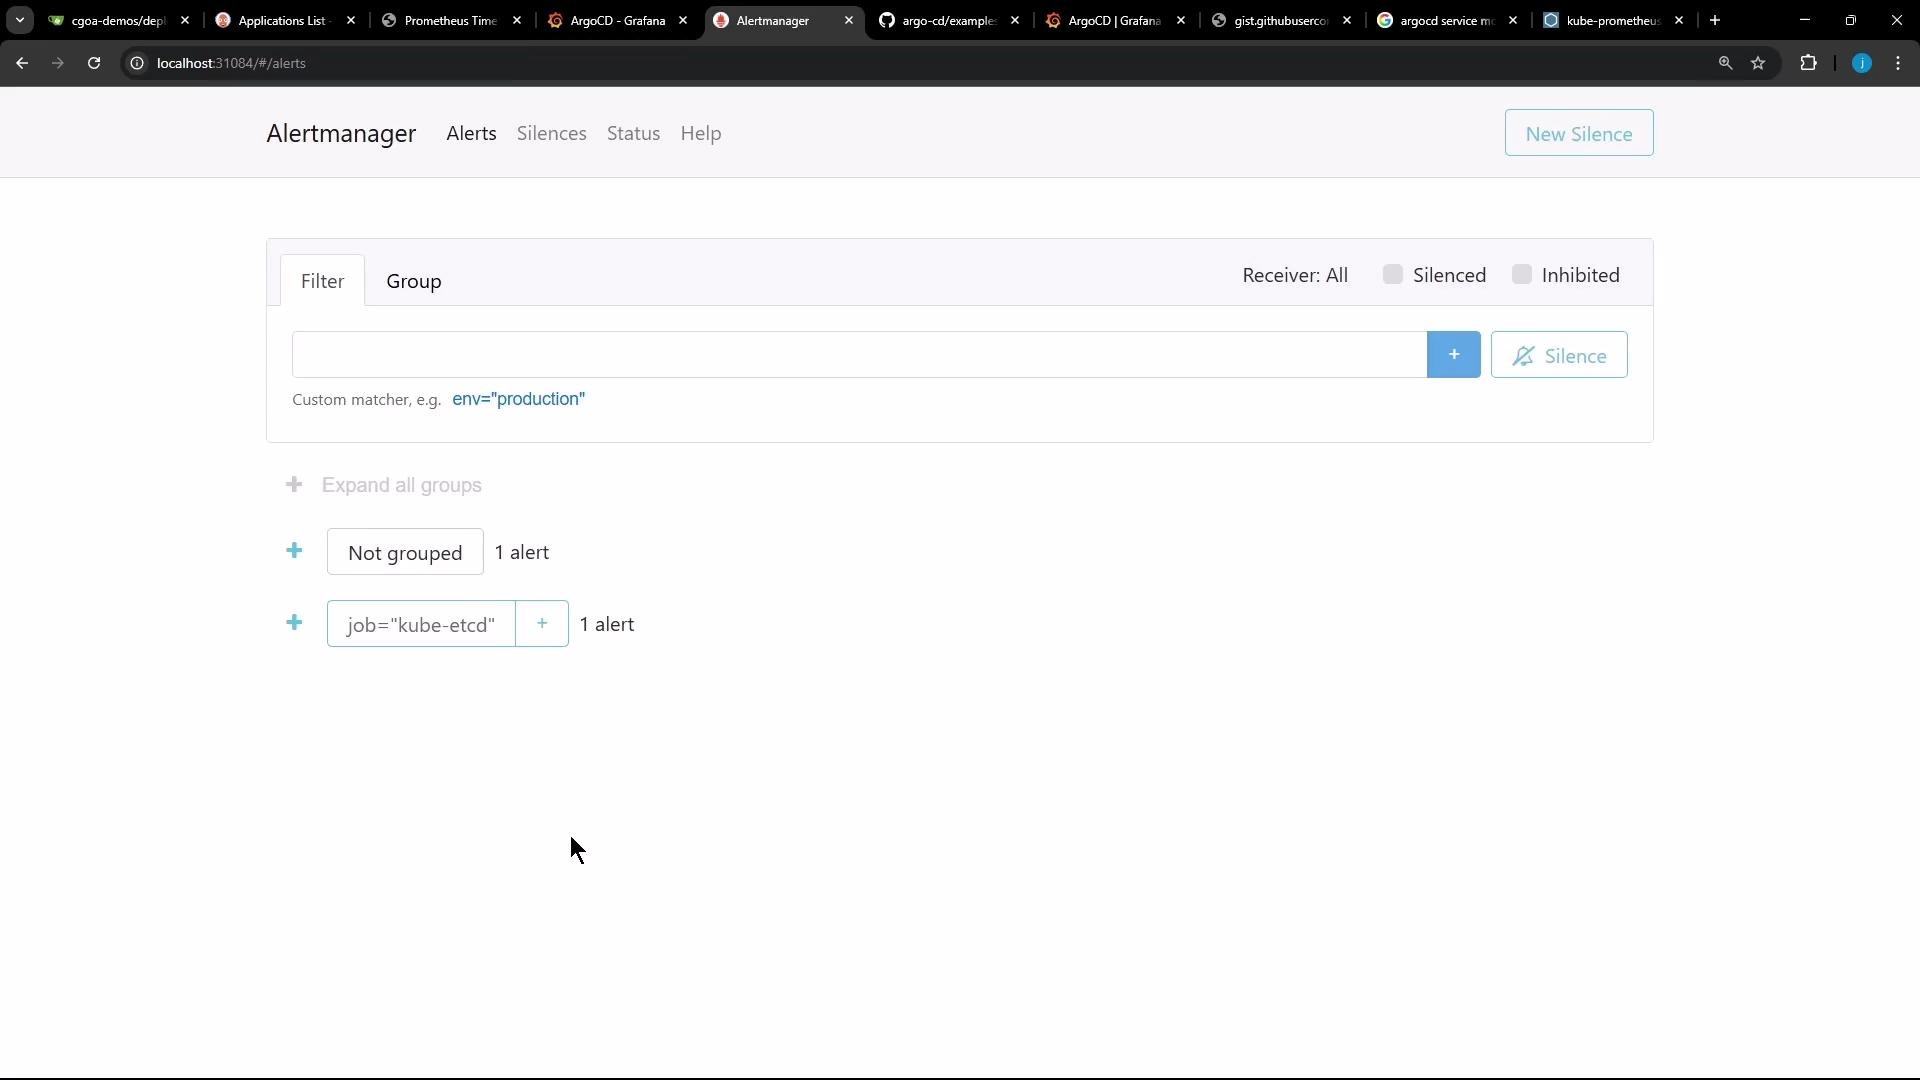
Alertmanager can receive alerts from Prometheus and forward them (Slack, email, webhook). In the next lesson we’ll create Prometheus alerting rules and Alertmanager routes/receivers.
The image shows the Alertmanager interface displaying two alerts, one not grouped and another labeled with "job='kube-etcd'." Various filtering and silencing options are available at the top.
Callout: ServiceMonitor label matching
Always ensure the metadata.labels.release on your ServiceMonitor objects matches the serviceMonitorSelector.matchLabels.release value from your Prometheus CR. If they don’t match, Prometheus will not discover or scrape those ServiceMonitors.
That concludes this lesson — you should now have Prometheus scraping Argo CD metrics and Grafana visualizing them. Next, we’ll implement alerts that trigger when applications drift from their desired state. Links and references

Watch Video