

DORA metrics: key indicators of delivery performance
DORA metrics are industry-standard benchmarks that help teams measure how effectively they deliver and operate software. GitOps naturally encourages practices that improve these metrics.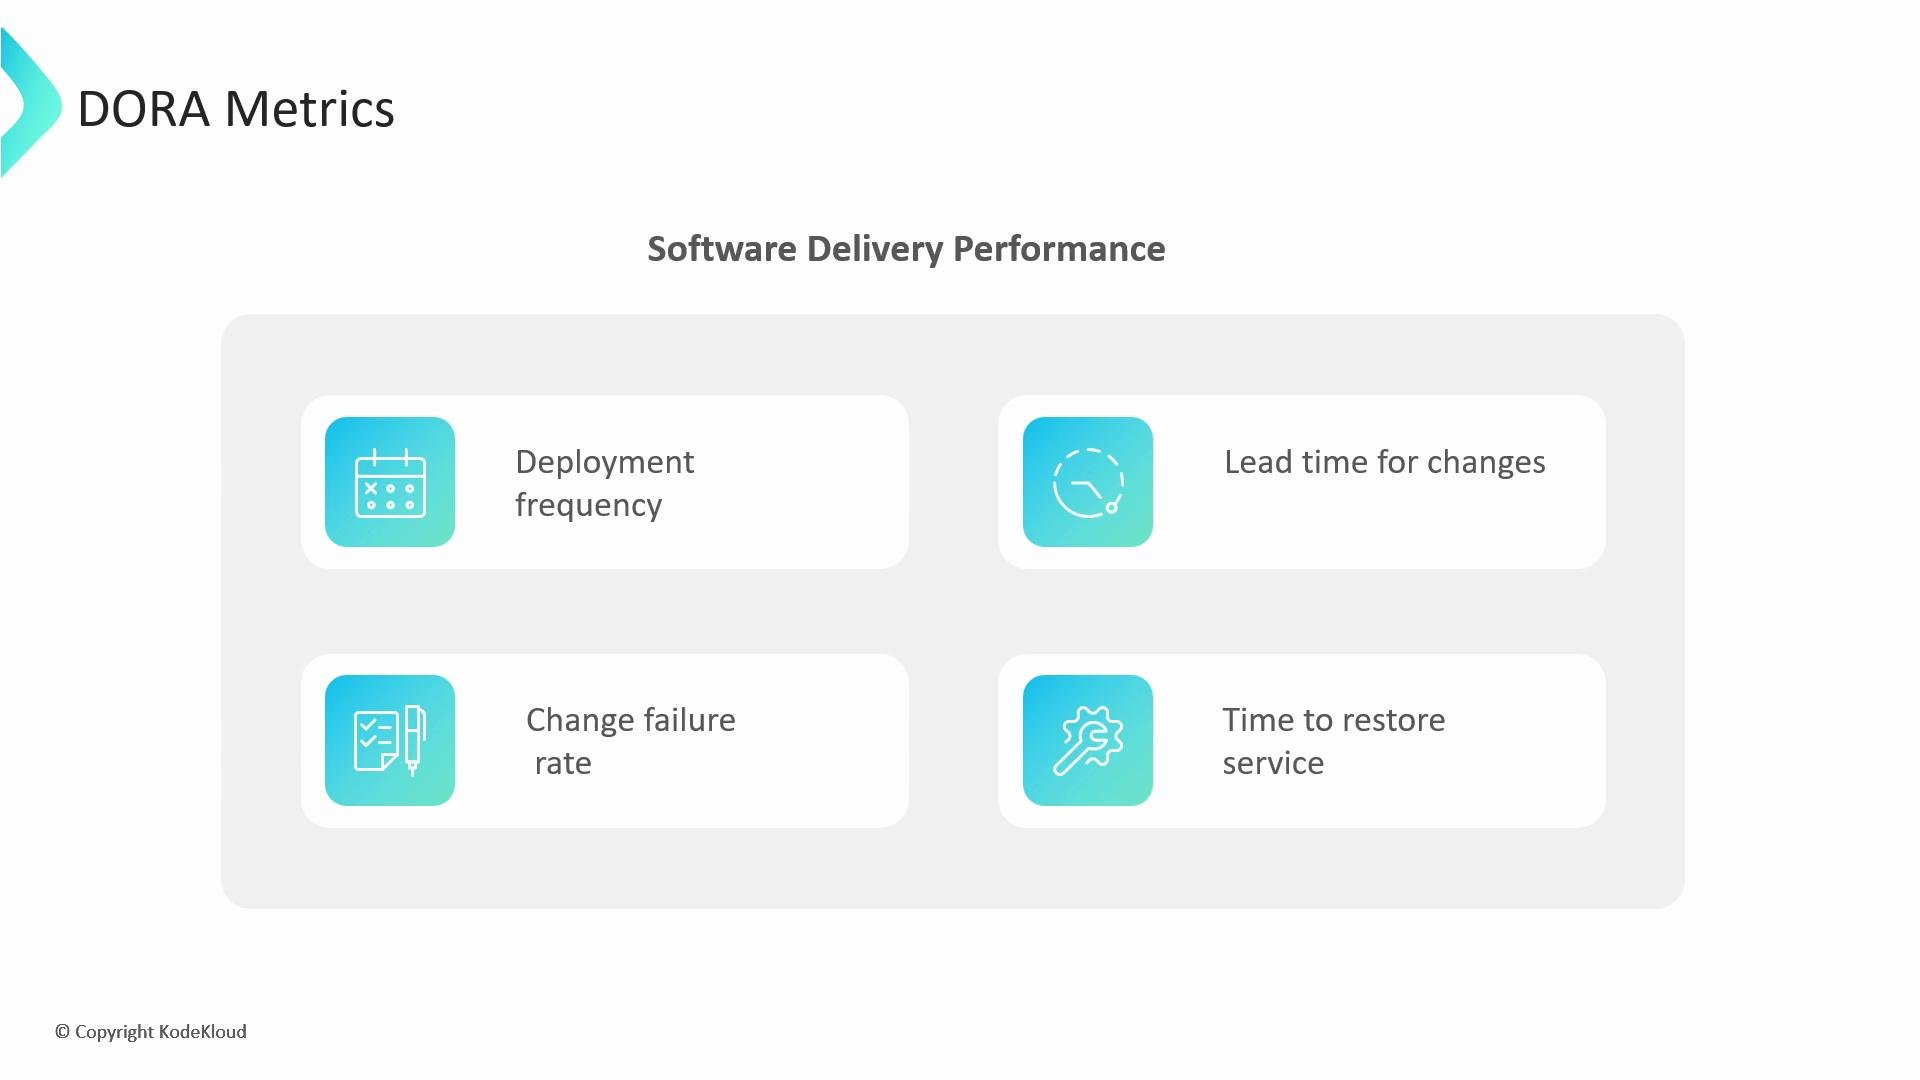
DORA metrics are complementary to GitOps: declarative manifests, version control, and automated reconciliation help improve deployment frequency and reduce lead time and failure rates.
Continuous Integration (CI) and GitOps
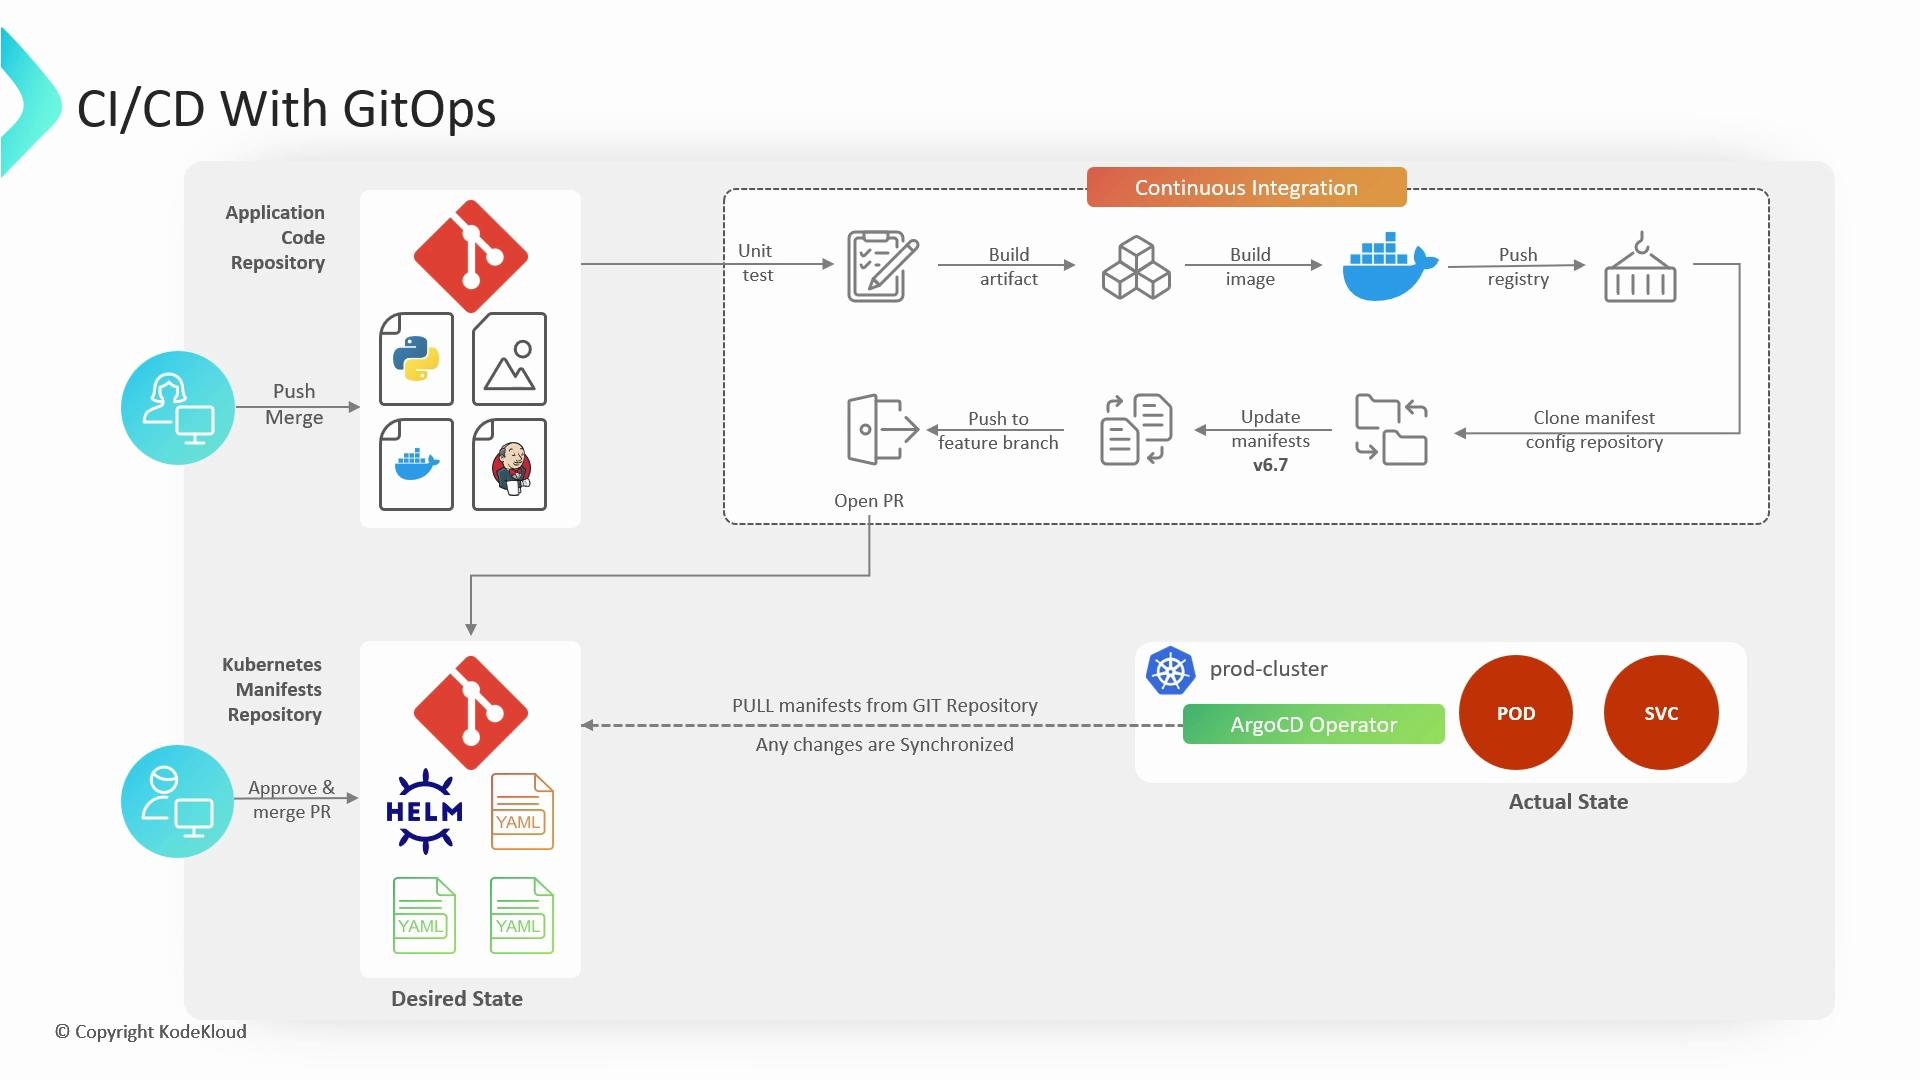
A CI system automates building, testing, and packaging code changes. In a GitOps workflow, CI produces immutable artifacts (for example, container images) and updates the declarative manifests in Git that describe how the application should run.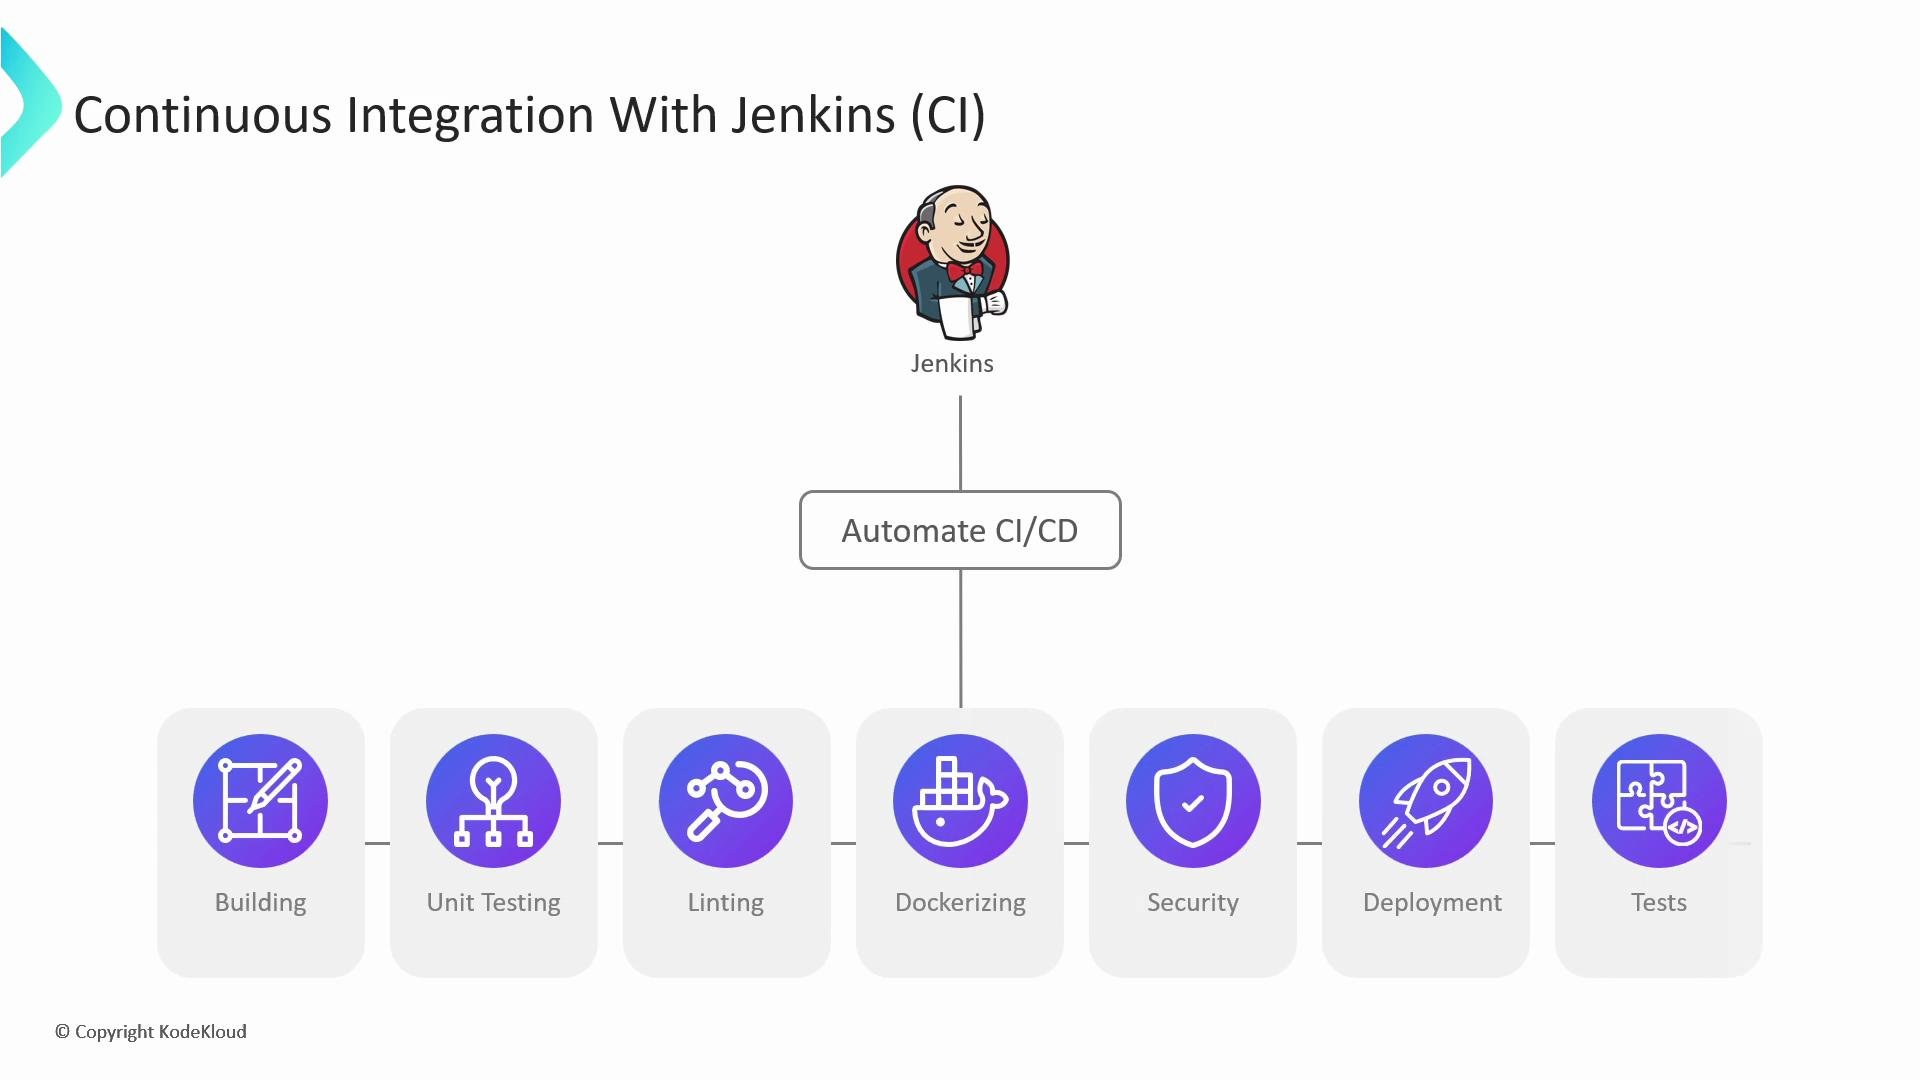
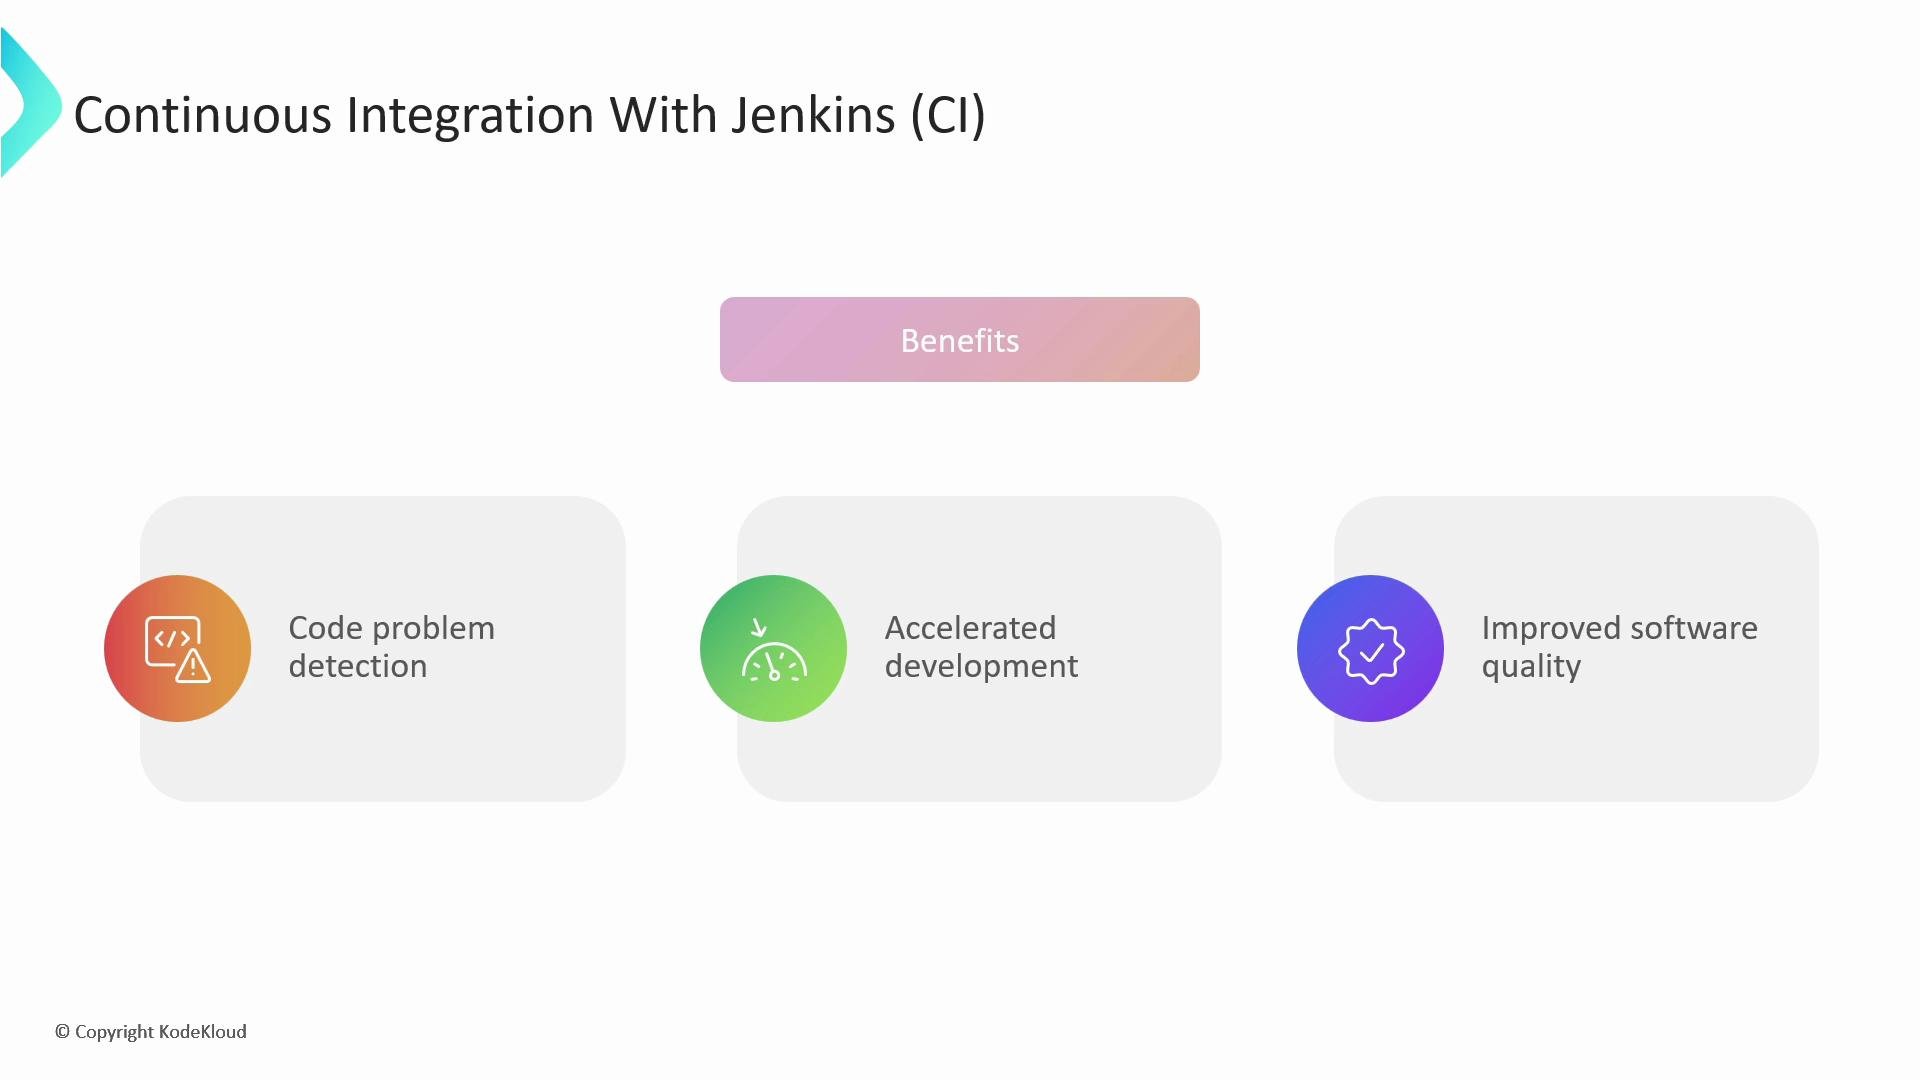
- Build and test artifacts (binaries, container images).
- Push immutable artifacts to a registry.
- Update Kubernetes manifests or Helm charts in the GitOps repository with the new image tags or config.
How GitOps connects CI and the runtime
In a typical GitOps flow, a GitOps operator (e.g., ArgoCD or Flux) continuously compares the Git repository’s desired state to the actual cluster state and reconciles differences.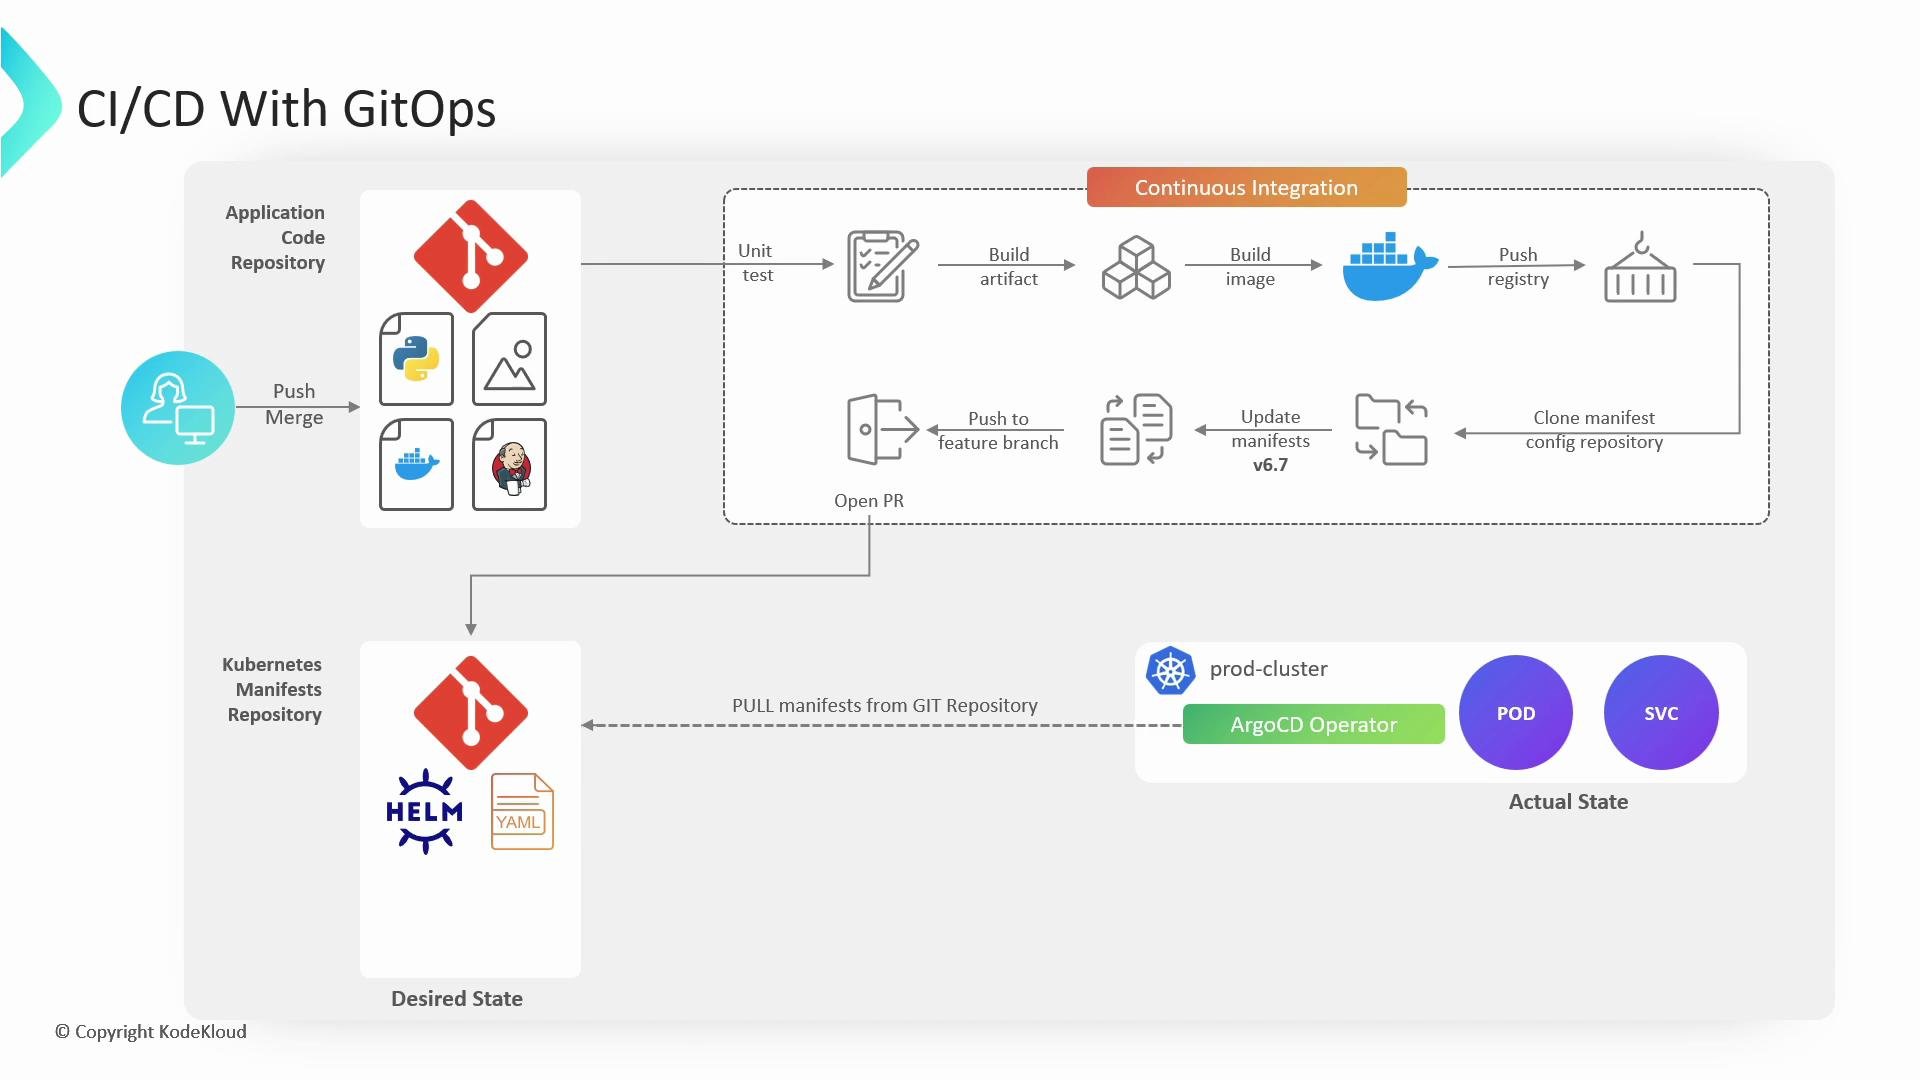
- Developer merges code to the application repository.
- CI pipeline runs tests, builds an image, and pushes it to a container registry.
- CI updates the Kubernetes manifest repository (e.g., updates image tag).
- GitOps operator detects the change in the manifests repo and applies it to the cluster.
- Operator monitors application health and reports discrepancies.
Automatic rollbacks can speed recovery but must be used with care. Ensure health checks and observability thresholds are well-defined to avoid oscillations or cascading rollbacks.
Observability and notifications: closing the feedback loop
Observability tools collect runtime metrics and logs that inform the GitOps workflow about the health of deployments. Prometheus and Grafana are common choices for metrics and visualization, and Alertmanager handles routing and delivering alerts.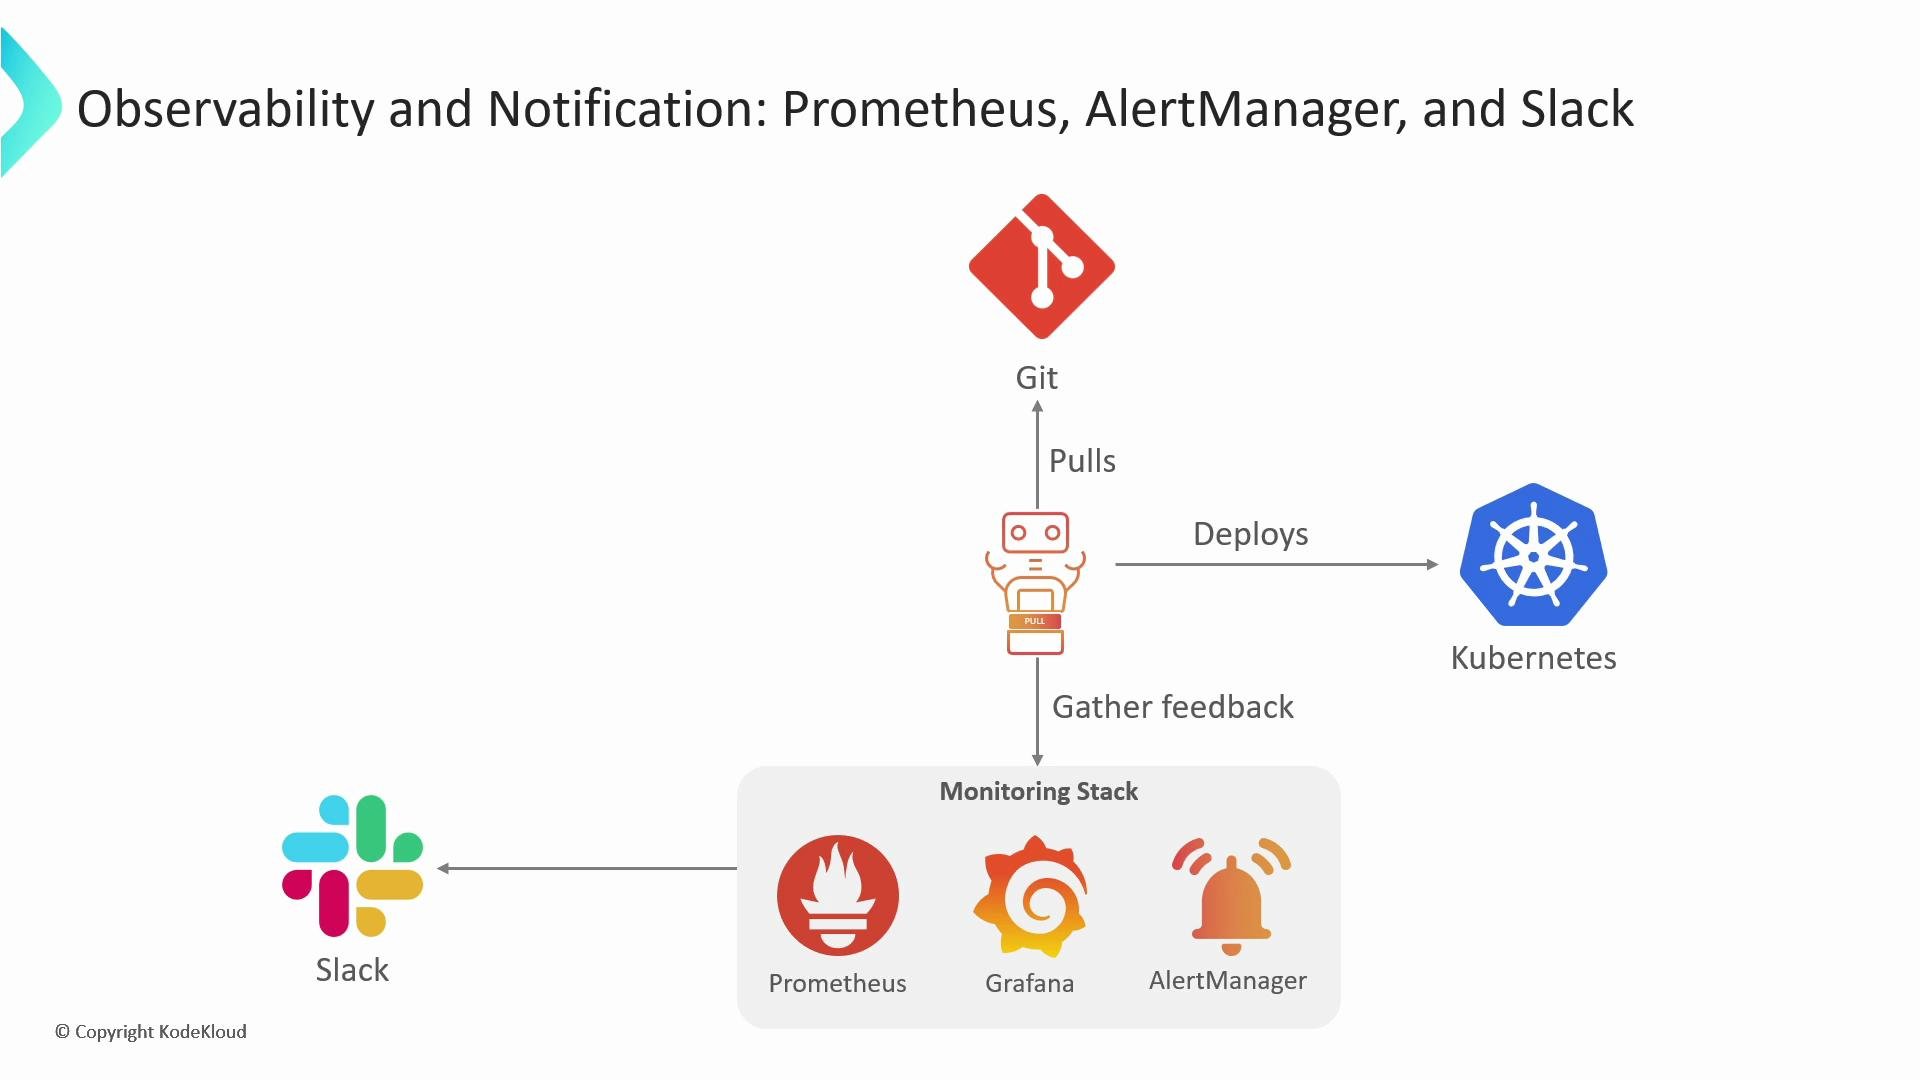
- Prometheus scrapes metrics from pods and infrastructure.
- Alertmanager receives alerts based on Prometheus rules.
- Alertmanager routes notifications to channels such as Slack, email, or webhooks.
- On a detected regression, the team is notified and may revert the Git manifest or trigger automated remediation.
- GitOps operator deploys a new version.
- Prometheus detects increased error rate or latency above thresholds.
- Alertmanager sends a Slack alert to the on-call channel.
- The team reverts the manifest in Git (or relies on an automated rollback), and the GitOps operator restores the previous state.
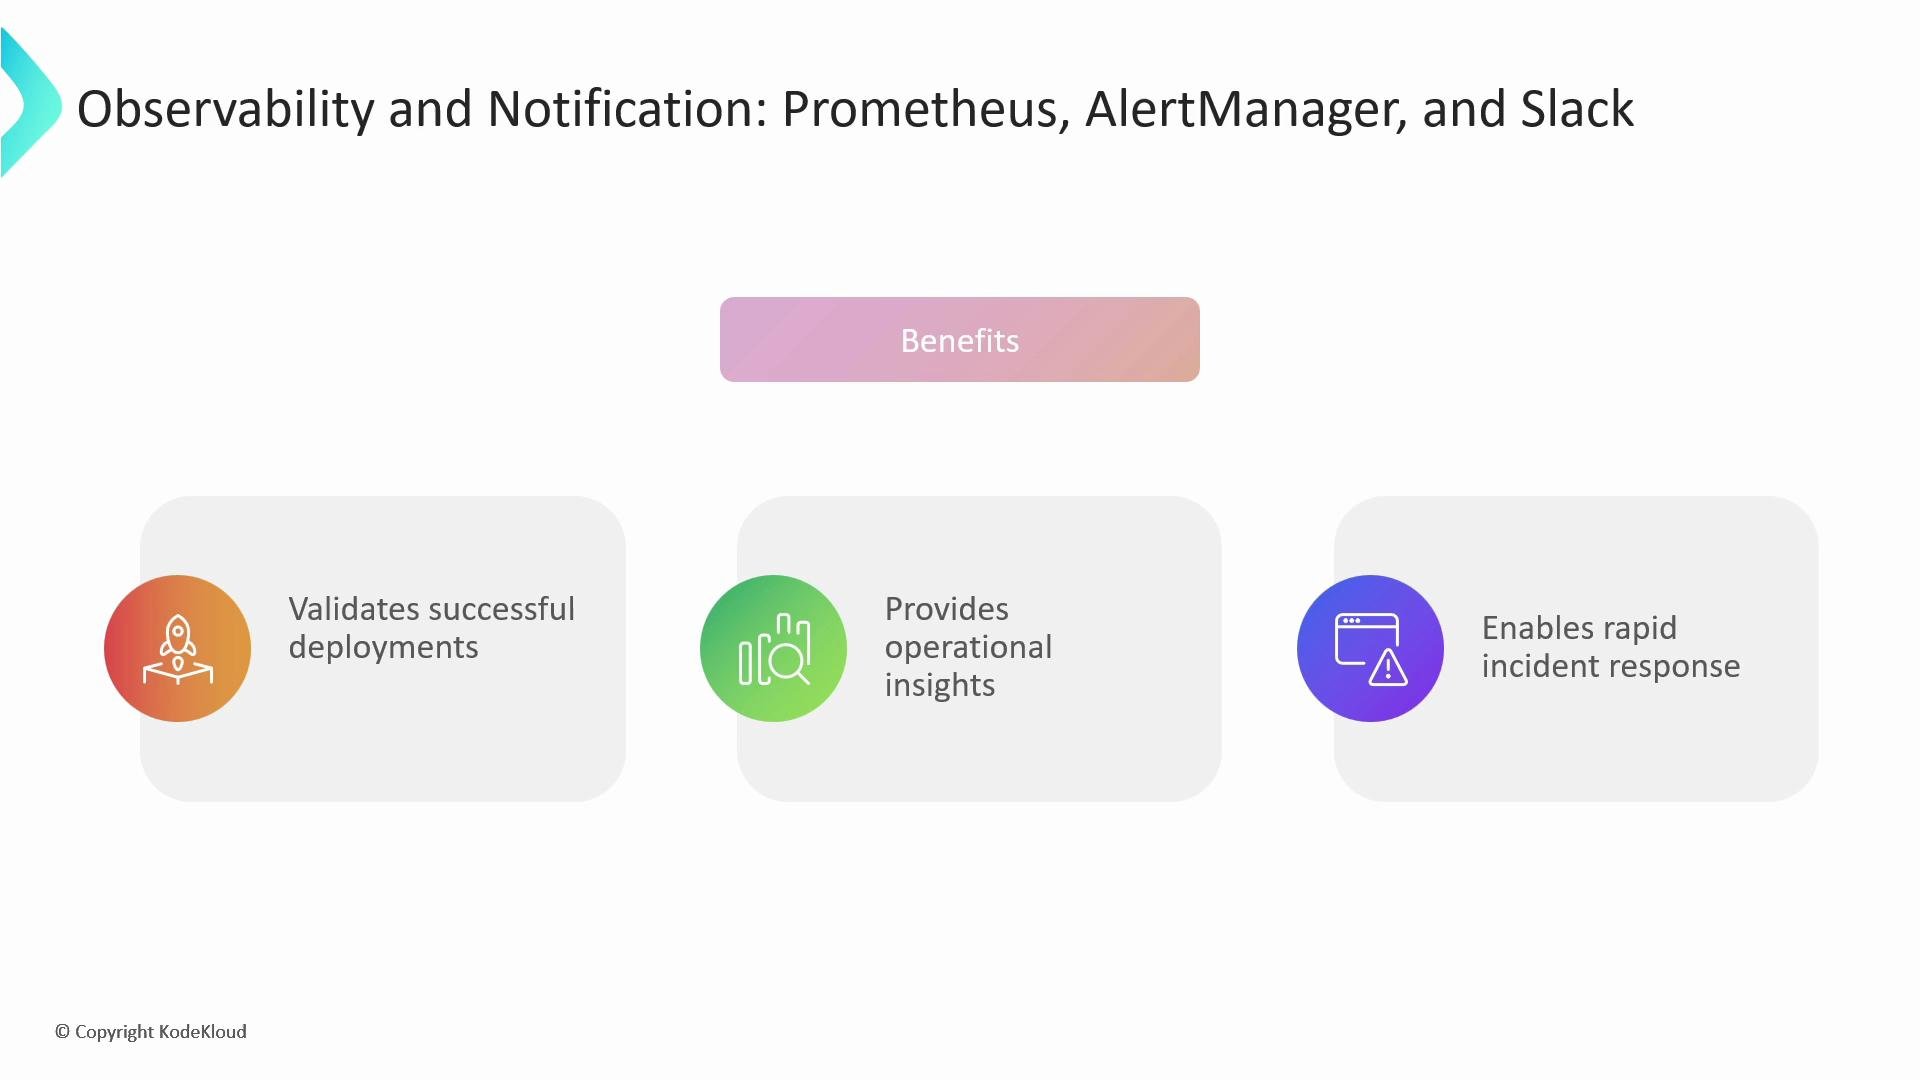
- Validate deployments automatically.
- Gain operational insight into production behavior.
- Enable faster incident detection and response, improving DORA metrics like time to restore service.
References and further reading
- Jenkins (CI): https://learn.kodekloud.com/user/courses/jenkins
- ArgoCD (GitOps operator): https://learn.kodekloud.com/user/courses/gitops-with-argocd
- FluxCD (GitOps operator): https://learn.kodekloud.com/user/courses/gitops-with-fluxcd
- Prometheus & Grafana (Monitoring): https://learn.kodekloud.com/user/courses/aiops-foundations-intelligent-monitoring-with-prometheus-grafana