

What is LLDB?
LLDB (Low-Level Debugger) is an efficient and user-friendly debugger that is part of the LLVM project. As the default debugger on macOS, it enables you to pause program execution, inspect variables, and step through code interactively.
Introducing Rust LLDB
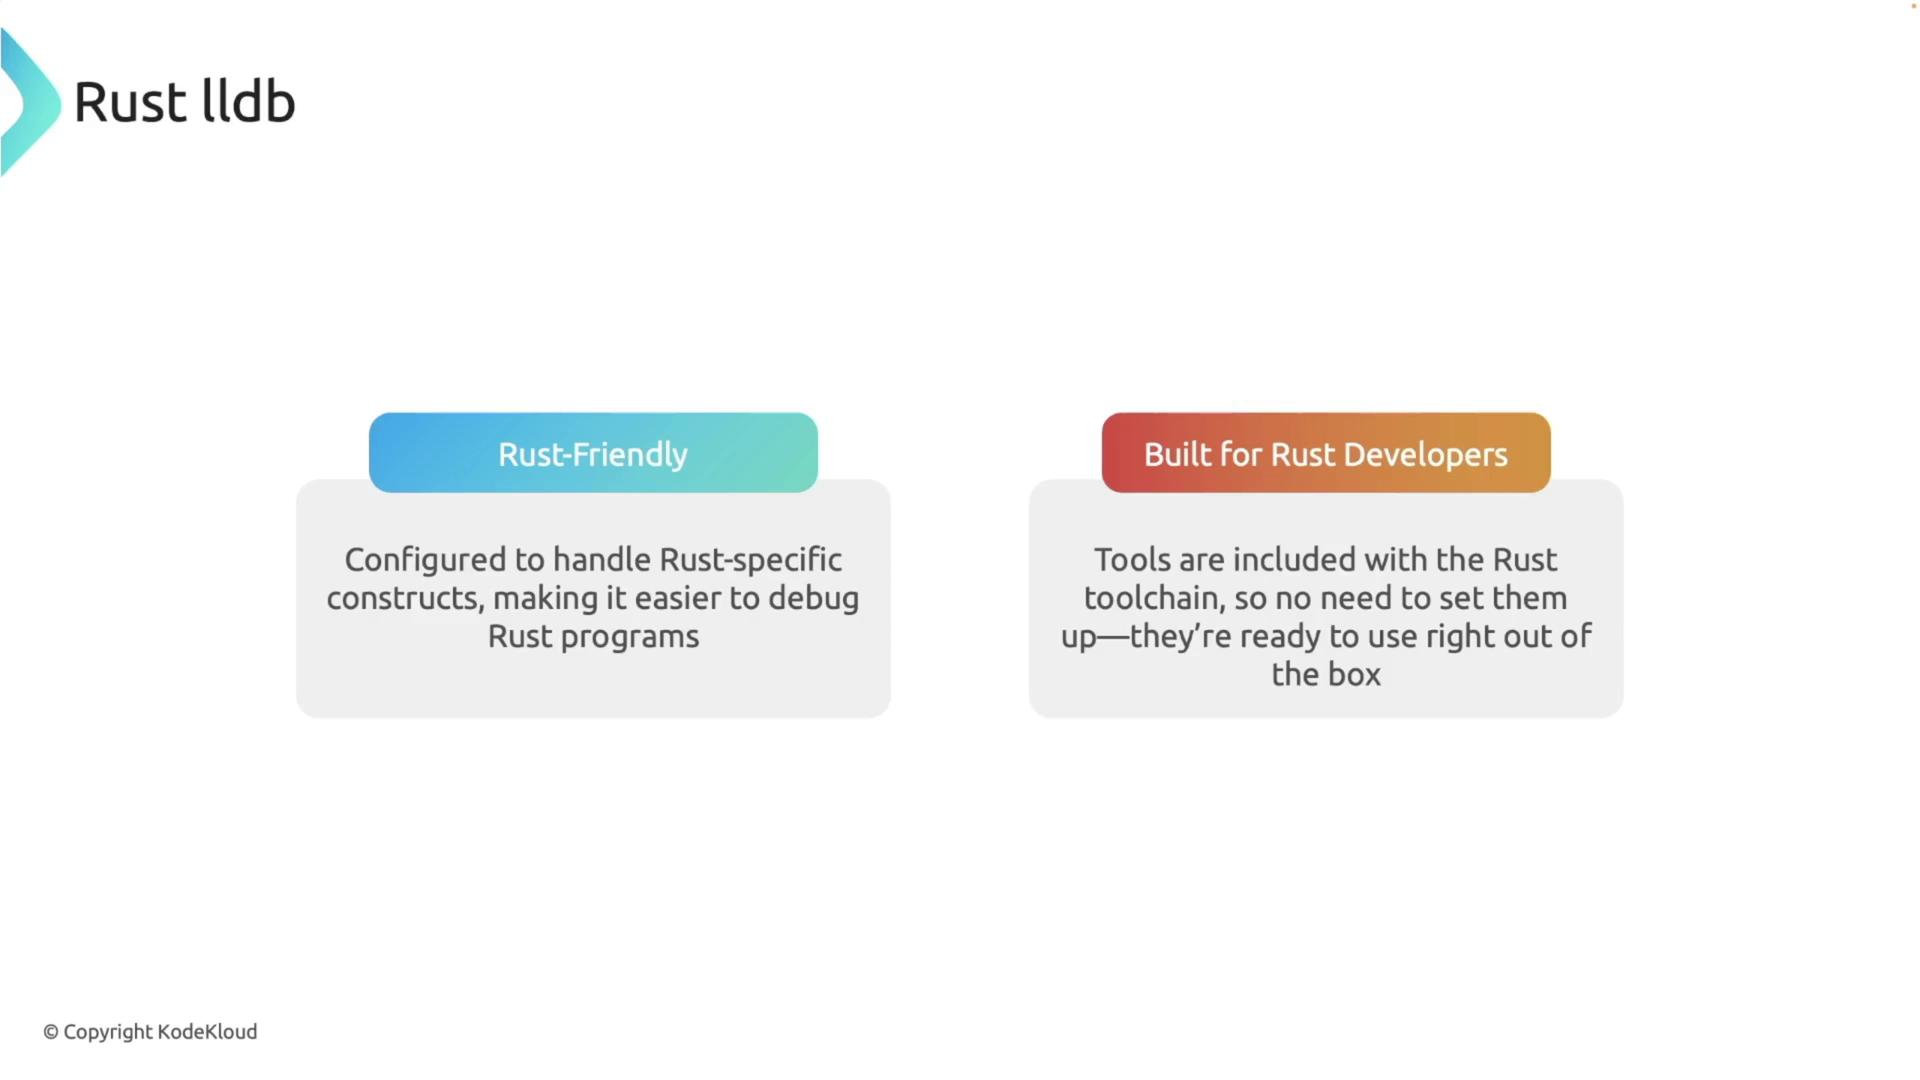
Rust LLDB is a customized version of LLDB designed specifically for Rust. It is configured to understand Rust’s unique memory management, data types, and error handling. This Rust-friendly debugger is integrated seamlessly into the Rust toolchain. If you installed Rust via Rustup, Rust LLDB is already available. Confirm your installation with: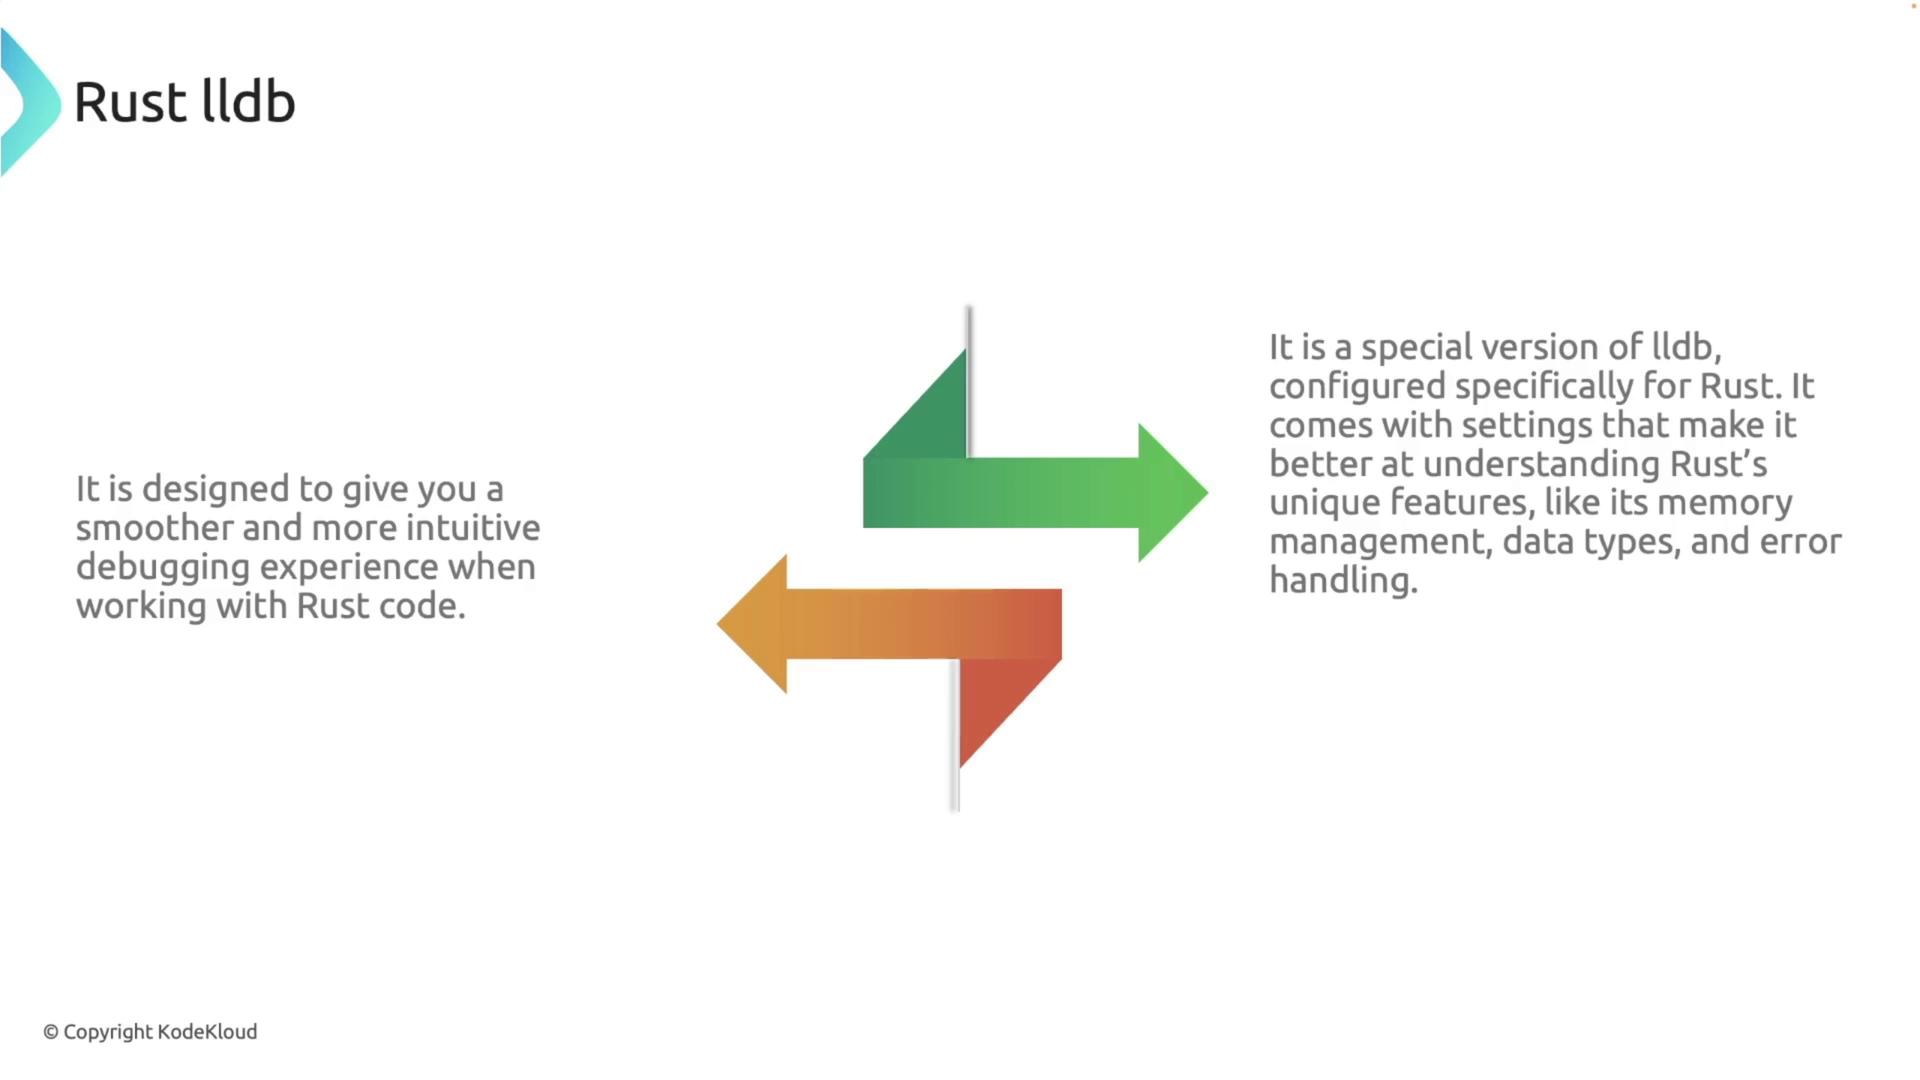
Launching Rust LLDB
To start debugging, launch Rust LLDB by executing the following command with the compiled executable from your project’s debug directory:Writing and Compiling a Factorial Program
Before debugging, compile your Rust program with debug information. Below is a basic example of a factorial function:Introducing a Bug for Debugging
To demonstrate the debugging process, let’s intentionally introduce a subtle bug. Instead of subtracting 1 in the recursive call, we accidentally add 1:help for a list of available commands.
Setting Breakpoints and Starting a Debug Session
You can set breakpoints to inspect your code execution. To set a breakpoint at the beginning of thefactorial function, enter:
n:
n increases rather than decreasing. For example, after stepping into the recursive call, you might see:
n becomes 6 and continues increasing, which prevents the recursion from reaching its base case and ultimately leads to a stack overflow.
Using an incorrect recursive call (i.e., adding instead of subtracting) will cause an infinite loop, leading to a stack overflow error. Always verify the logic of recursive functions.
Fixing the Bug
Exit the debugger and correct the error by replacingn + 1 with n - 1 in the recursive call. The fixed code is:
By using Rust LLDB to step through your code and inspect variable values, you can efficiently pinpoint and resolve subtle bugs in your Rust applications.