Reliability doesn’t come for free — higher reliability targets drive exponential increases in cost, operational complexity, and required expertise. Small-looking changes in the number of “9s” (e.g., 99.9% → 99.99%) often imply large jumps in redundancy, automation, and engineering effort. Understanding the economics of reliability helps you make defensible trade-offs, set realistic SLOs, and explain those decisions to stakeholders. When you can show the cost behind a reliability target, you move from implementer to trusted advisor on how the business should invest in reliability. The reliability cost trade-off typically follows an exponential curve: each extra “9” can cost 10×, 50×, or even 100× more. The goal is balance: perfect reliability is impossible and pursuing it blindly can bankrupt you. Define a reasonable error budget so the team can take calculated risks and continue developing the product.
A slide titled "The Reliability-Cost Trade off" showing an exponential cost curve that rises steeply as reliability increases (markers at 99.9% and 99.99% and a note saying it often costs 100x more). To the right are three bullets: Operational complexity, Redundancy, and Expertise requirements.
Concrete monthly cost examples (the numbers below are illustrative to show scaling effects):
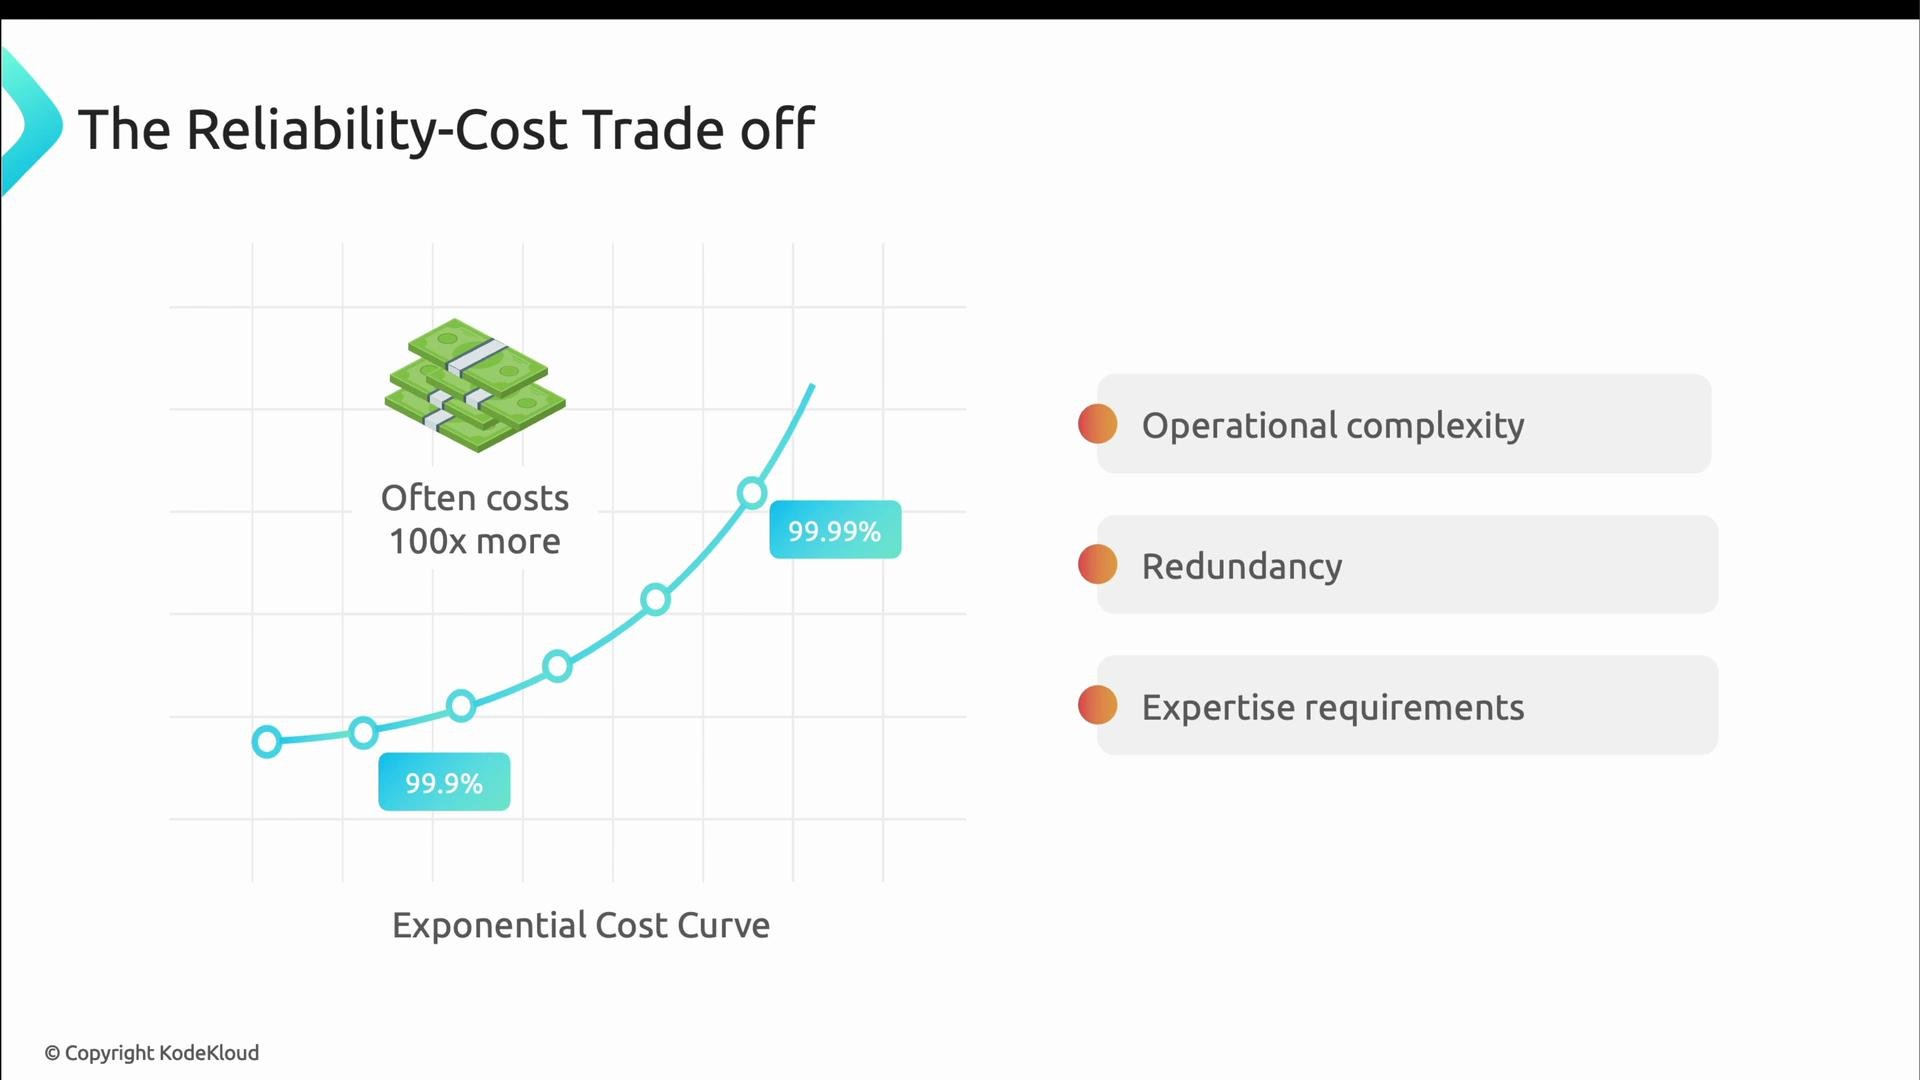
  • Startup e-commerce site
    • 99.9% reliability → ≈ $6,000 / month
    • 99.99% reliability → ≈ $53,000 / month (≈9× increase)
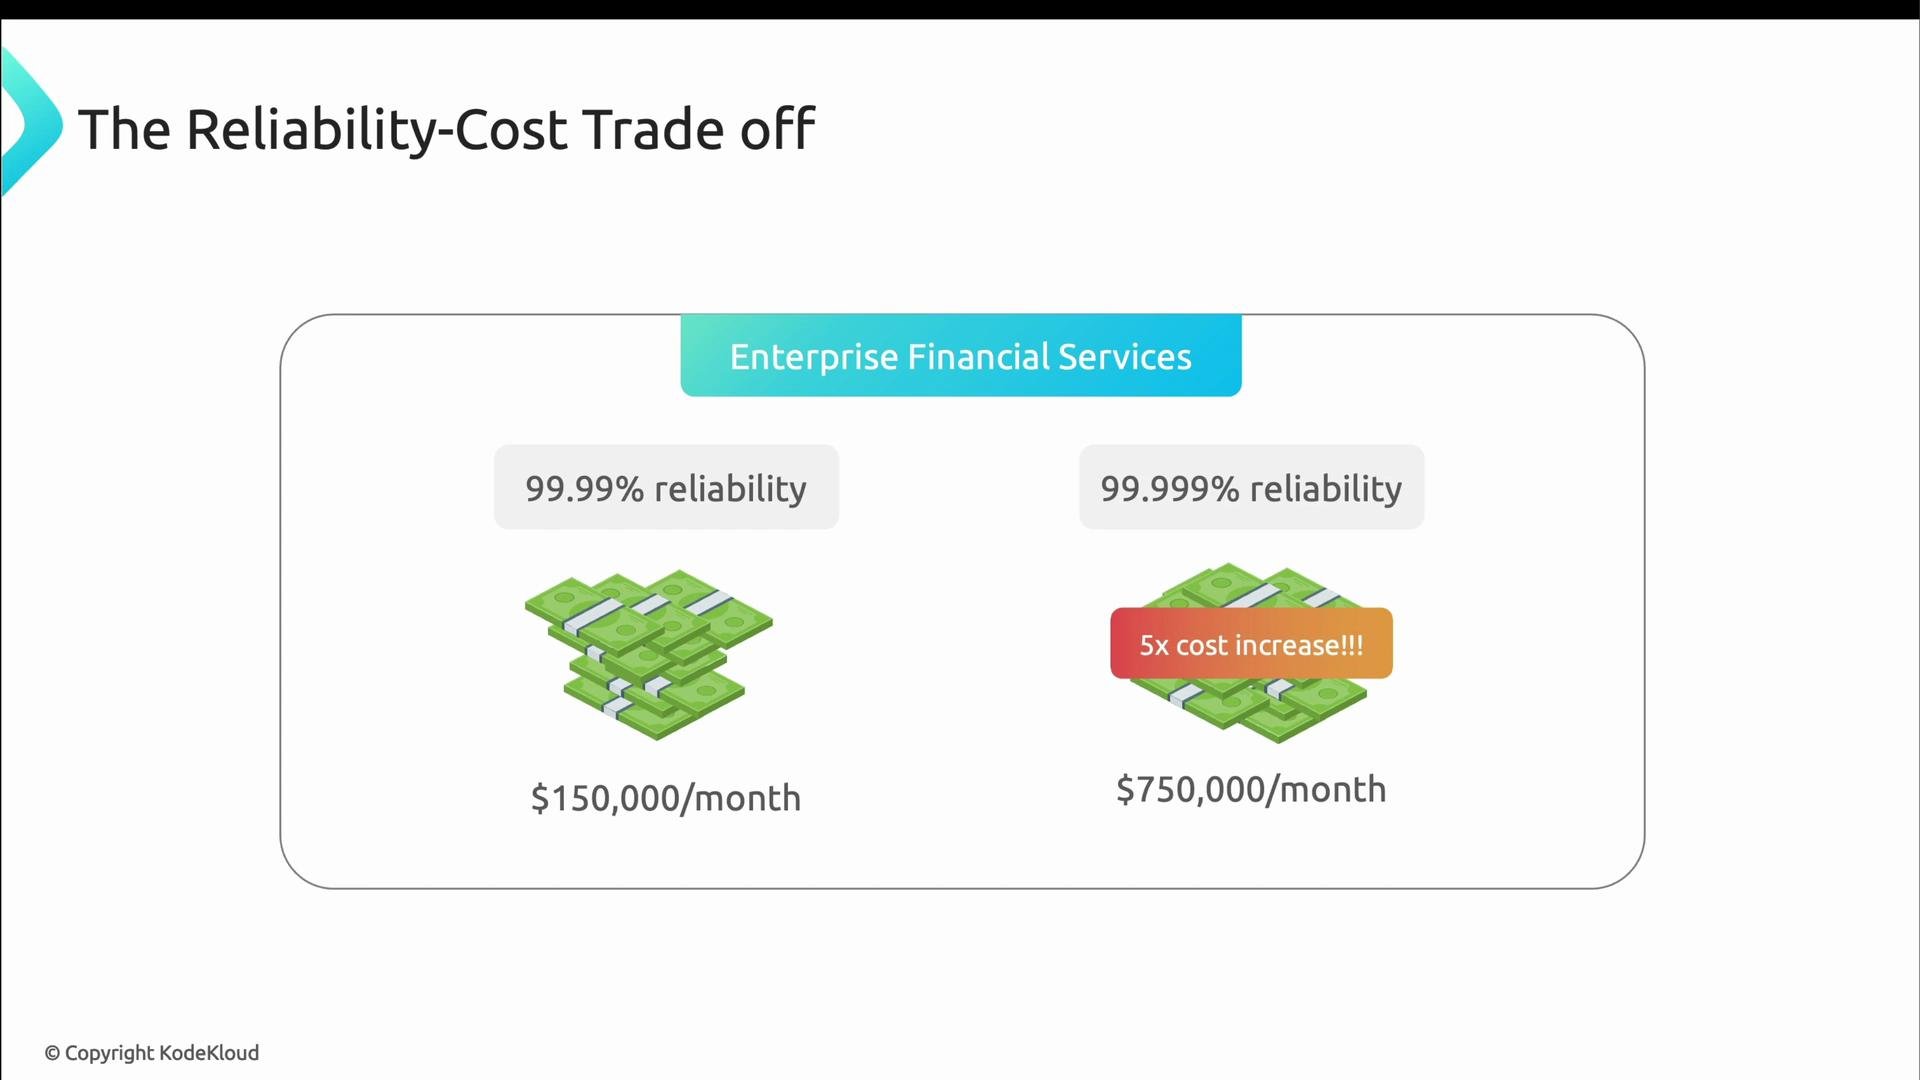
  • Enterprise financial services
    • 99.99% reliability → ≈ $150,000 / month
    • 99.999% reliability → ≈ $750,000 / month (≈5× increase)
The key question for any organization: does the business need that extra nine, or could the budget be better spent elsewhere?
A slide titled "The Reliability-Cost Trade off" comparing enterprise financial services costs. It shows 99.99% reliability at 150,000/month versus 99.999% reliability at 750,000/month (a 5x cost increase), illustrated with stacks of cash.
Reliability also involves trade-offs between over‑engineering and under‑engineering:
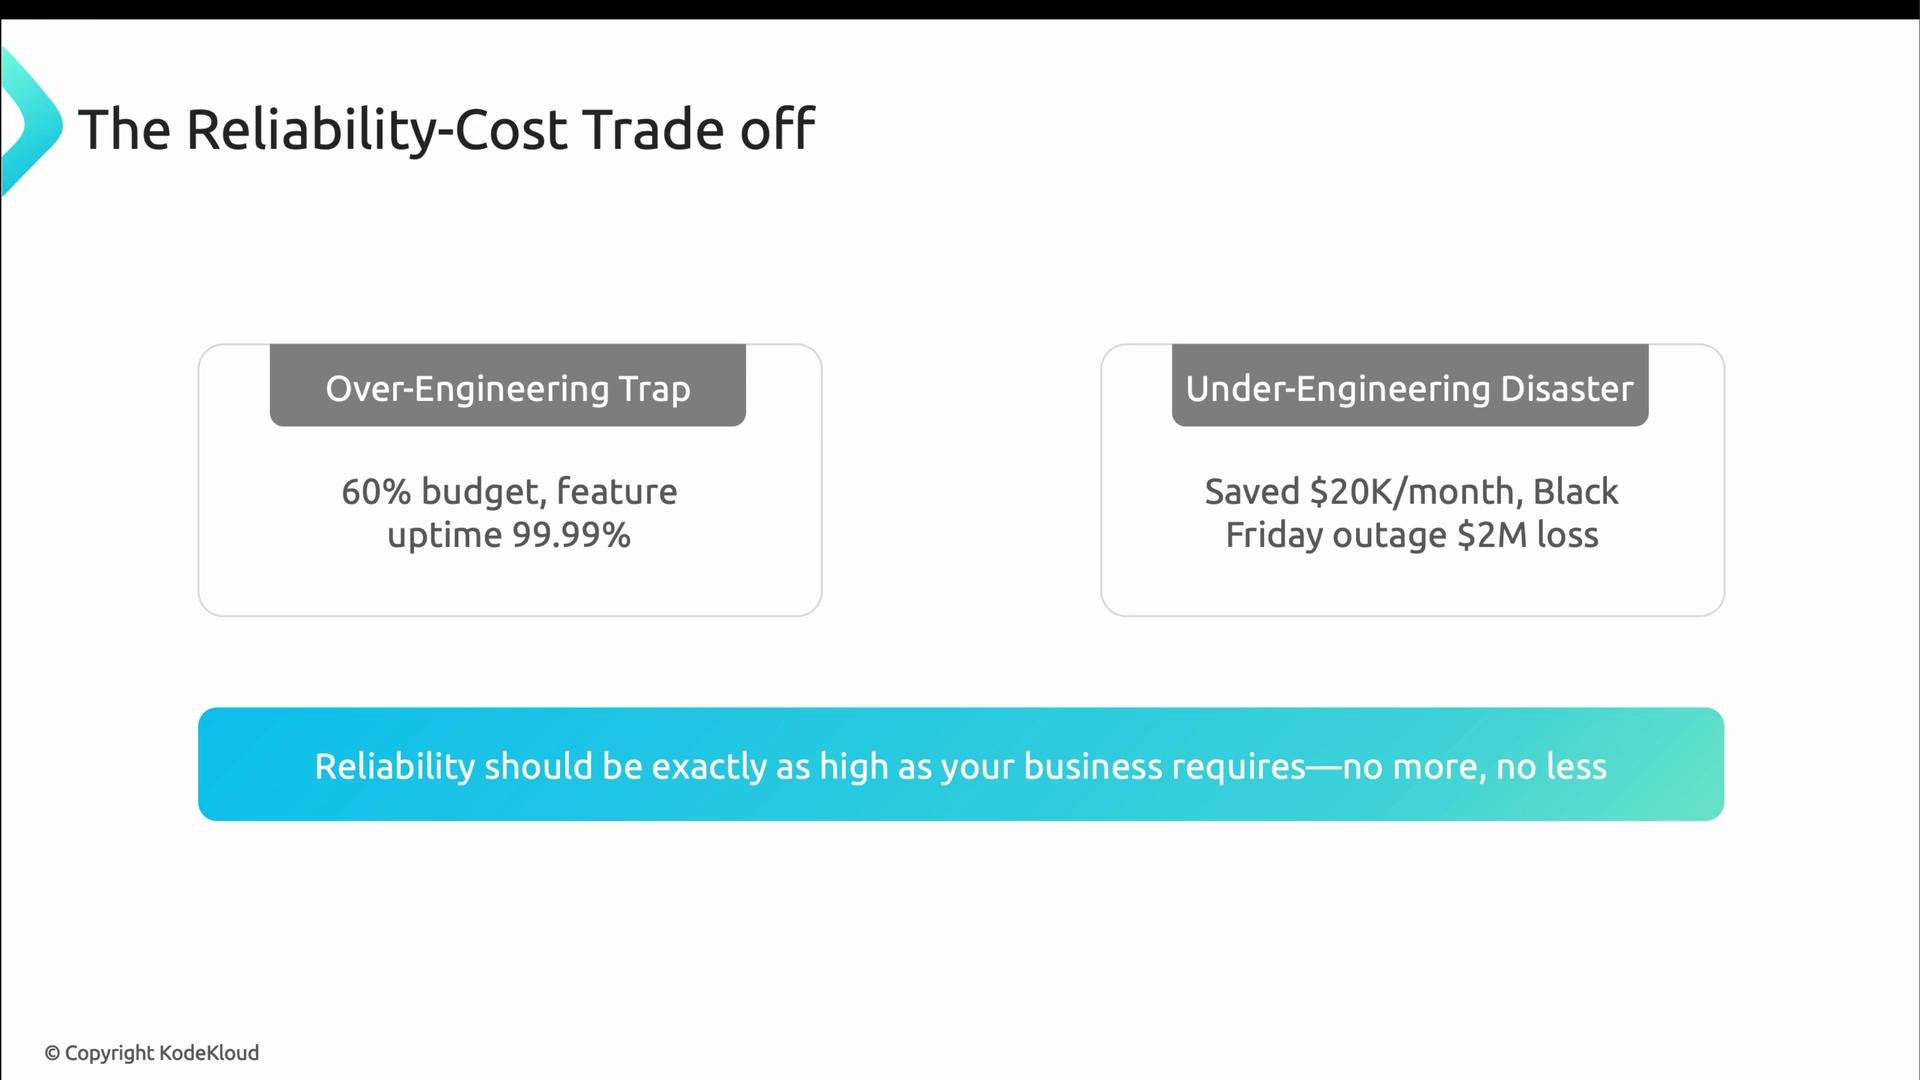
  • Over‑engineering trap: Spending a disproportionate portion of engineering budget (e.g., 60%) to reach four nines for a feature used by only 10% of customers, while the core product runs at 99.5% — misaligned investment.
  • Under‑engineering disaster: Cutting $20K/month in infrastructure costs, then suffering a major outage (for example on Black Friday) that costs millions in lost revenue and reputation.
Set reliability where the business requires it — no more, no less.
A slide titled "The Reliability-Cost Trade off" showing two boxes: an "Over-Engineering Trap" (60% budget, uptime 99.99%) and an "Under-Engineering Disaster" (saved 20K/month but caused a 2M Black Friday outage). A blue banner below reads "Reliability should be exactly as high as your business requires—no more, no less."
Autoscaling is one of the largest levers for controlling reliability cost. The right autoscaling strategy keeps services available without paying for excessive idle capacity; the wrong strategy either wastes money or causes outages. Common autoscaling approaches:
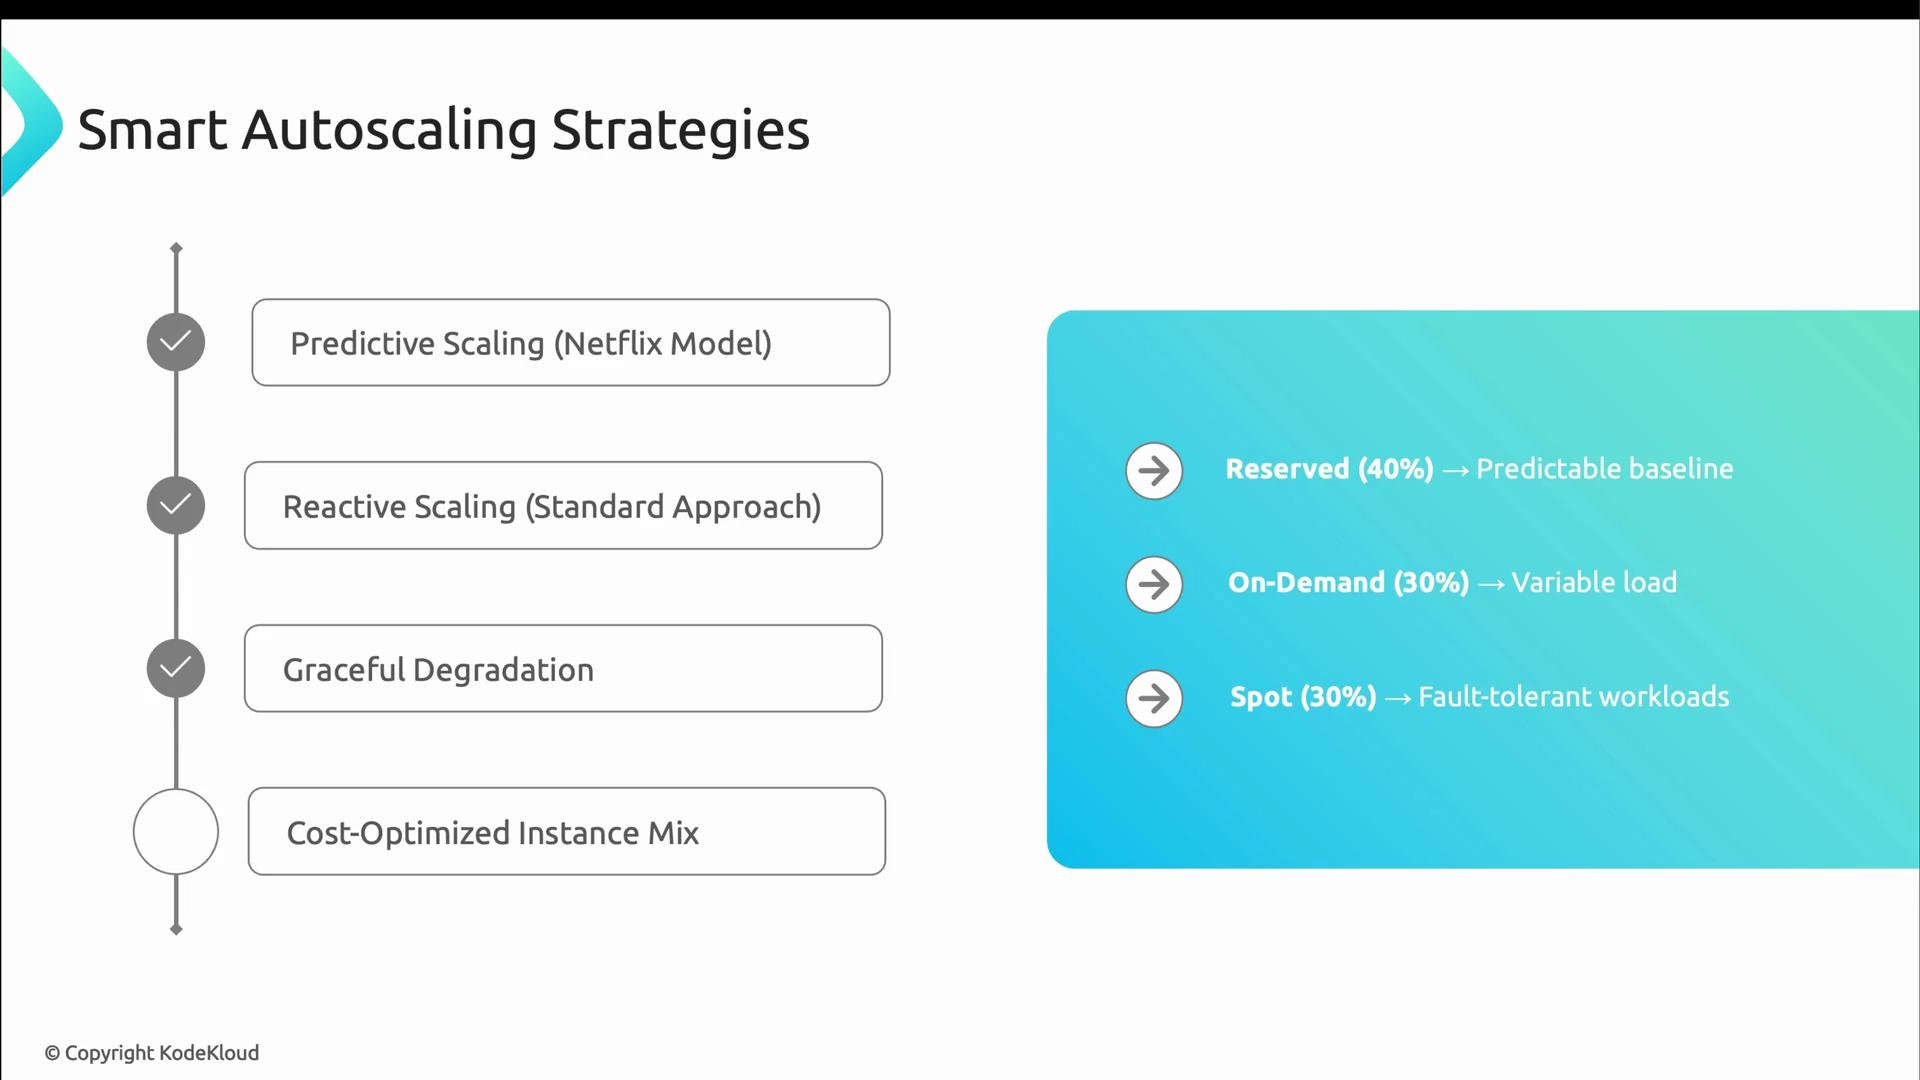
  • Predictive scaling: Forecast traffic spikes and scale out in advance (used at scale by companies such as Netflix).
  • Reactive scaling: Increase replicas/resources when metrics (CPU, memory, queue depth) cross thresholds. Kubernetes Horizontal Pod Autoscaler (HPA) is a common reactive tool.
  • Graceful degradation: Reduce or disable lower-priority, expensive features when capacity is constrained so the system remains available.
  • Cost‑optimized instance mix: Combine reserved, on‑demand, and spot instances to balance predictable baseline capacity and inexpensive burst capacity.
Example Kubernetes HPA-style fragment (min/max replicas and target CPU):
spec:
  minReplicas: 3
  maxReplicas: 50
  metrics:
  - type: Resource
    resource:
      name: cpu
      target:
        averageUtilization: 70
Graceful degradation example (application-level fallback to cheaper cached recommendations):
def get_recommendations(user_id, budget_mode=False):
    if budget_mode:
        return get_cached_recommendations(user_id)  # fast, cheap
    else:
        return get_ml_recommendations(user_id)      # slow, expensive
Example instance purchase mix (illustrative):
Instance typeRole
Reserved (40%)Predictable baseline capacity
On‑demand (30%)Variable spikes and sudden load
Spot (30%)Interruptible, fault‑tolerant workloads (batch, analytics)
A presentation slide titled "Smart Autoscaling Strategies" listing four approaches: Predictive Scaling (Netflix Model), Reactive Scaling (Standard Approach), Graceful Degradation, and Cost‑Optimized Instance Mix. On the right a blue panel recommends an instance mix: Reserved 40% (predictable baseline), On‑Demand 30% (variable load), and Spot 30% (fault‑tolerant workloads).
SLO-based budgeting connects reliability targets directly to spend: the error budget effectively becomes a spend budget. The stricter the SLO, the larger the share of budget required for reliability work (redundancy, automation, specialist skills). Observational guidelines:
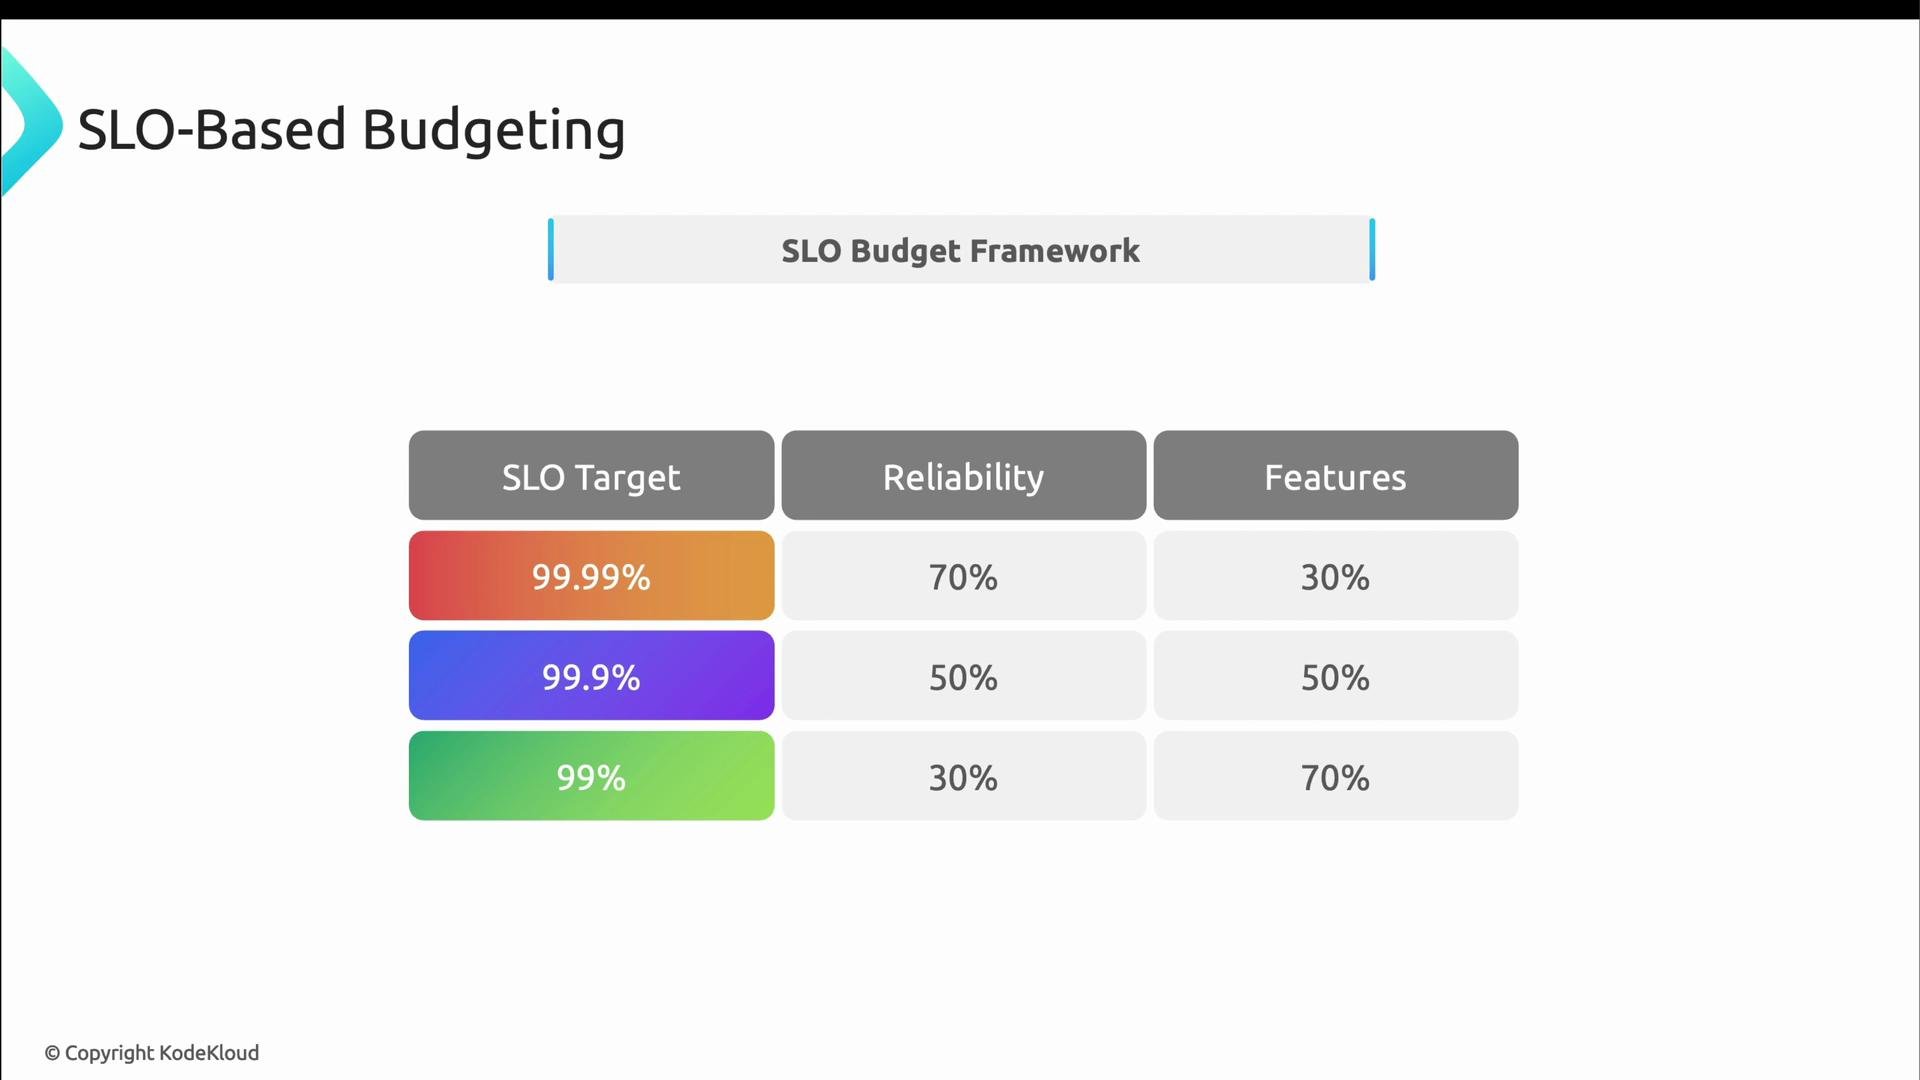
  • 99.99% SLO: very strict — often requires considerable investment and may consume a high fraction of monthly spend.
  • 99.9% SLO: moderate — budgets are often split between reliability and new features.
  • 99% SLO: relaxed — more budget remains available for feature development.
A presentation slide titled "SLO-Based Budgeting" showing "Error Budget = Spend Budget" with a stack of money icon. The footer reads: "The Philosophy: The stricter the SLO, the more budget goes to reliability."
Here’s a compact SLO → budget split reference (table form improves clarity and SEO):
SLO TargetTypical Reliability SpendTypical Features Spend
99.99%~70%~30%
99.9%~50%~50%
99%~30%~70%
A slide titled "SLO-Based Budgeting" showing an "SLO Budget Framework" table that maps SLO targets (99.99%, 99.9%, 99%) to reliability vs. features budget splits (70/30, 50/50, 30/70).
SLOs change with business context. Examples:
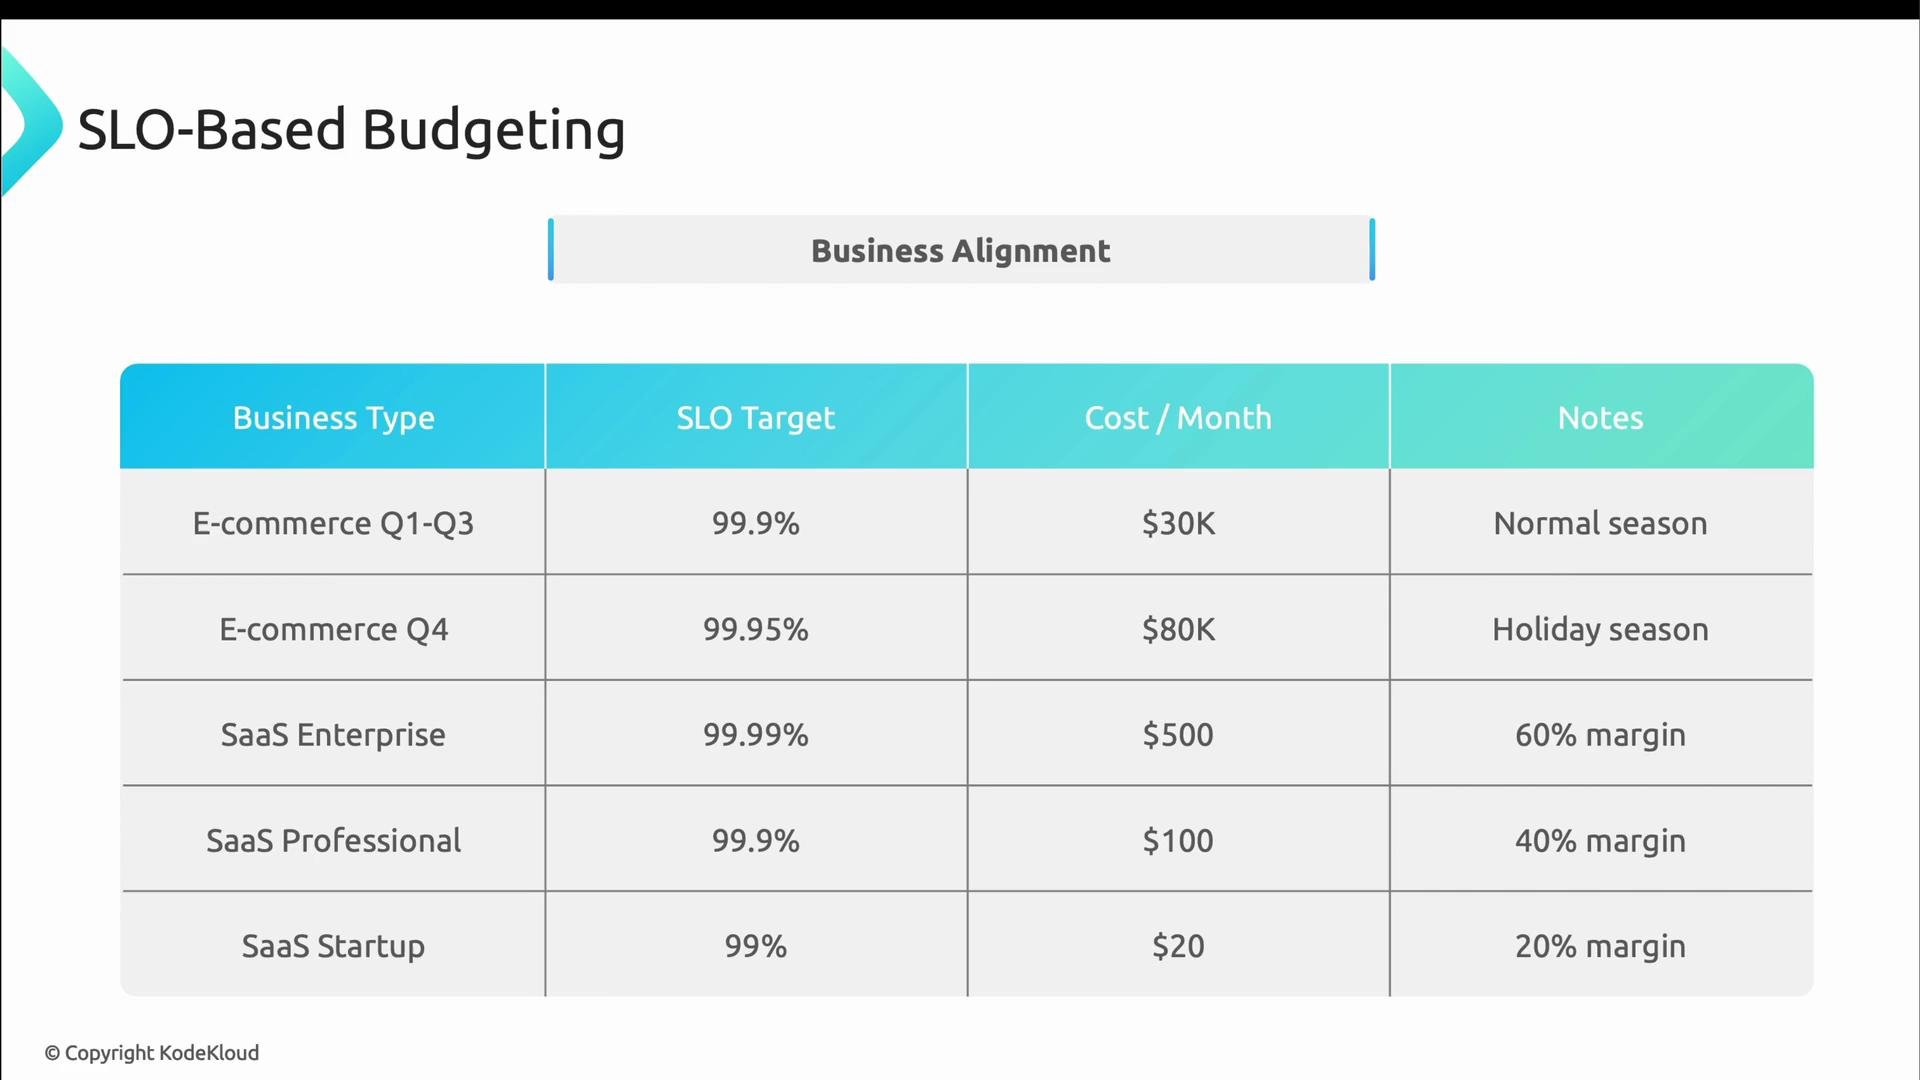
  • E‑commerce might operate at 99.9% for most of the year (~30K/mo),butduringholidayseasontightento99.9530K/mo), but during holiday season tighten to 99.95% with costs nearly tripling (~80K/mo).
  • SaaS vendors commonly tier SLOs: enterprise customers expect four nines (large investment), professional tiers get three nines, entry-level tiers accept lower targets.
A presentation slide titled "SLO-Based Budgeting" showing a table of business types with their SLO targets, monthly costs, and notes. Examples include E‑commerce (Q1–Q3 and Q4) and various SaaS tiers with targets from 99% to 99.99% and costs from 20 to 80K.
Why SLO-based budgeting matters:
  • Business alignment: Higher-value or mission‑critical customers get stricter SLOs funded by higher investment.
  • Resource allocation: Budgets are guided by concrete reliability commitments rather than guesswork.
  • Risk management: When outages burn error budget, prioritize reliability work until the error budget is replenished.
A presentation slide titled "SLO-Based Budgeting" that lists three reasons under "Why This Matters": Business alignment (stricter SLOs for high‑value customers), Resource allocation (budget tied to commitments), and Risk management (adjust when outages consume budget).
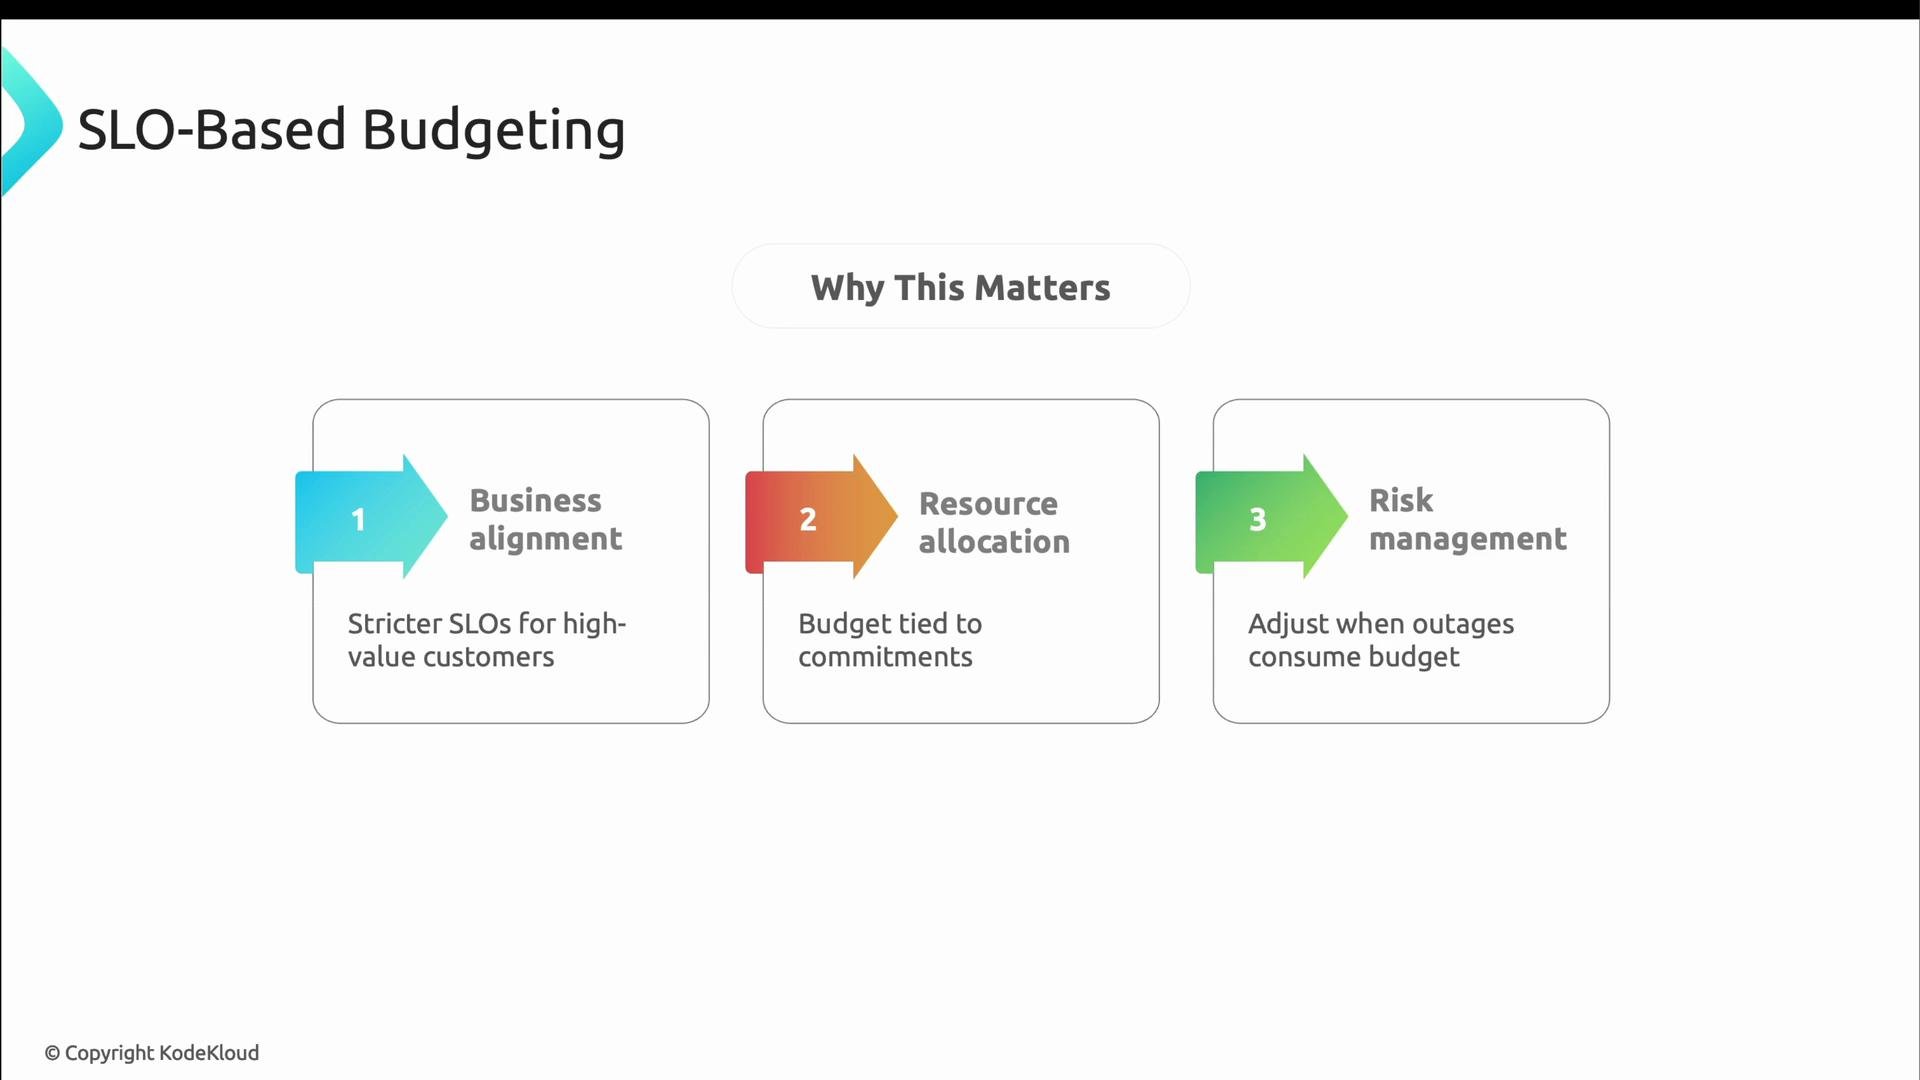
SLOs are business commitments. Use them to transparently decide where to invest: if an outage causes you to burn error budget, that’s a clear signal to prioritize reliability work over feature development until the error budget is replenished.
Google’s SLO-based engineering culture captures this approach: don’t chase 100% reliability — it’s impractical and disproportionately expensive. Instead, set SLOs that match user needs and allocate engineering effort accordingly. Examples from Google:
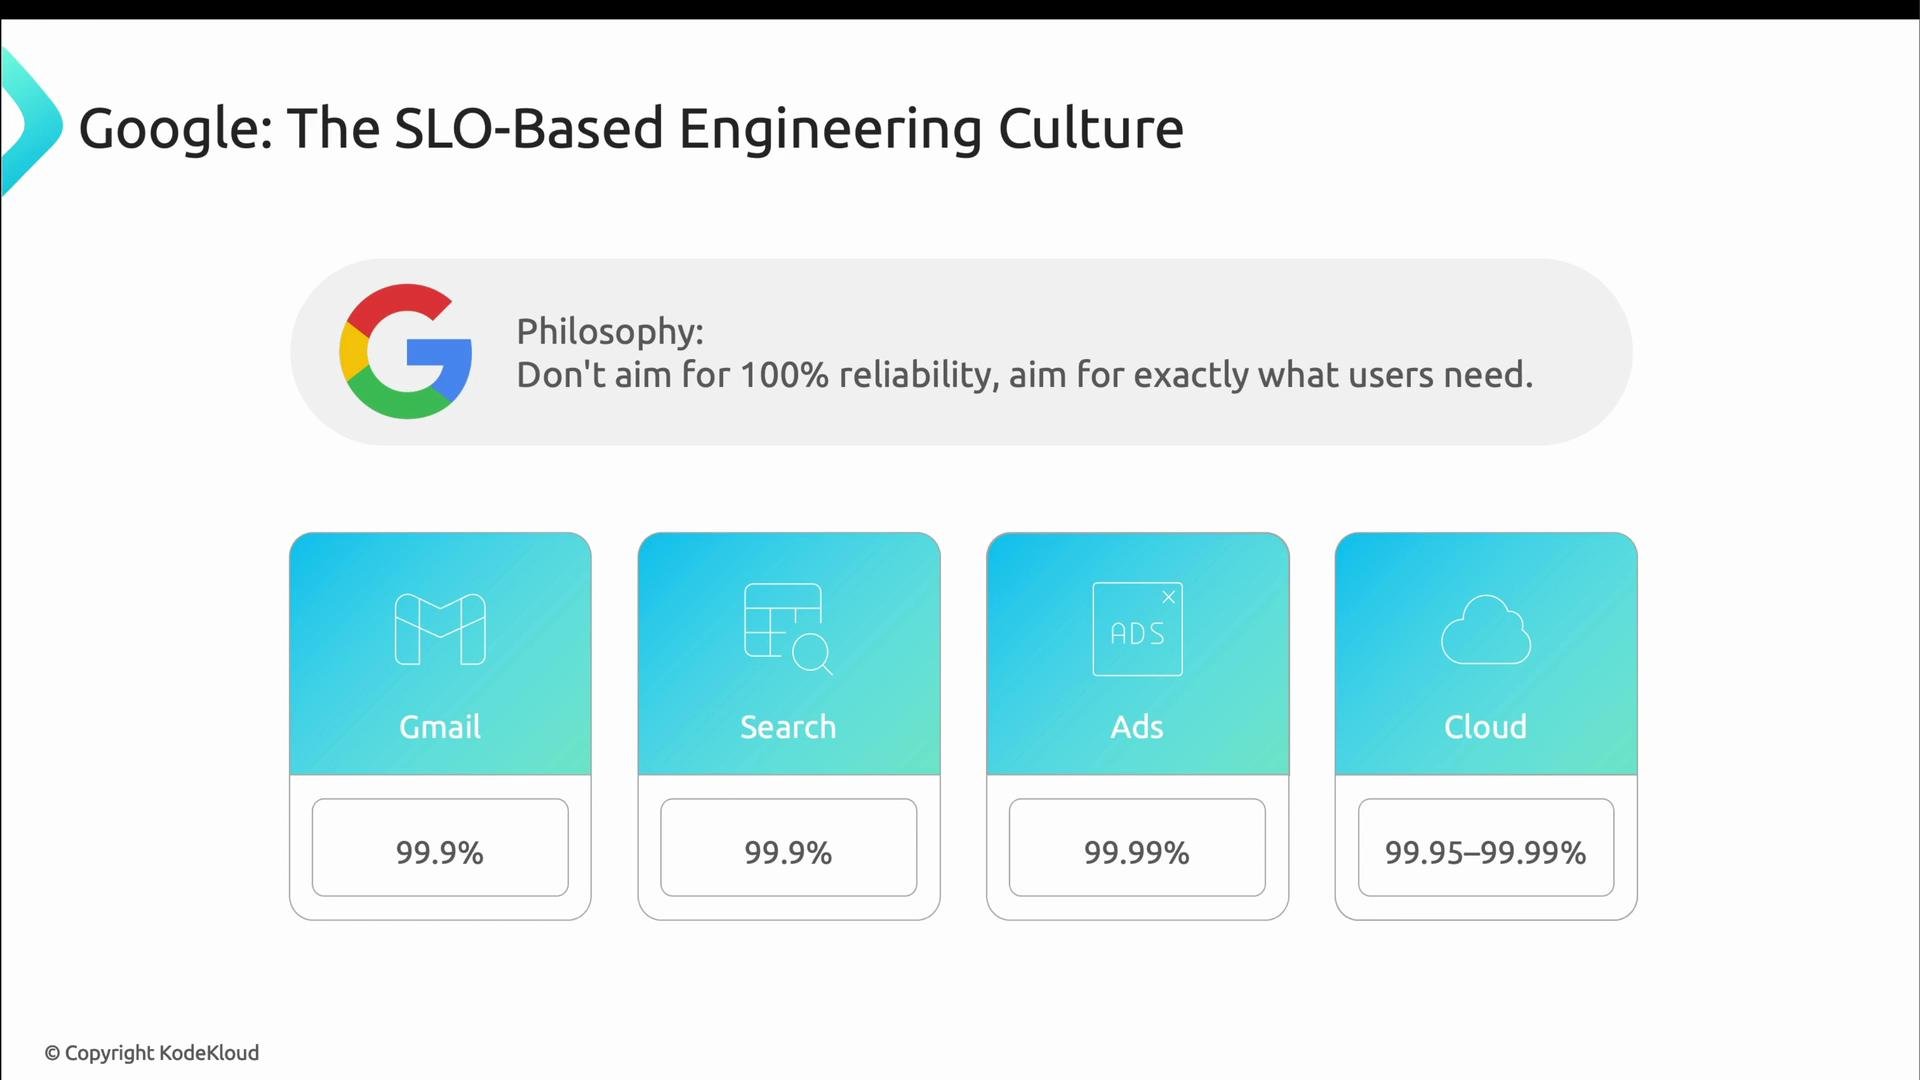
  • Gmail and Search: ~99.9% (users tolerate brief delays)
  • Google Ads: ~99.99% (downtime directly impacts revenue)
  • Google Cloud Services: 99.95%–99.99% depending on SLAs
A presentation slide titled "Google: The SLO-Based Engineering Culture" showing the philosophy "Don't aim for 100% reliability, aim for exactly what users need." Below are four service cards with SLOs: Gmail 99.9%, Search 99.9%, Ads 99.99%, and Cloud 99.95–99.99%.
Summary
  • Reliability cost grows nonlinearly as targets tighten; every extra “9” usually requires materially more investment.
  • Use autoscaling, graceful degradation, and mixed instance strategies to make reliability cost-effective.
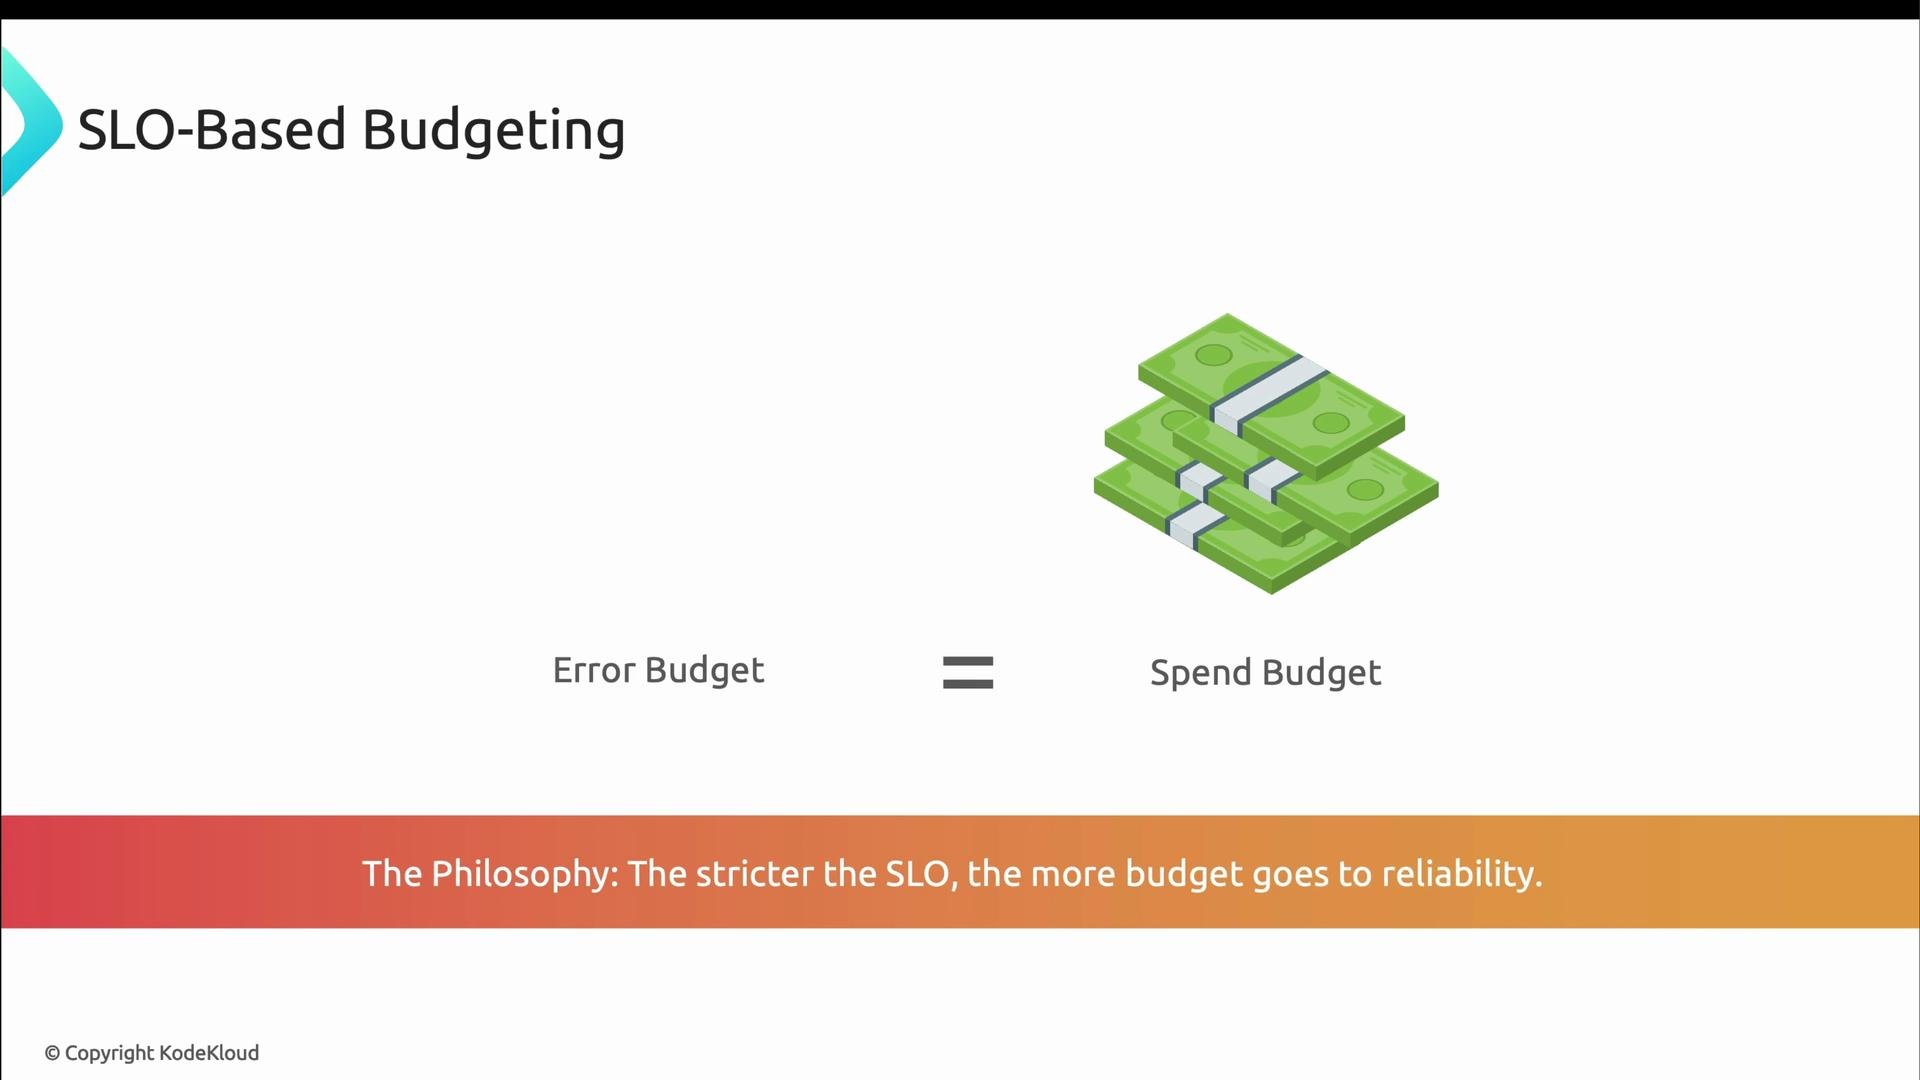
  • Tie budget to SLOs: the error budget should guide when to prioritize reliability work over feature development.
  • Align SLOs to business context and customer tiers so spending matches value delivered.
Further reading and references This article covered advanced reliability engineering topics: the cost of reliability, autoscaling strategies, graceful degradation, instance purchasing strategies, and SLO-based budgeting. These practices may not all apply early in your career, but keeping them on your radar will make you a stronger SRE as you take on larger systems and higher-stakes reliability targets.