Why alerts matter (and how they fail)
Alerts are the front line of reliability: they wake you up at 3 AM and guide day-to-day operations. Poorly designed alerts create noise, cause alert fatigue, and bury real incidents under false alarms. On-call engineers frequently receive many alerts—many of which do not require immediate action—leading to ignored or dismissed notifications and missed critical incidents.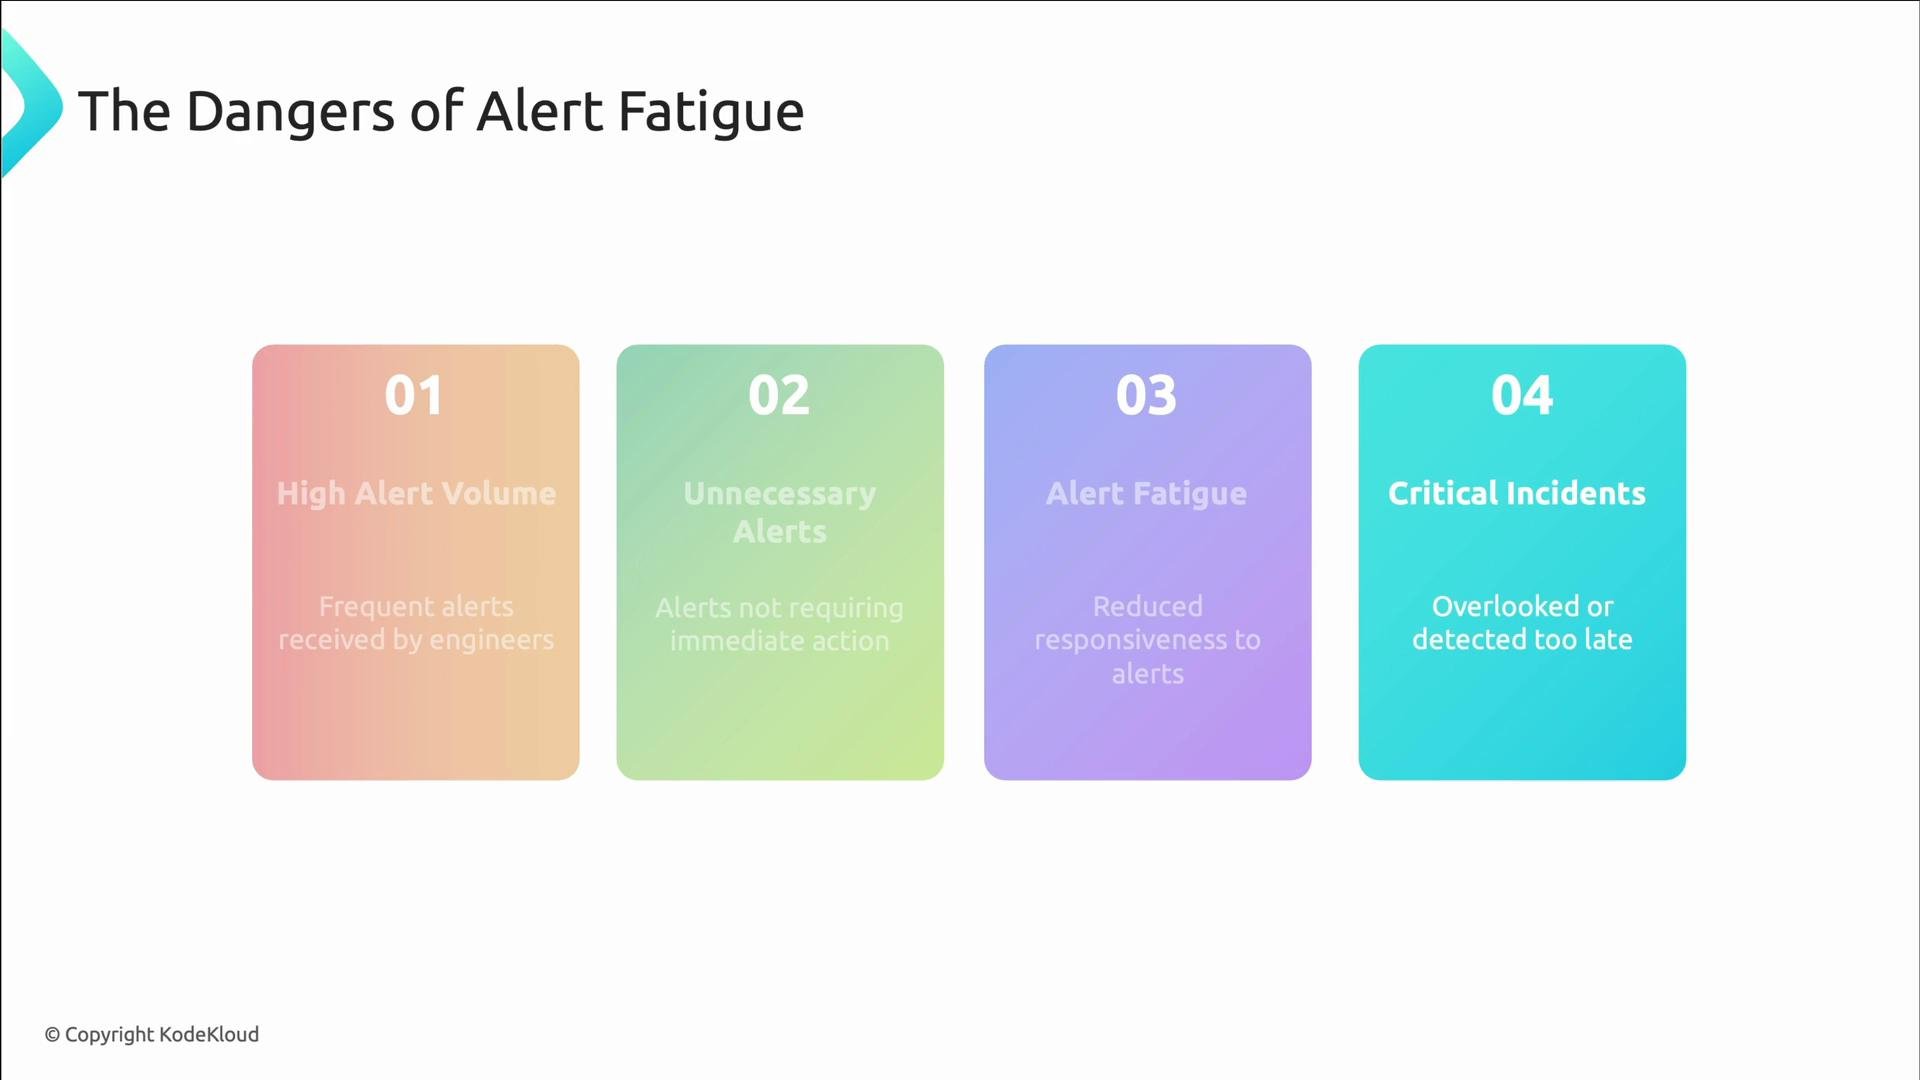
Alert fatigue is real: prioritize signals that require immediate human action and reduce noisy, low-value alerts. Otherwise, responders may miss critical incidents.
Design principles for effective alerting
Not every metric or event should generate an alert. Before converting a signal into an alert, ensure it answers these four questions:- Is it actionable now? If not, keep it as a metric or dashboard.
- Does it require human intervention? If not, automate remediation.
- Does it affect users or revenue? If not, avoid waking someone.
- Can the on-call person fix it? If not, route it to the appropriate team.
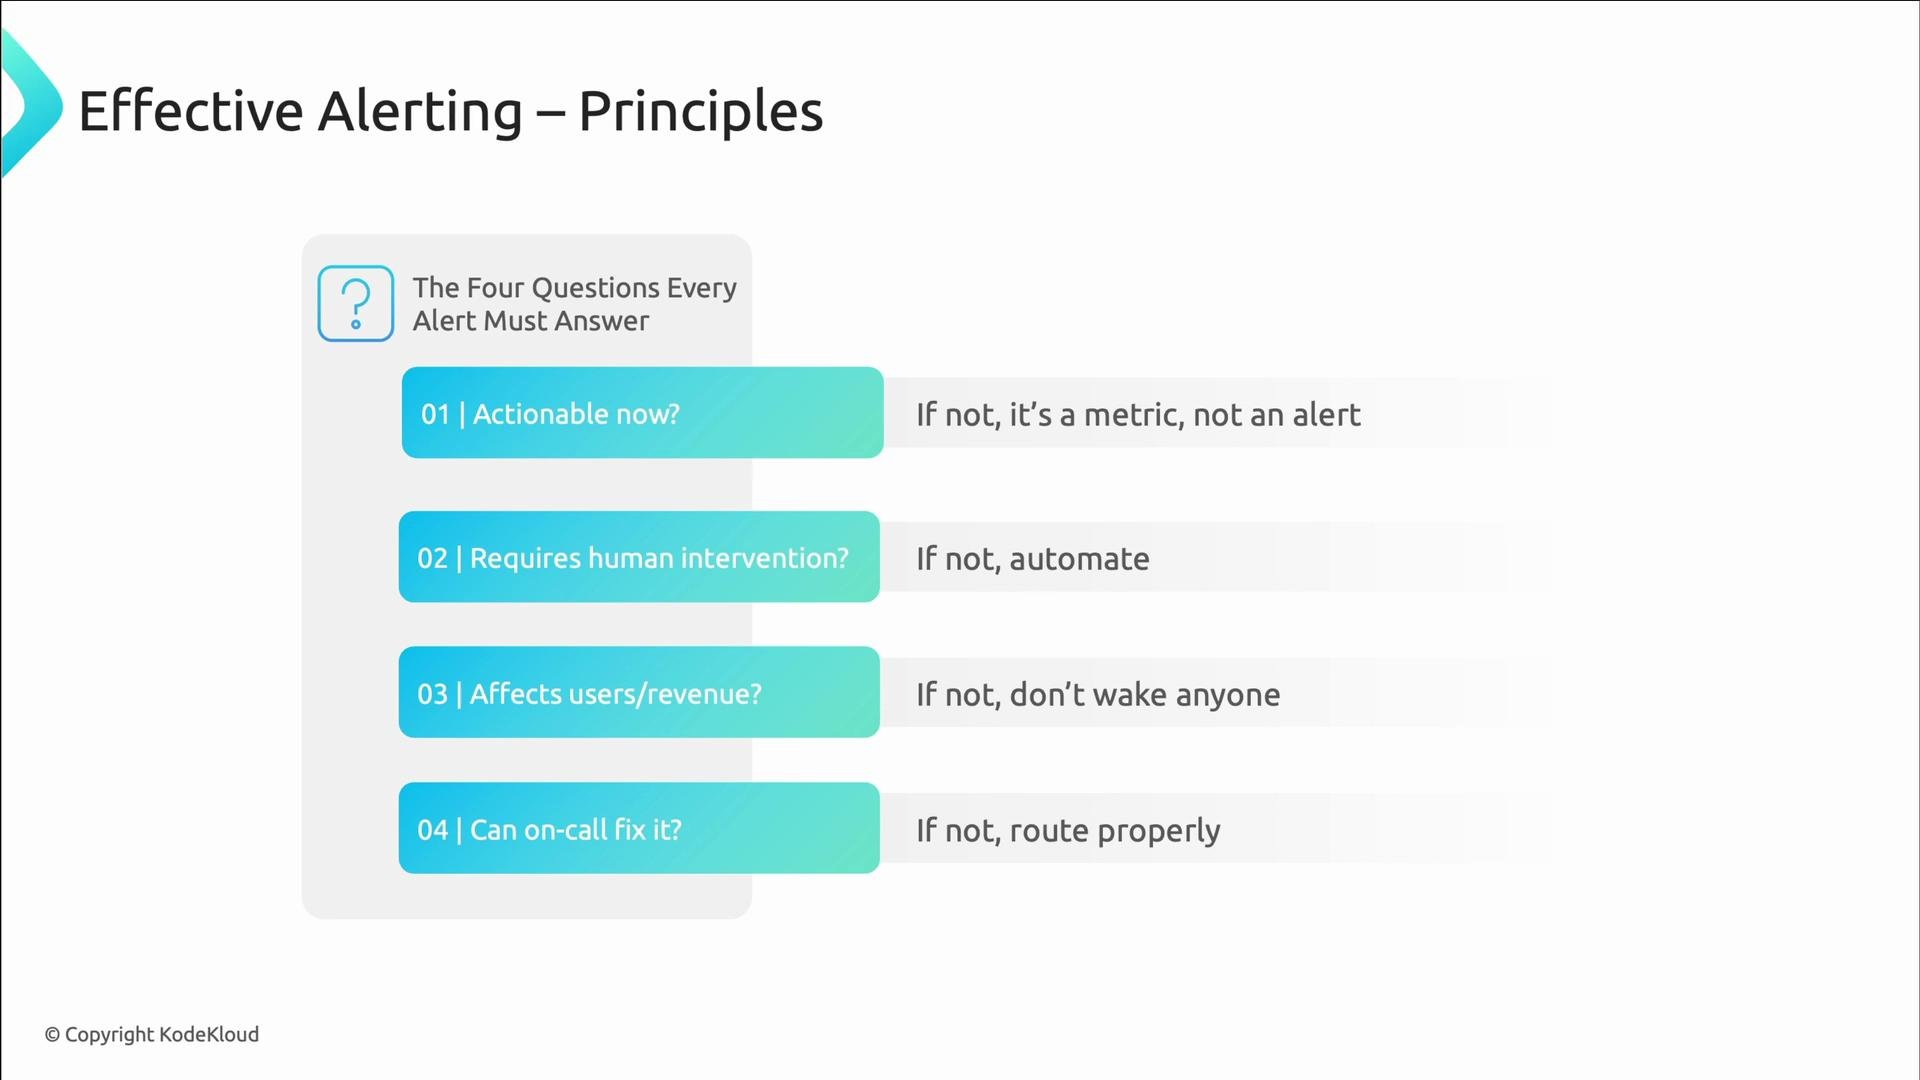
Only alert on signals that require immediate human attention and which the recipient can reasonably act on. Use metrics, automation, or routing for everything else.
Make alerts actionable: scope, context, and runbooks
Low-value alerts often trigger during normal operation and lack context. Provide:- A clear service scope (which service or component)
- A user-facing signal (errors, latency, availability)
- Severity and owning team labels
- Links to runbooks and dashboards
- Scopes to a specific service.
- Uses a user-facing metric (error rate).
- Provides severity, team ownership, and remediation resources so responders can act quickly.
SLO-based alerting: focus on user experience
SLO-based alerting shifts focus from infrastructure thresholds (CPU, disk) to user experience and business impact. Alerts driven by SLOs and error budgets better reflect when users are affected and when engineering must intervene.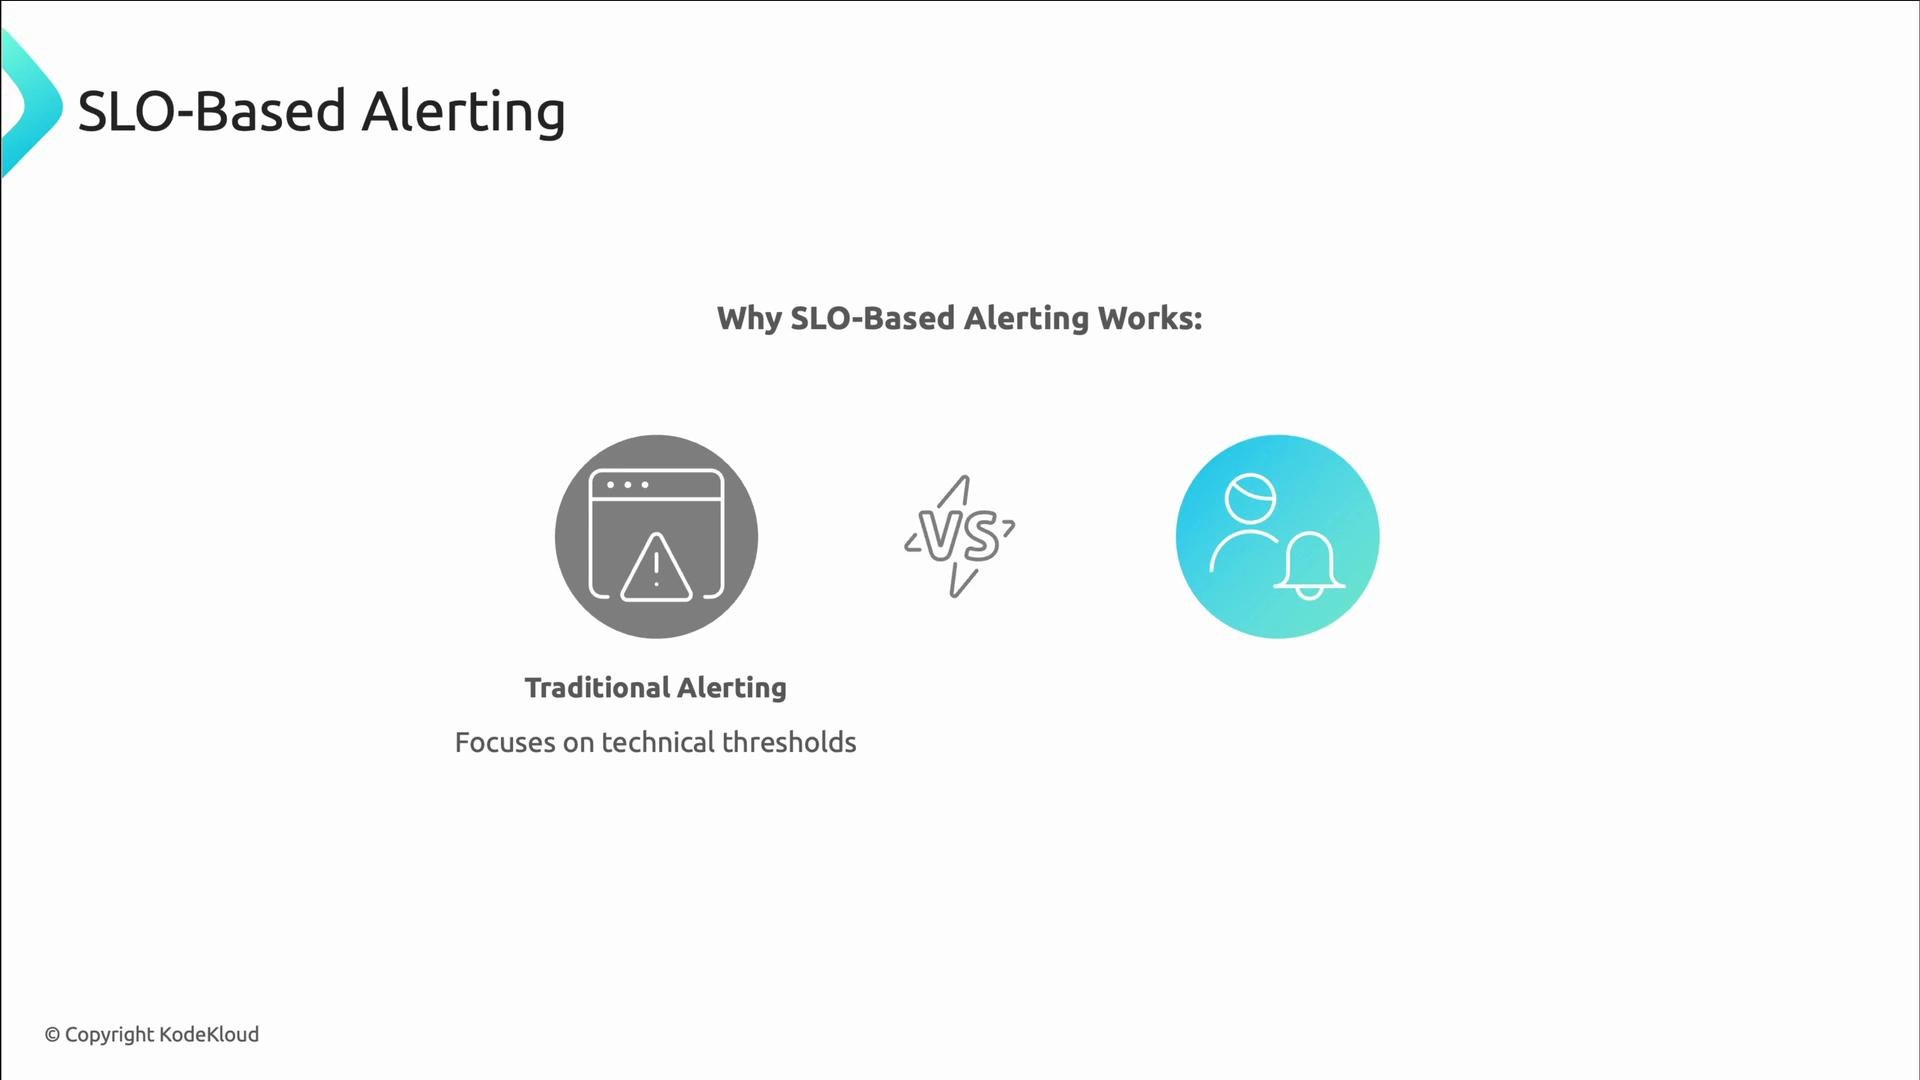
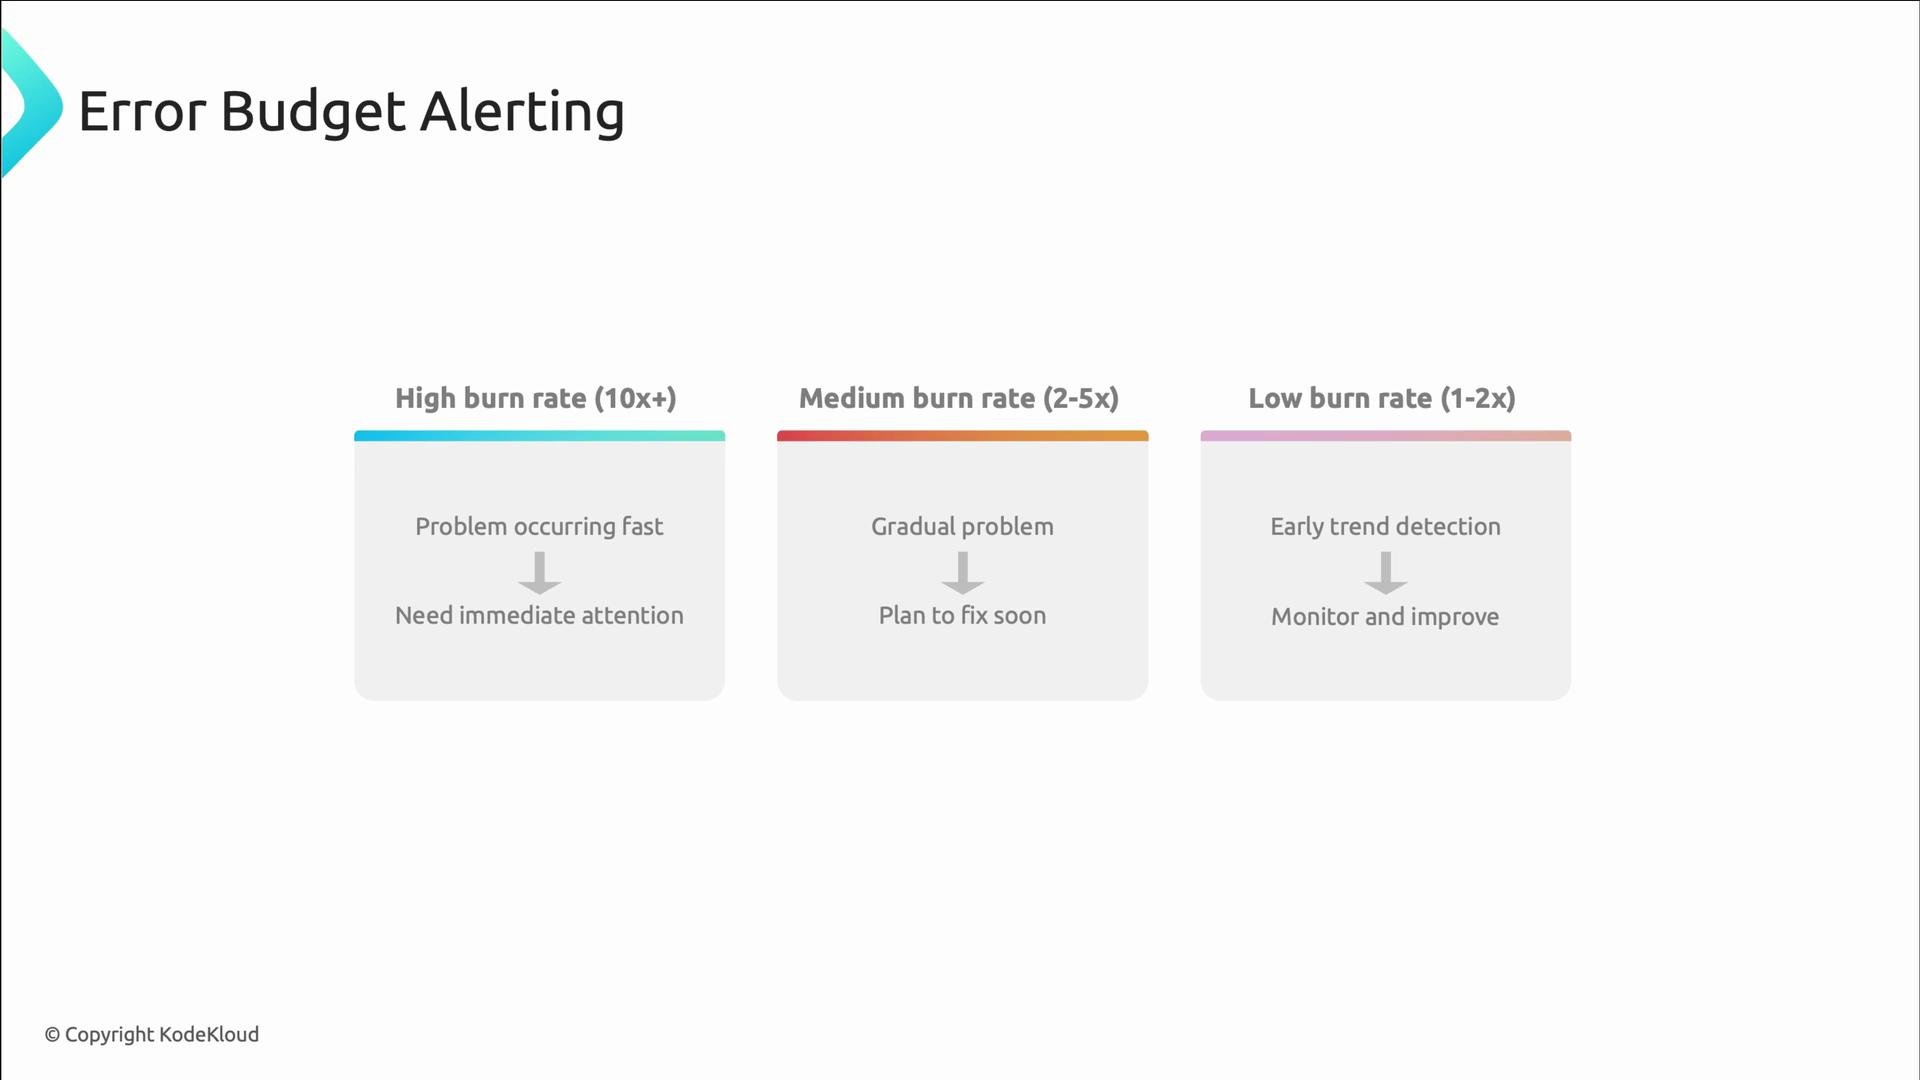
Error-budget and burn-rate alerting
Error-budget alerting uses a burn rate: how quickly you are consuming your allowable errors versus the expected pace. Burn-rate alerts provide urgency levels tied to SLOs.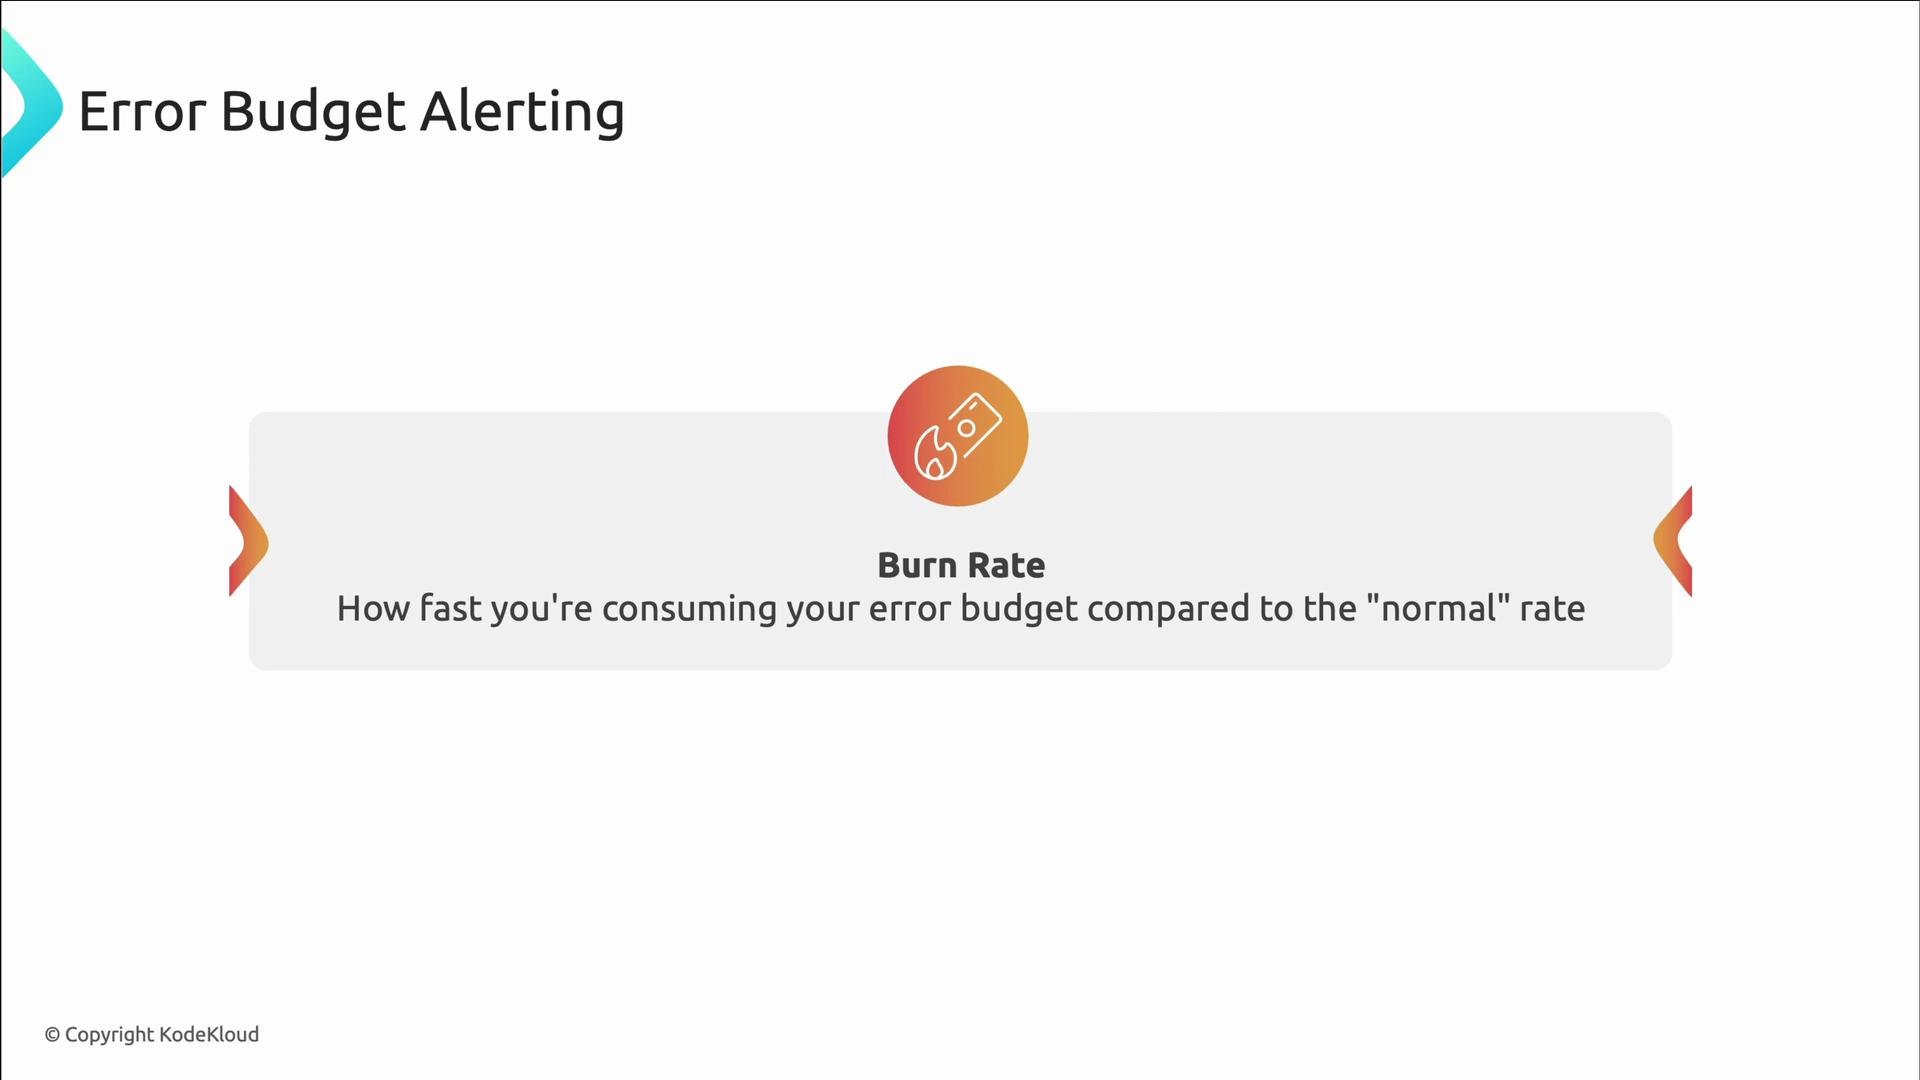
Alert routing: get alerts to the right people
Good alerting includes routing so the correct team receives the right severity at the right time. Use routing tools such as Alertmanager or PagerDuty to:- Group similar alerts to reduce notification volume
- Route by service, severity, and time of day
- Send low-severity signals to chat channels for visibility (no paging)
Where alerts live in the KodeKloud RecordStore repo
In the KodeKloud RecordStore example, Alertmanager configuration controls routing/receivers and AlertRules.yaml defines the alerts. Here’s a compact Alertmanager snippet you might find in the repository:Best practices checklist
- Alert on user-facing signals (errors, latency, availability), not raw capacity metrics, unless they directly affect users.
- Use SLOs and error budgets to prioritize and quantify urgency.
- Provide context: service, severity, team, runbook, and dashboard URLs.
- Group and route alerts to the correct receiver; use time-based routing to avoid waking unnecessary people.
- Automate remediation for common, low-risk failures.
- Measure alert volume and triage time; iterate to reduce noise.