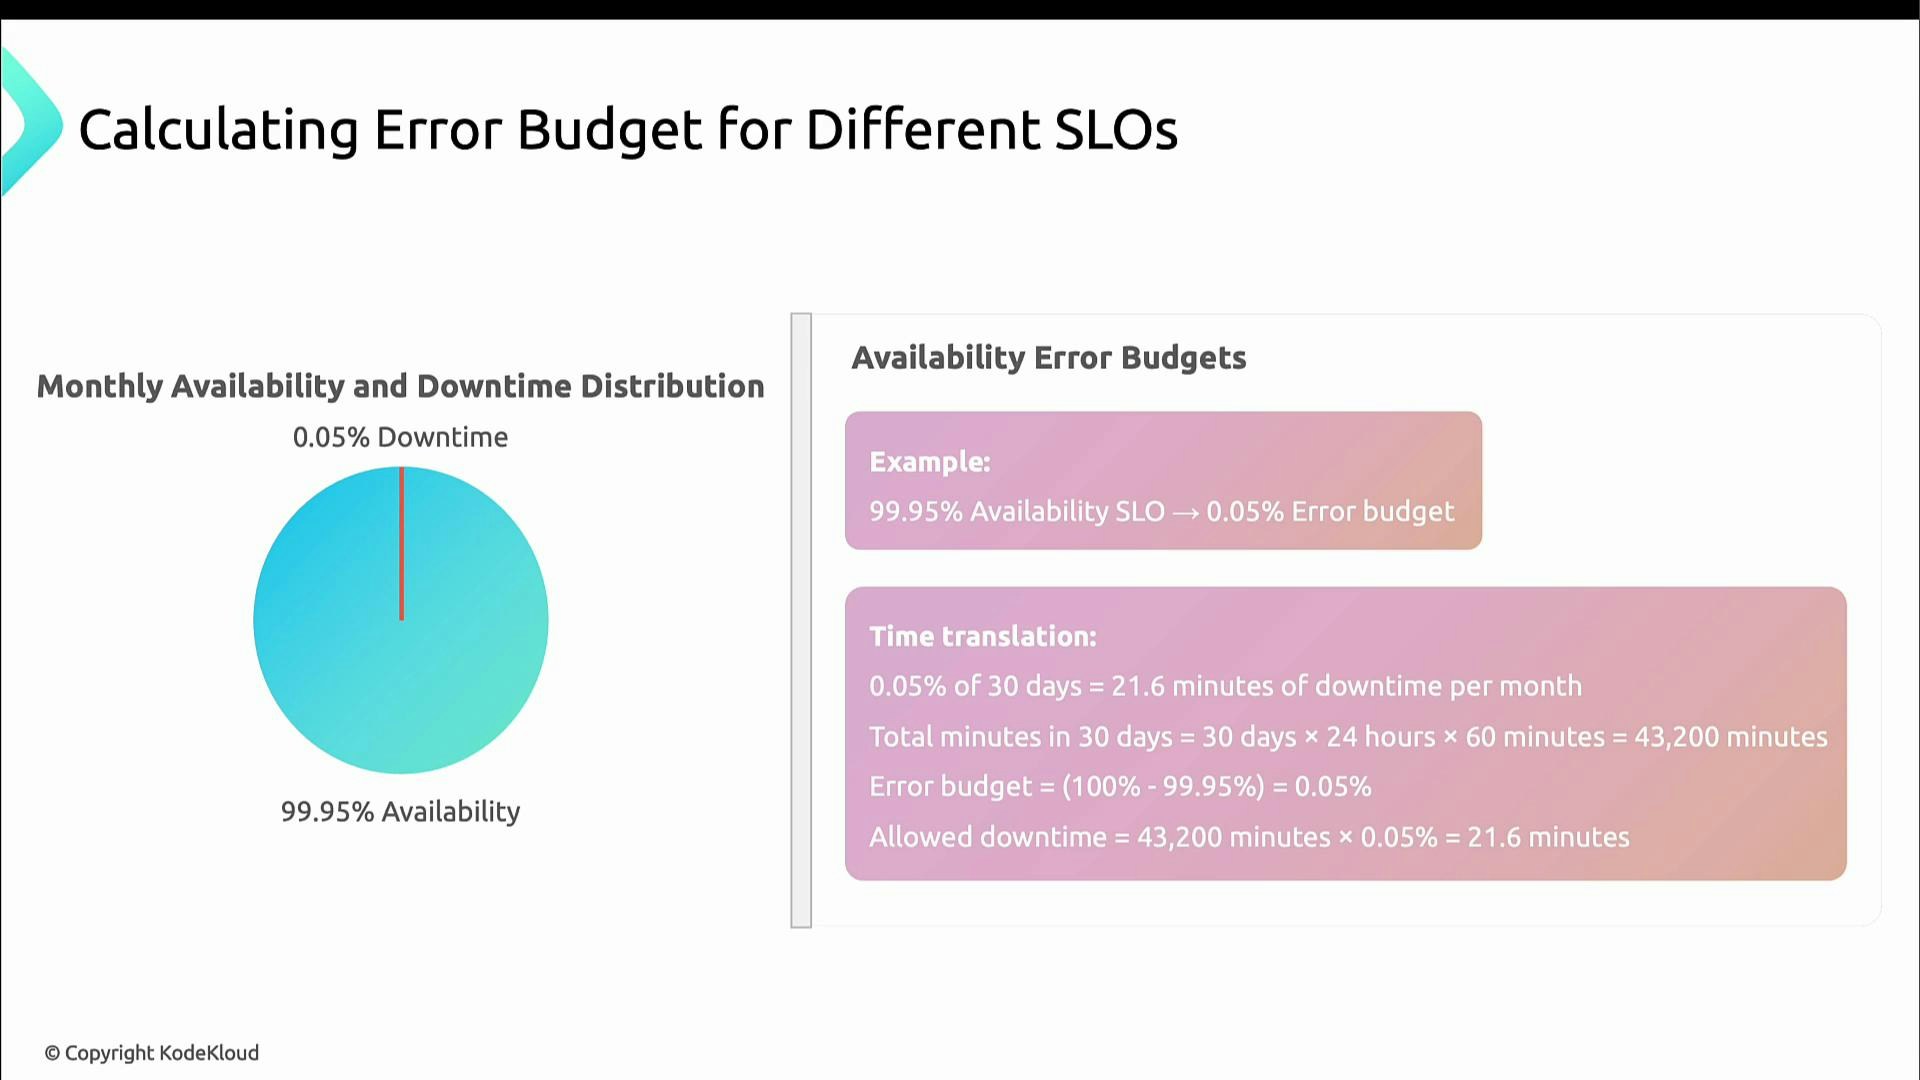
Basic math: availability SLO → error budget
If your SLO is 99.9% uptime, the error budget is the remaining 0.1%. That 0.1% becomes a fixed amount of time (or requests) you may allow to degrade without violating the SLO. Example: 99.95% availability → 0.05% downtime.- For a 30-day month (30 × 24 × 60 = 43,200 minutes):
- 0.05% of 43,200 = 21.6 minutes of allowable downtime per month.
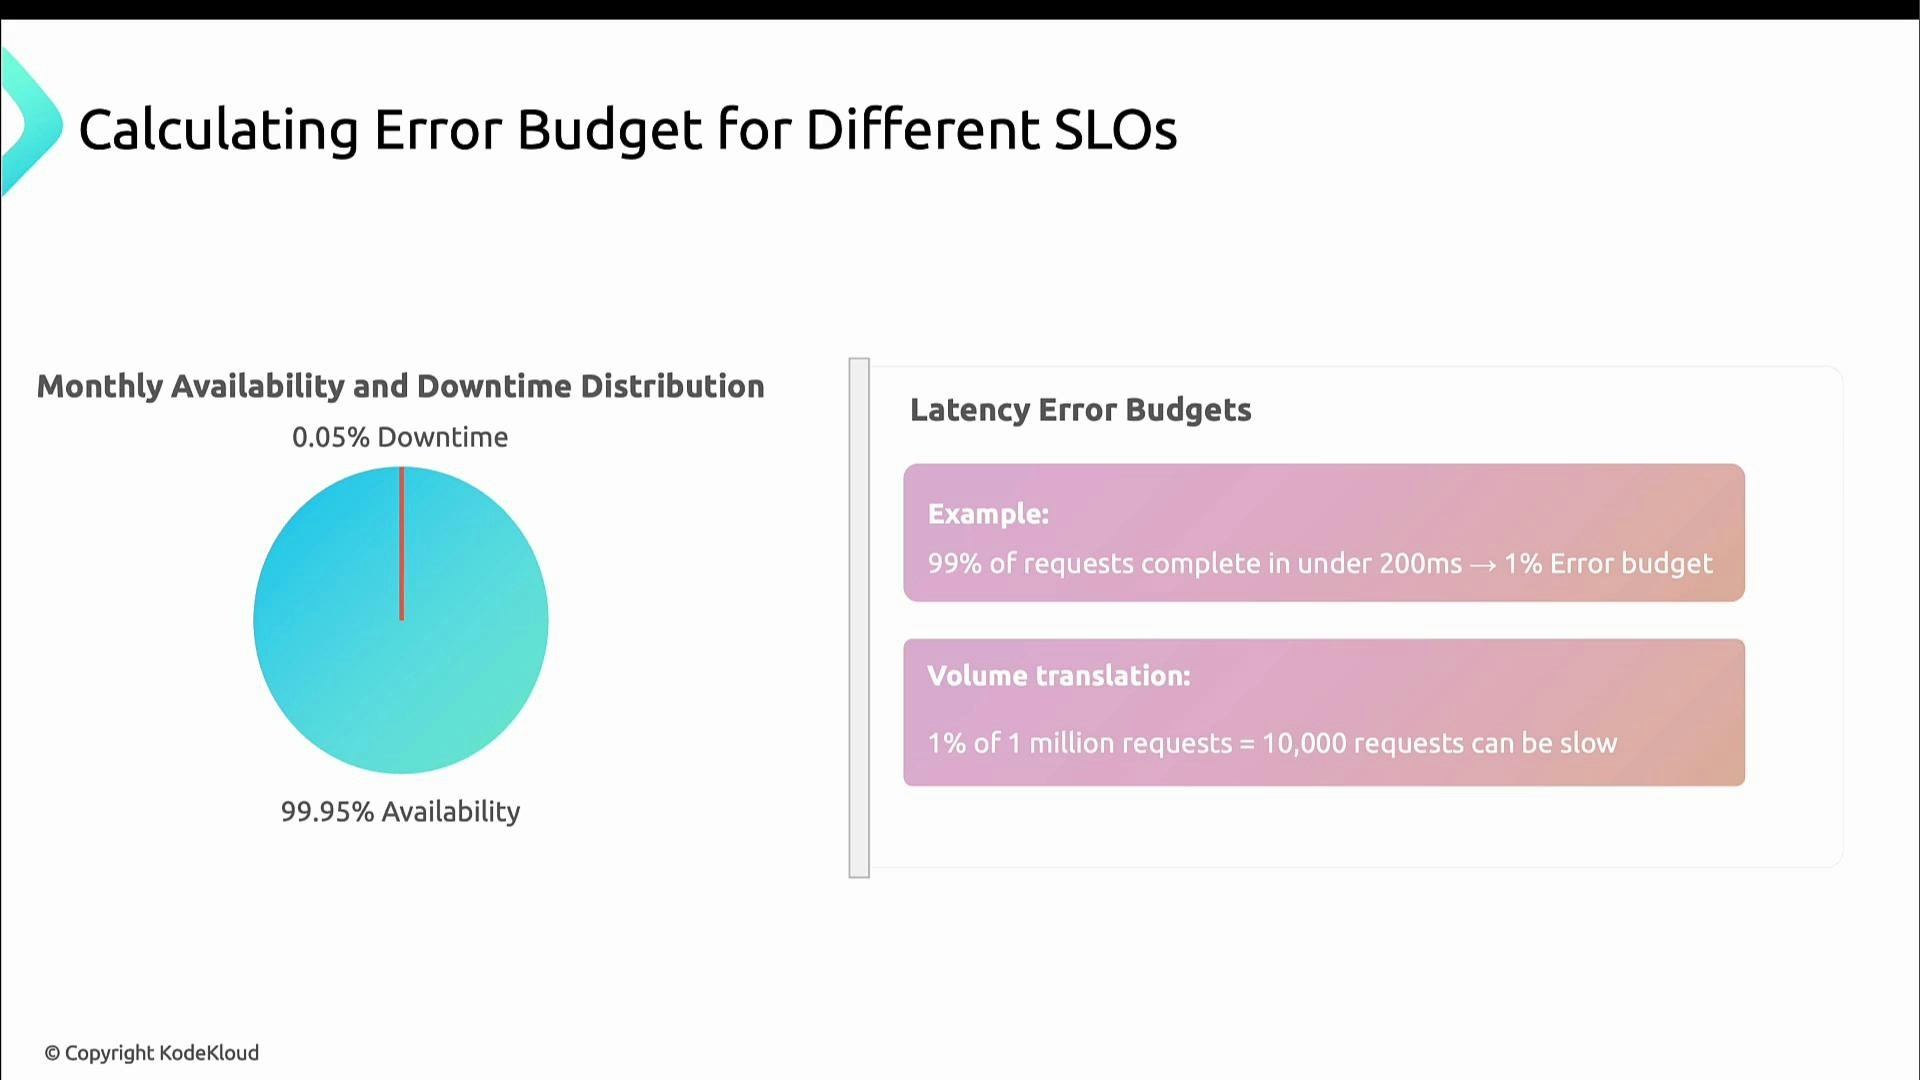
Latency SLOs: same idea, applied to requests
For latency-based SLOs you apply the same math to request counts instead of elapsed time. Example: SLO = “99% of requests complete under 200 ms” → error budget = 1% of requests.- If you receive 1,000,000 requests in a month, 1% = 10,000 requests may exceed 200 ms before the SLO is missed.
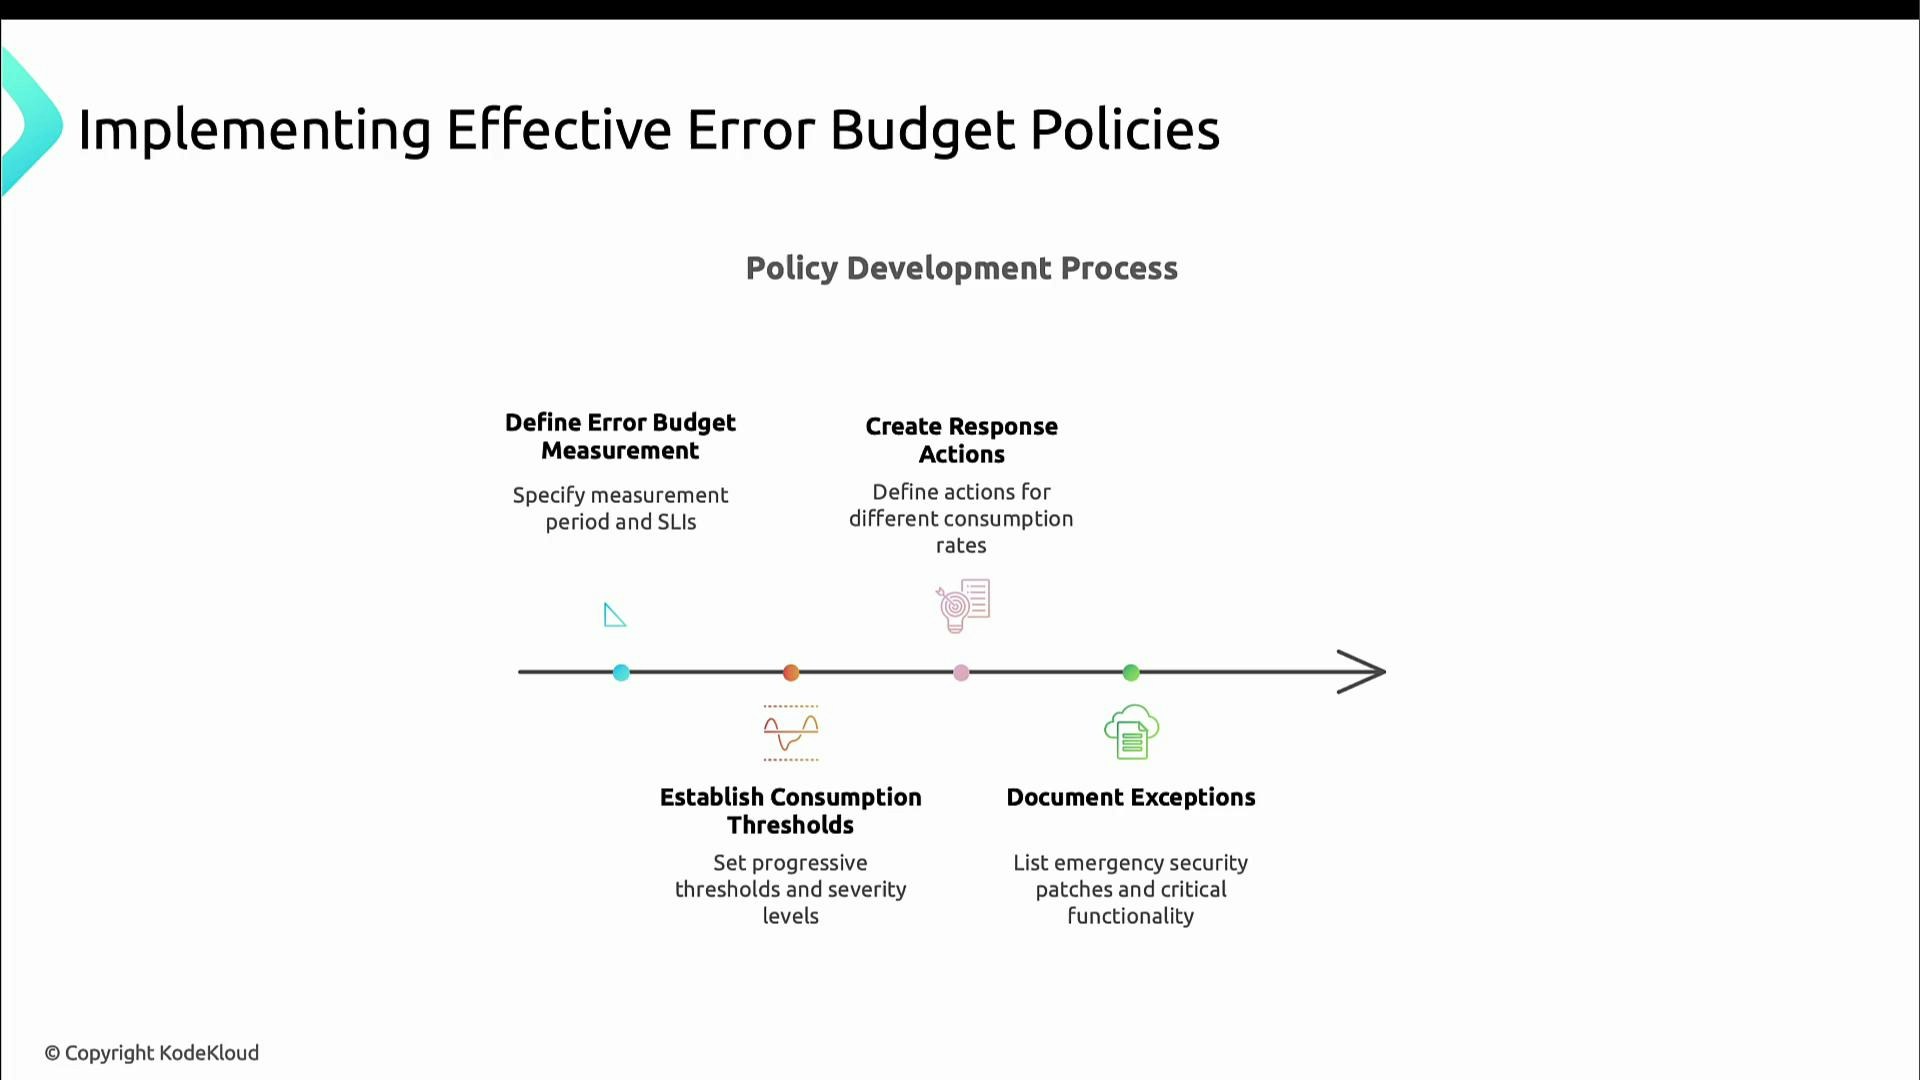
How to use error budgets in practice
Make budgets actionable by defining cadence, ownership, thresholds, and pre-agreed responses. Start with simple rules and iterate.- Choose a measurement cadence (daily, weekly, monthly).
- Define consumption thresholds (for example: 50%, 75%, 100%) and the corresponding responses.
- Specify concrete actions for each threshold (slow releases, add safeguards, freeze changes).
- Document exceptions (e.g., emergency security patches) and a process for approvals.
- Periodically review and adjust SLOs, measurement windows, and policies.
Define who measures the budget, how often the measurement runs, and which teams are notified at each threshold — these operational details make the budget actionable.
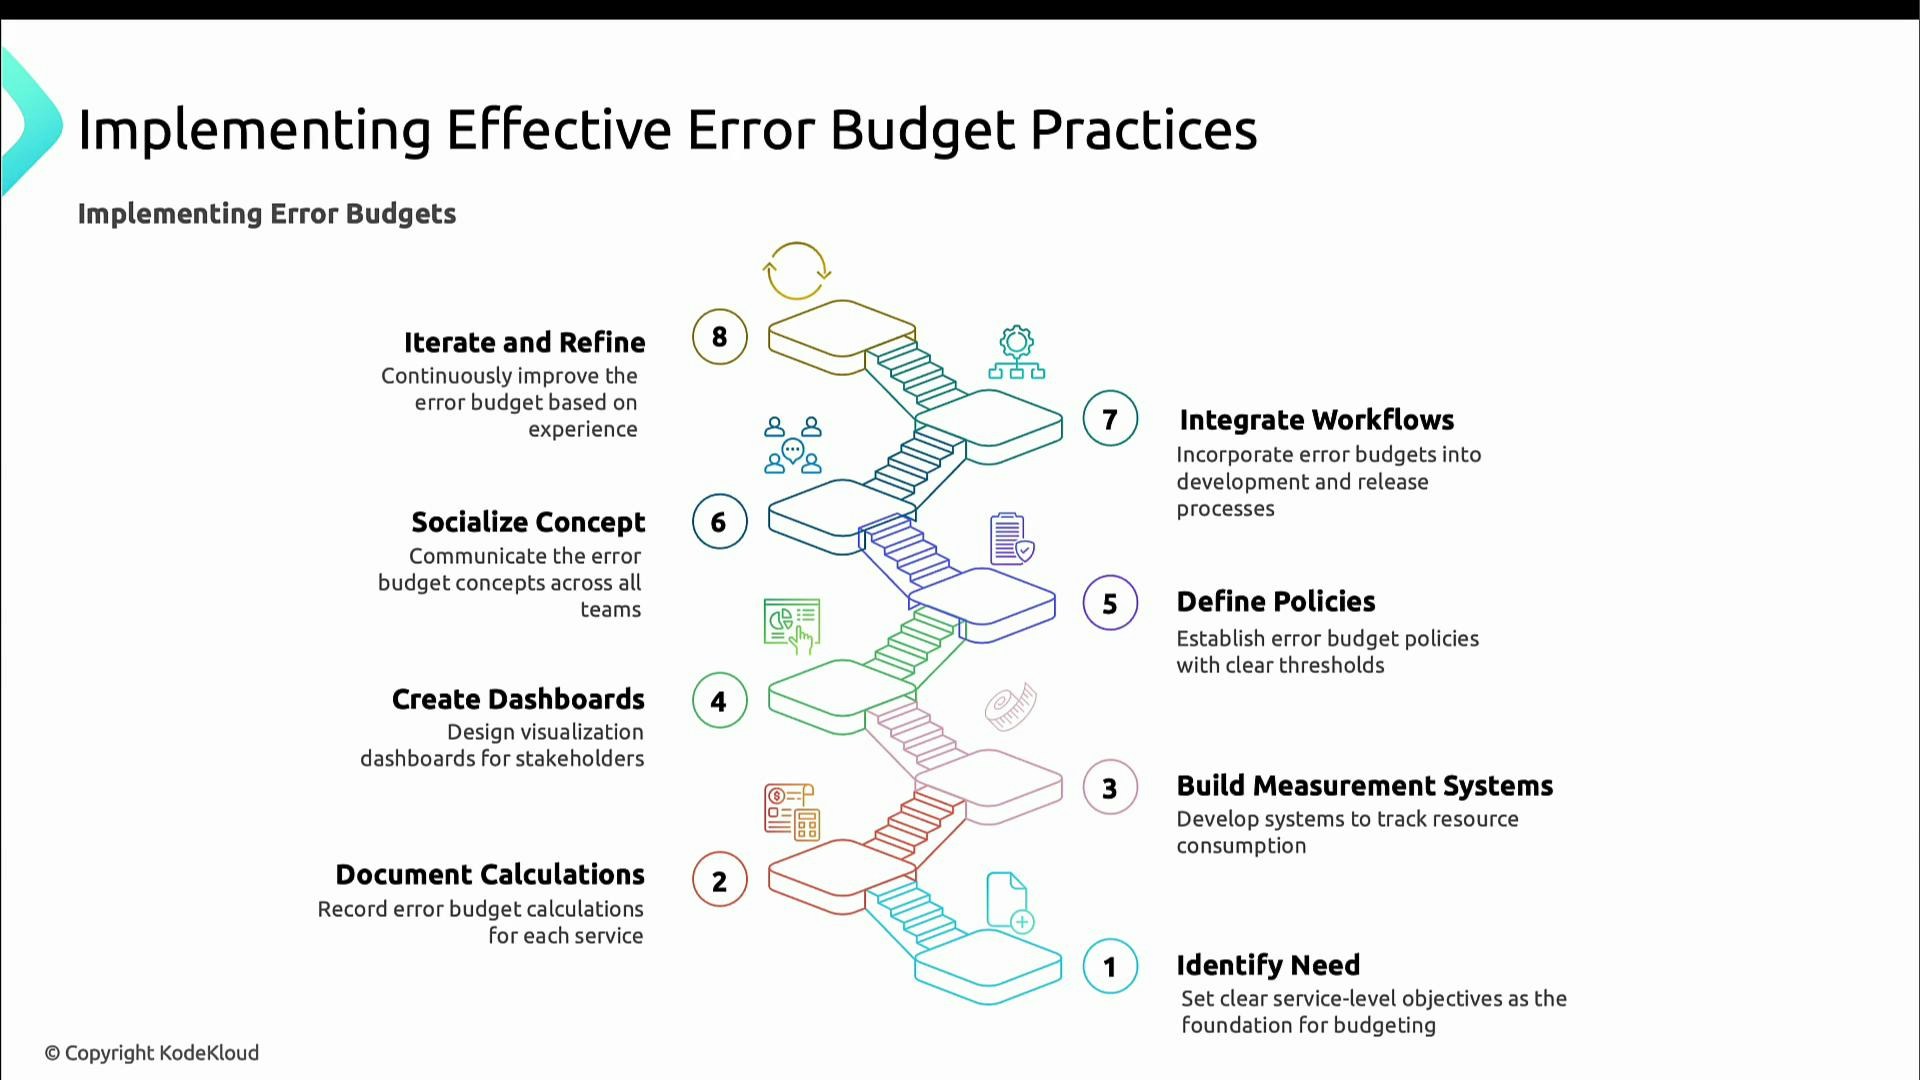
Implementation checklist: make error budgets repeatable
Follow these core steps to operationalize error budgets so they become part of your day-to-day decision-making:- Define clear SLOs for each critical service.
- Document the calculation for each error budget so the math is auditable.
- Build measurement systems to track SLI, SLO, and error-budget consumption in (near) real time.
- Create dashboards so stakeholders can see trends and current consumption.
- Define concrete policies and actions for threshold breaches.
- Socialize the concept and train teams so everyone understands trade-offs.
- Integrate error-budget checks into release and deployment workflows (automate gating where possible).
- Iterate and refine policies based on observed behavior.
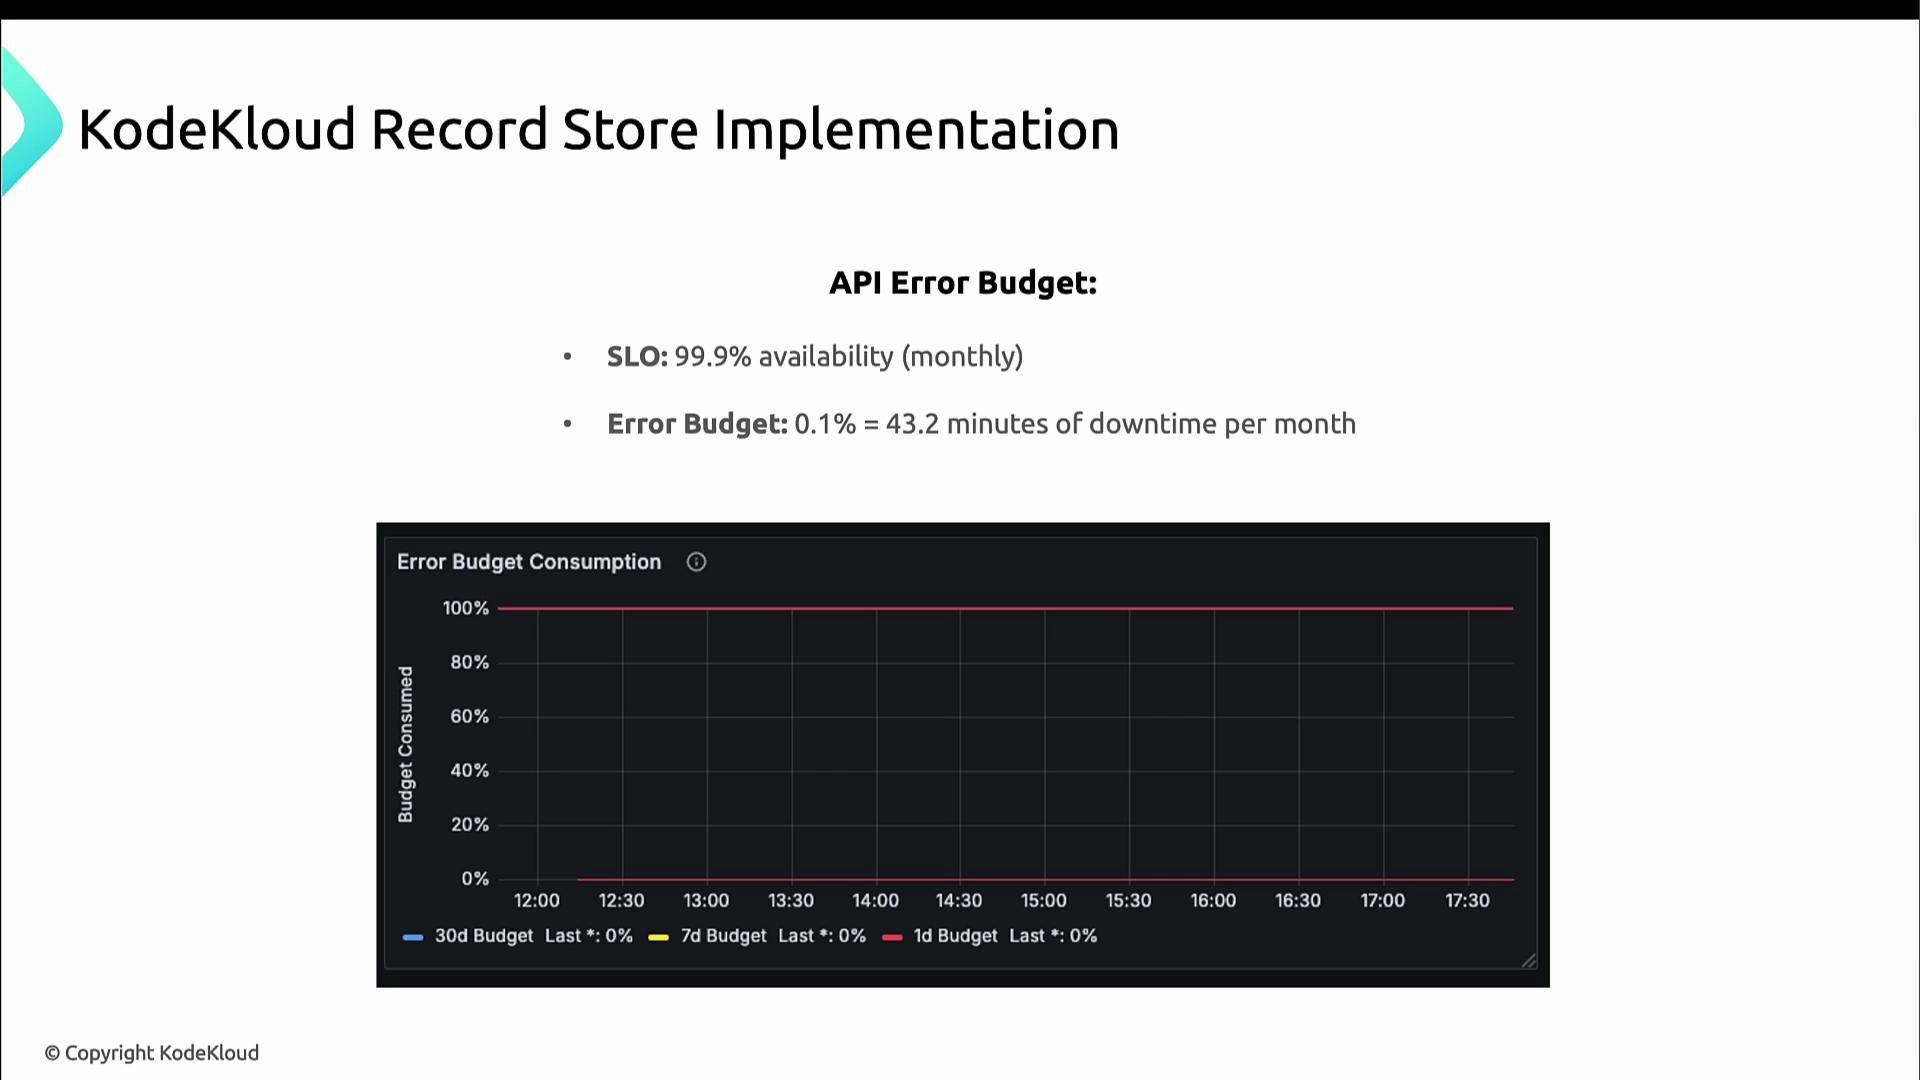
Practical example: KodeKloud Record Store
Suppose the KodeKloud Record Store API has an availability SLO of 99.9%. The monthly error budget is 0.1%:- 0.1% of 43,200 minutes = 43.2 minutes of allowable downtime per month.
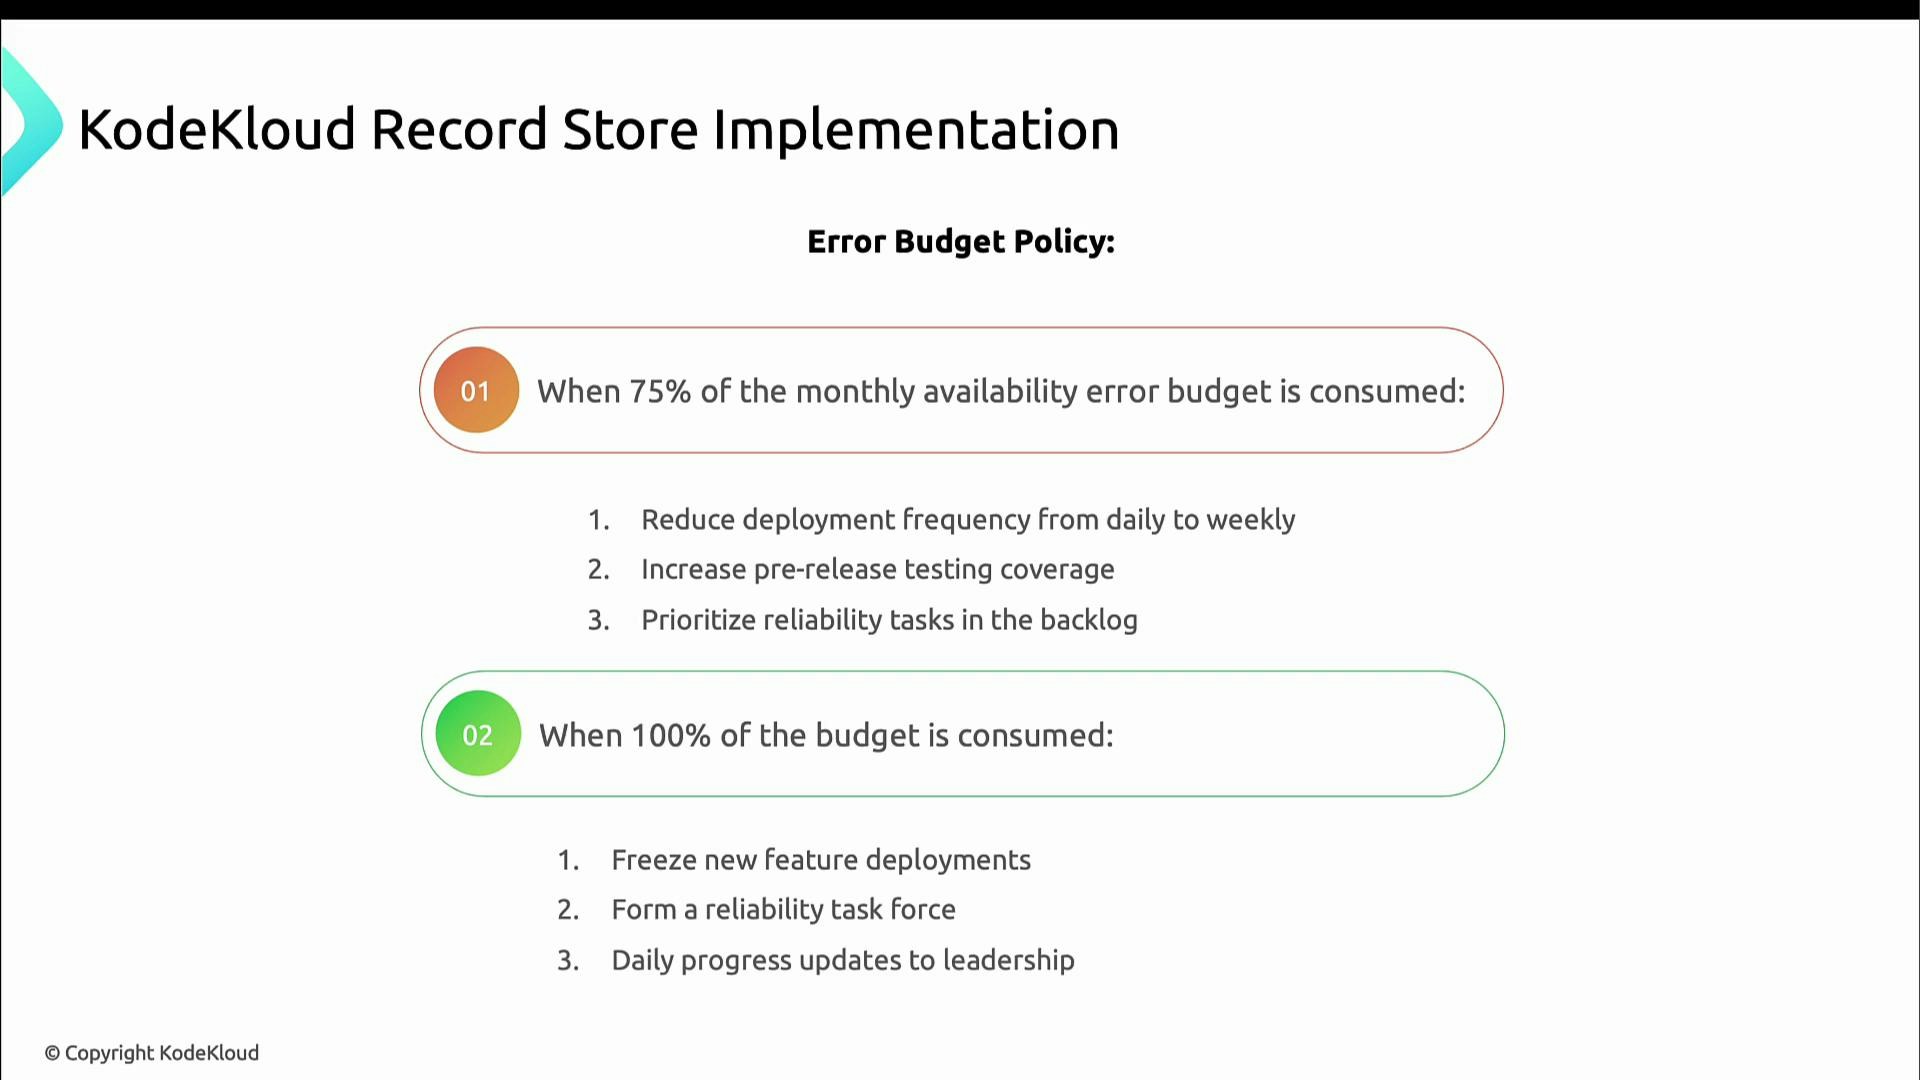
- At 75% consumed: slow down releases, increase pre-release testing, and prioritize reliability work.
- At 100% consumed: freeze new feature deployments, form a reliability task force, and report daily to leadership until stability is restored.
Measuring consumption (example: order processing)
If the order-processing flow has a 99.9% success SLO, the error budget is 0.1%—either ~43.2 minutes/month when measured by time, or 0.1% of requests when measured by request success. A Prometheus-style query that computes percent of error budget consumed over a 30d window:- Compute success rate: successful 2xx responses divided by total requests for /orders.
- Convert to error rate: 1 − success_rate.
- Normalize by the error budget (0.001 = 0.1%) to get percent of budget consumed.
- Multiply by 100 to express as percent and clamp to 100.
- At 50%: investigate database or queue performance, enhance instrumentation, notify engineering leadership.
- At 75%: restrict deployments that affect order processing, add manual verification steps, increase worker capacity.
- At 100%: freeze all changes, invoke incident response, and require executive approval to resume normal operations.
Thresholds and recommended actions
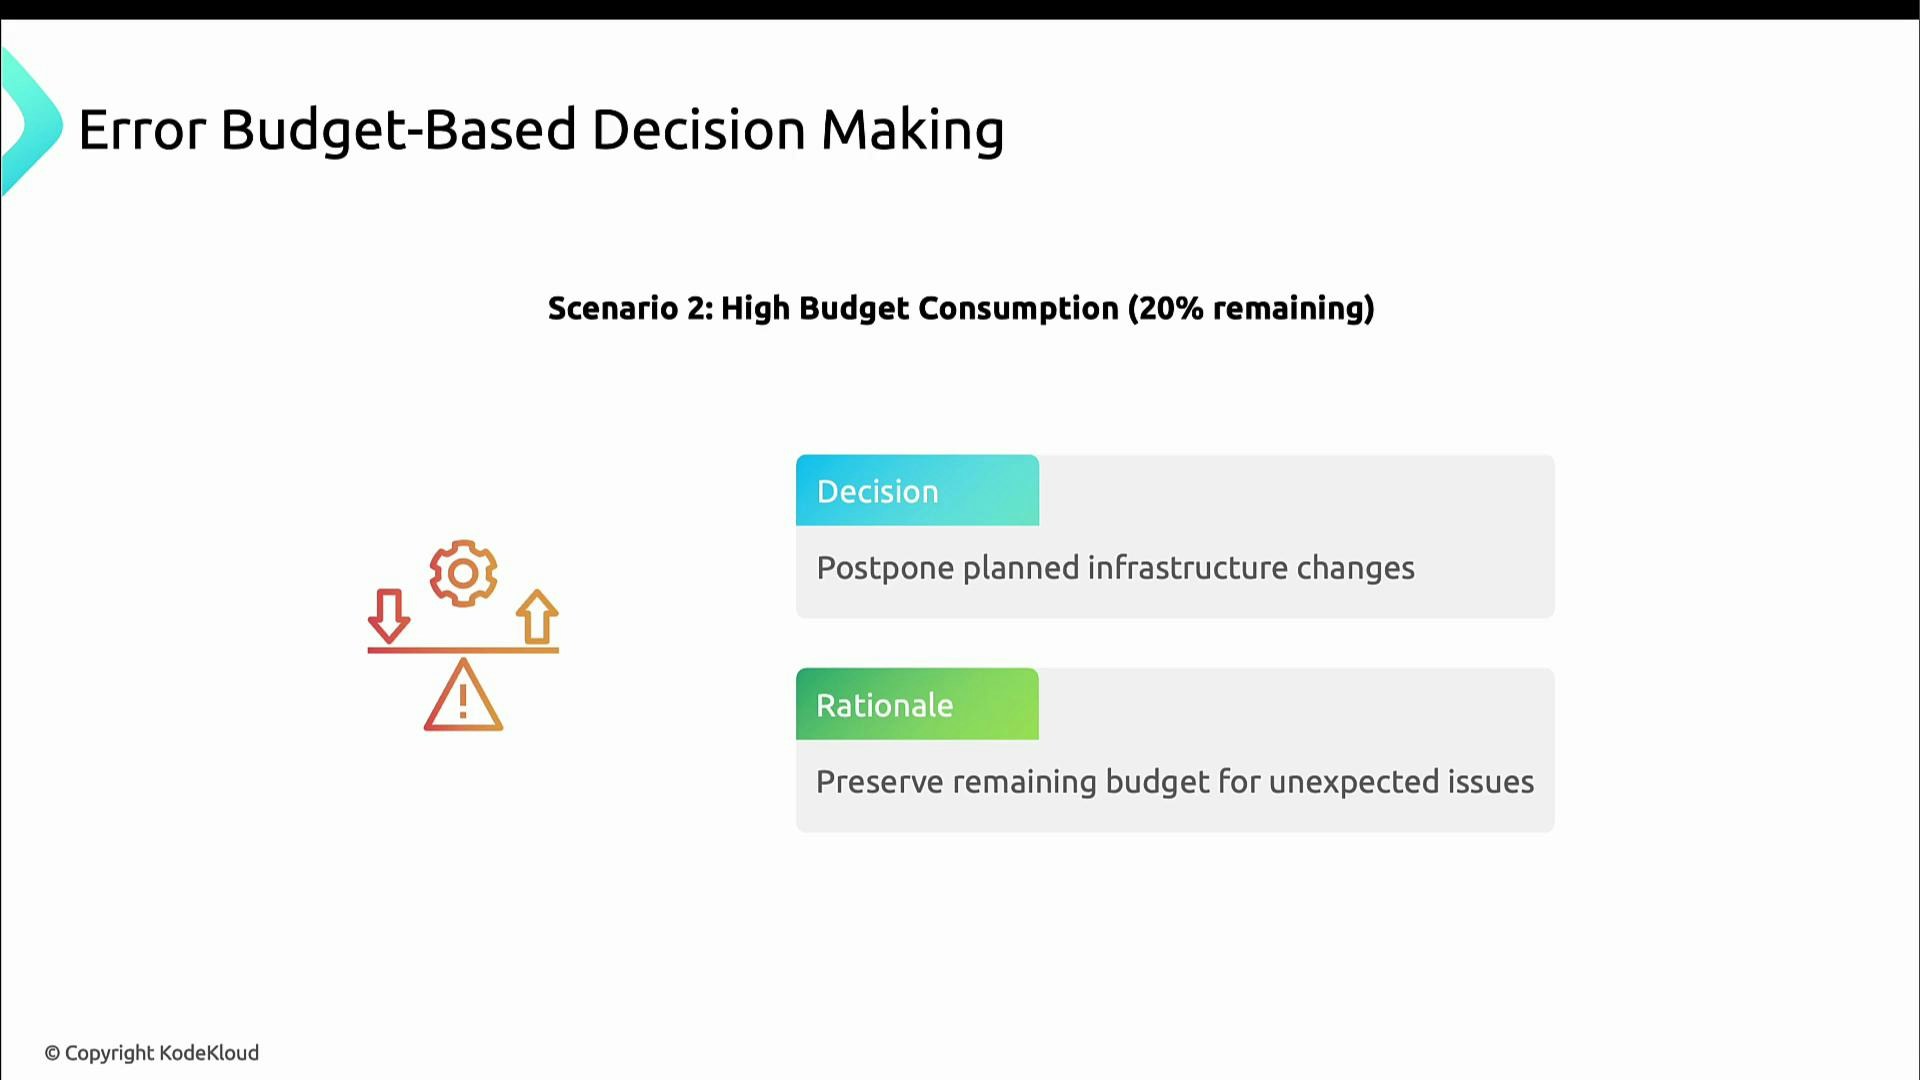
Decision-making scenarios
Scenario 1 — Low consumption (e.g., 20% used; 80% remaining): headroom exists. Accelerate feature delivery and take measured risks since the budget can absorb regressions.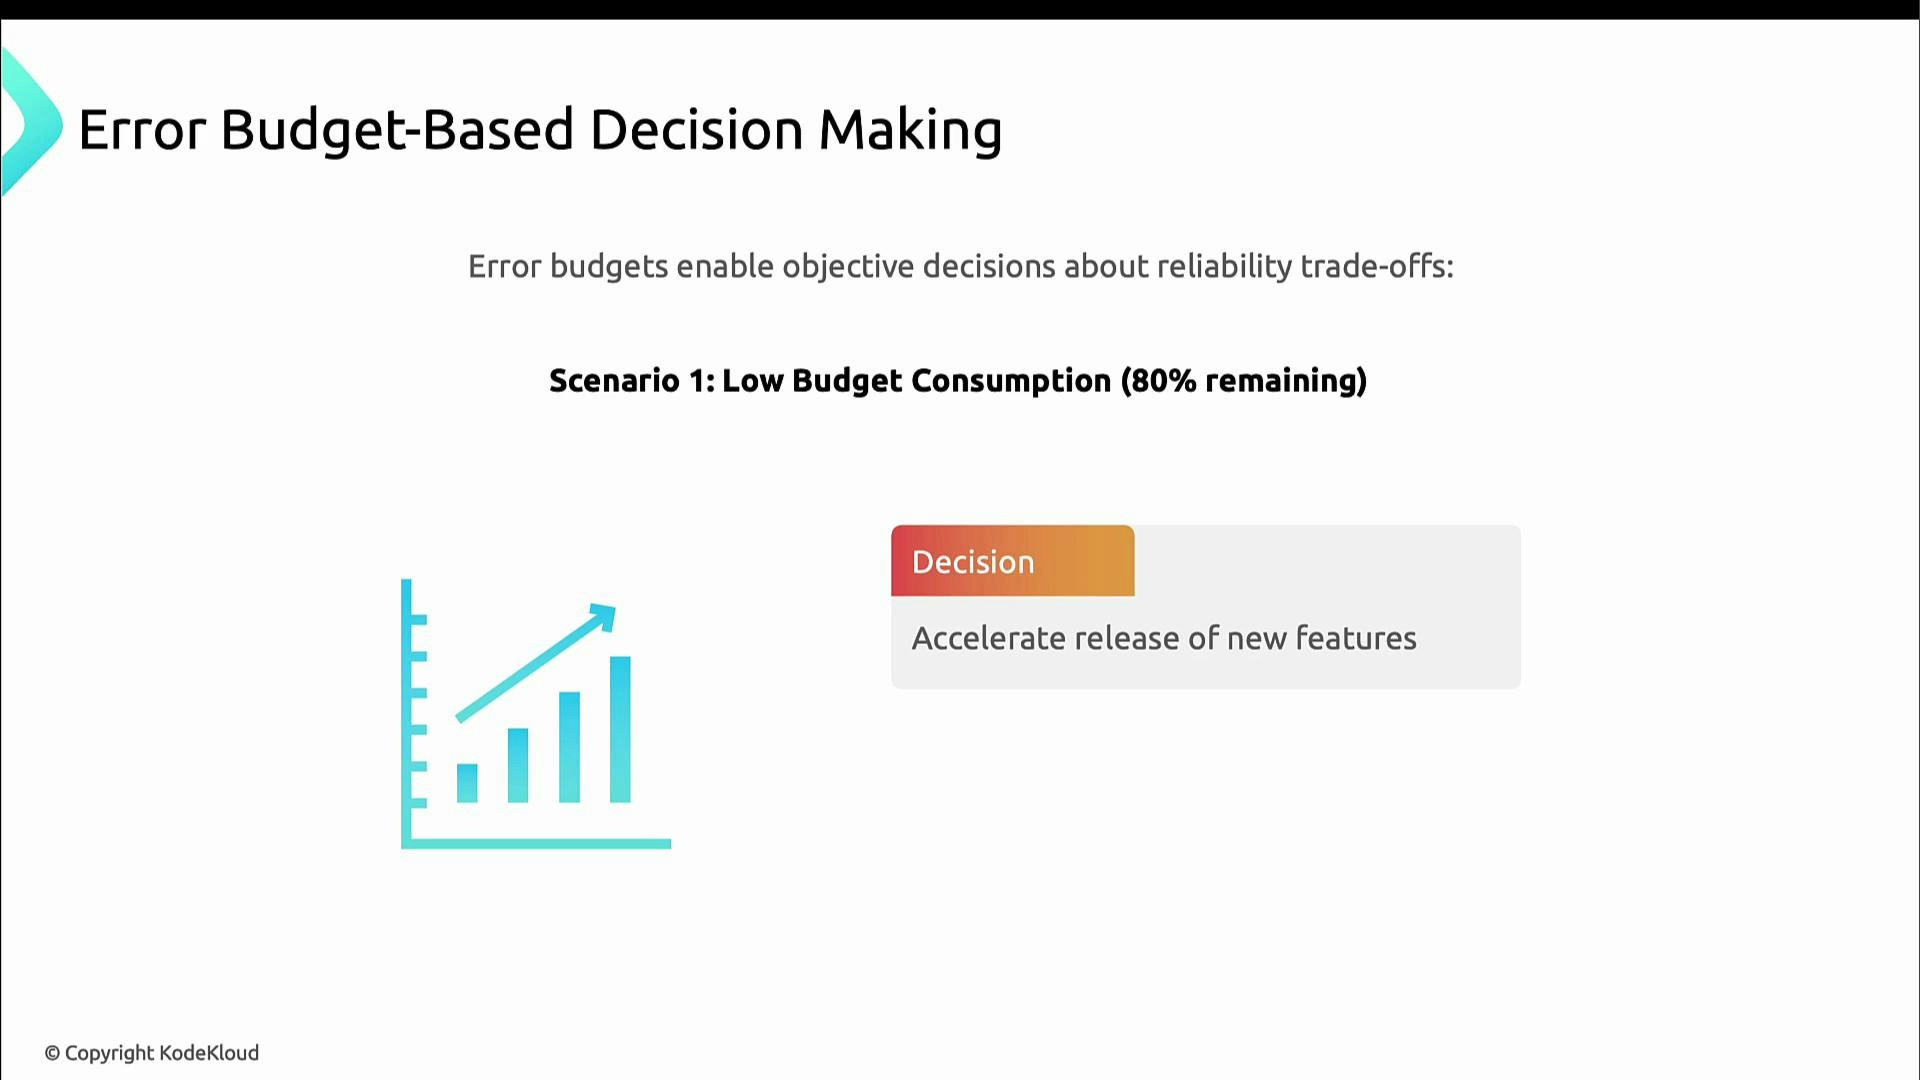
Common pitfalls and mitigations
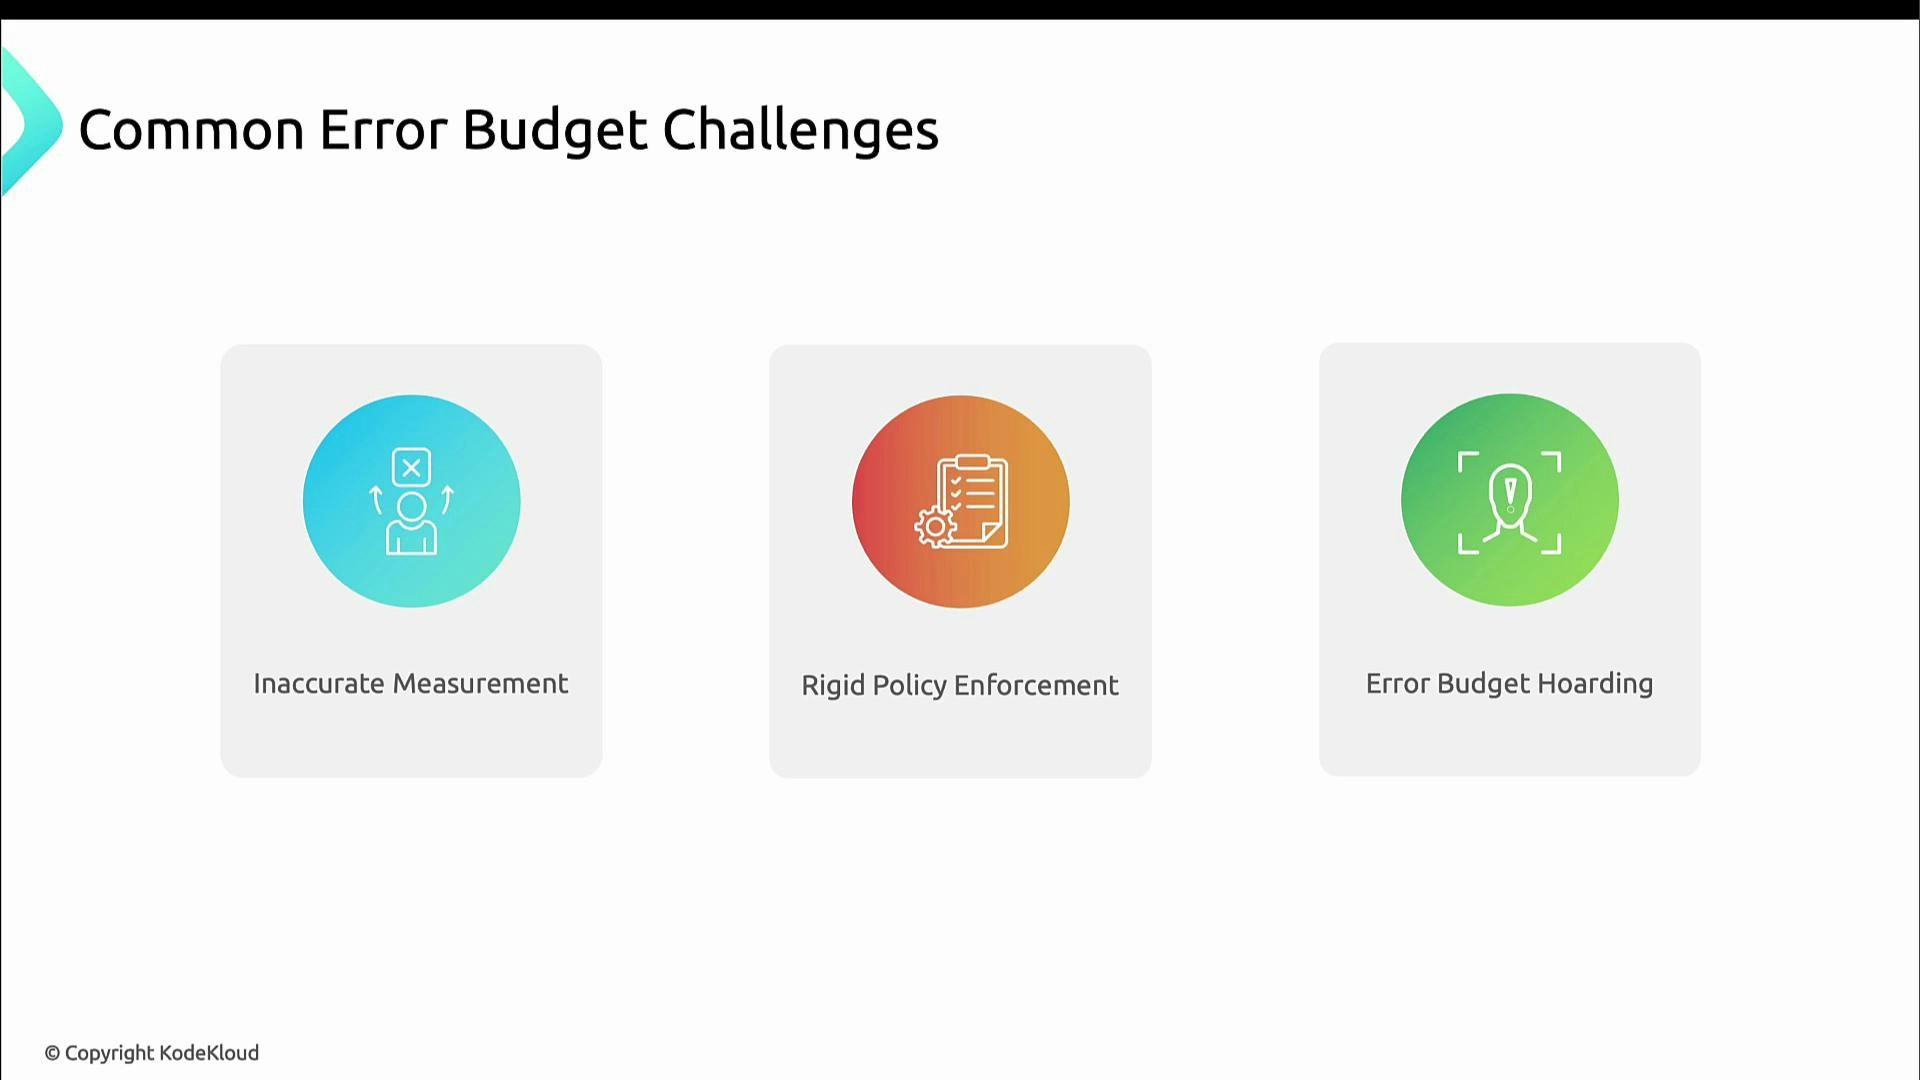
Common pitfalls:- Inaccurate measurement: wrong metrics or broken tagging produce misleading consumption.
- Overly rigid enforcement: inflexibility can block necessary, time-sensitive work.
- Error budget hoarding: teams avoid meaningful work to “save” budget, stifling innovation.
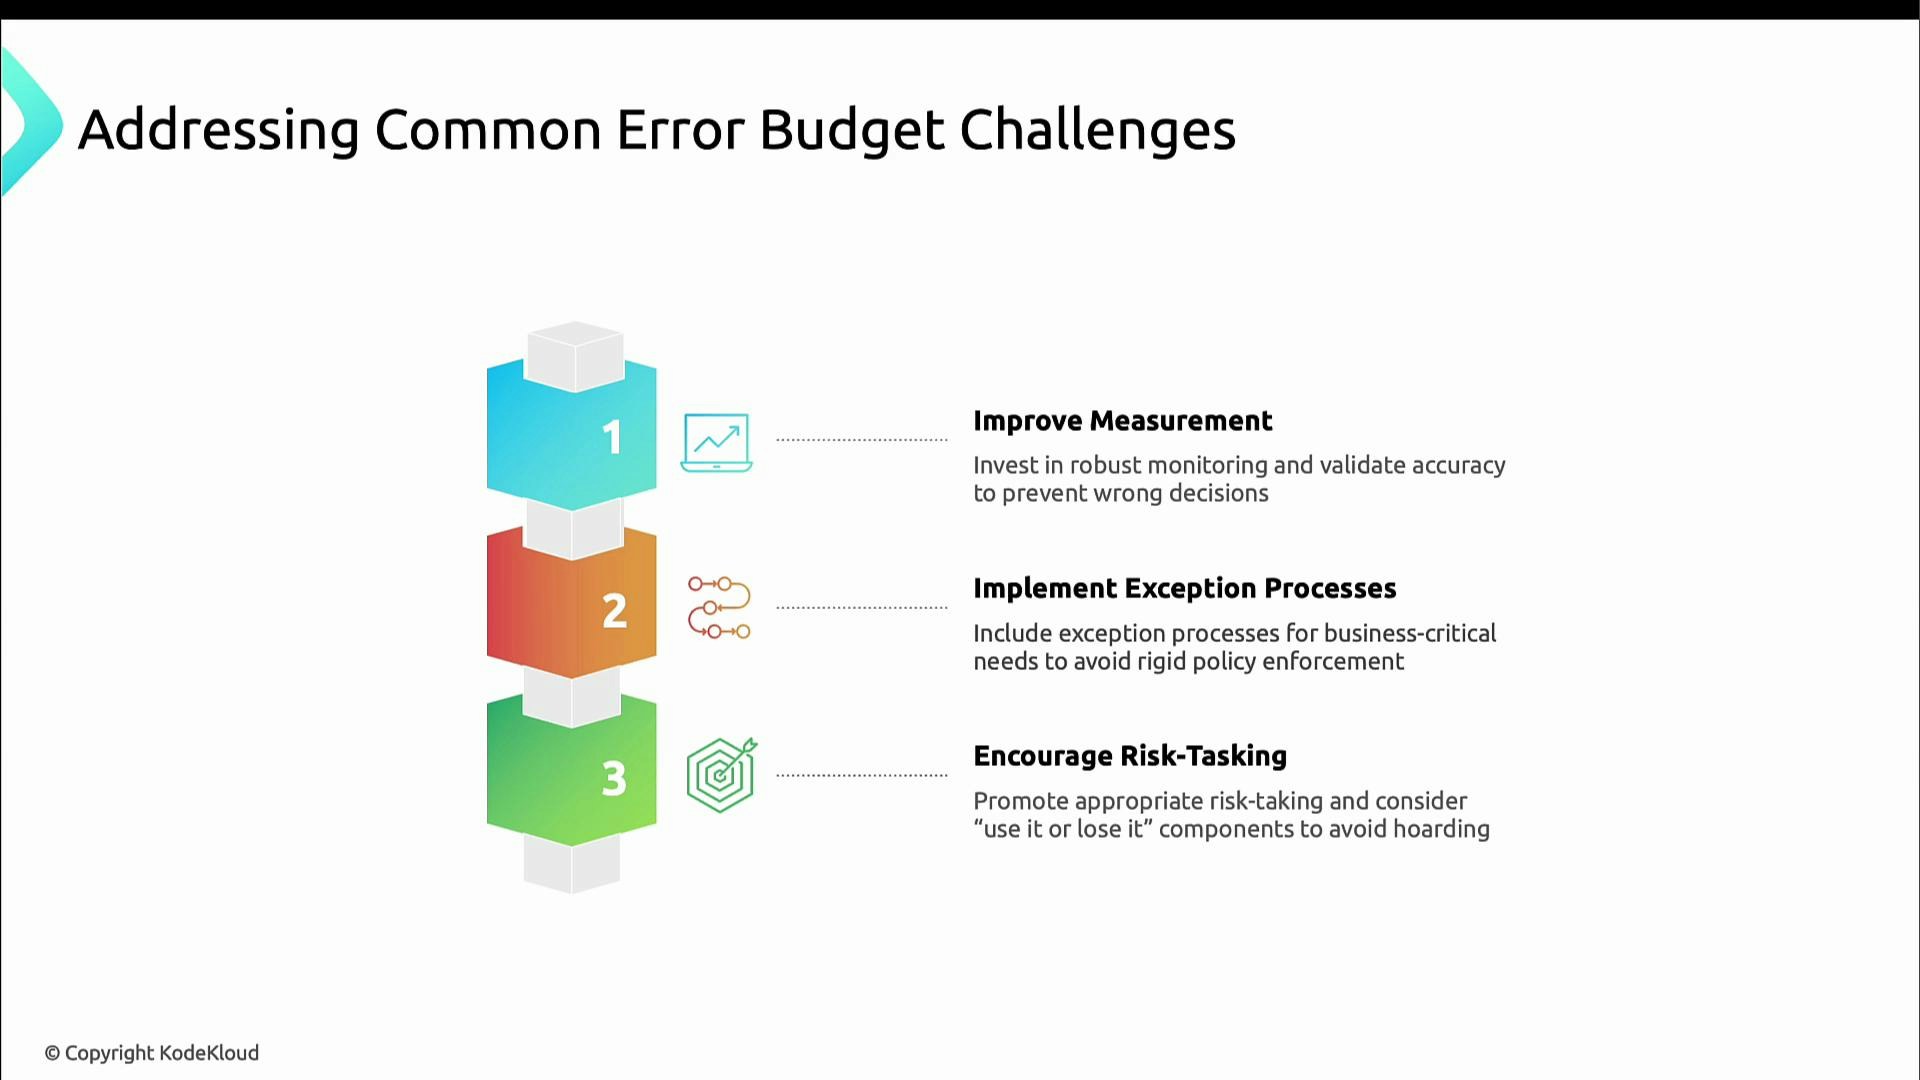
- Validate metrics and tagging; run audits so measurements are trustworthy.
- Publish a documented exceptions process for business‑critical or emergency changes.
- Encourage responsible risk-taking; consider “use-it-or-lose-it” policies to prevent hoarding.
Summary
Error budgets convert abstract reliability goals into concrete, actionable data. They help teams balance innovation and stability when:- Measurements are trusted and auditable.
- Policies and thresholds are clear and socialized.
- Dashboards and automation make SLI/SLO/error-budget status visible across the organization.