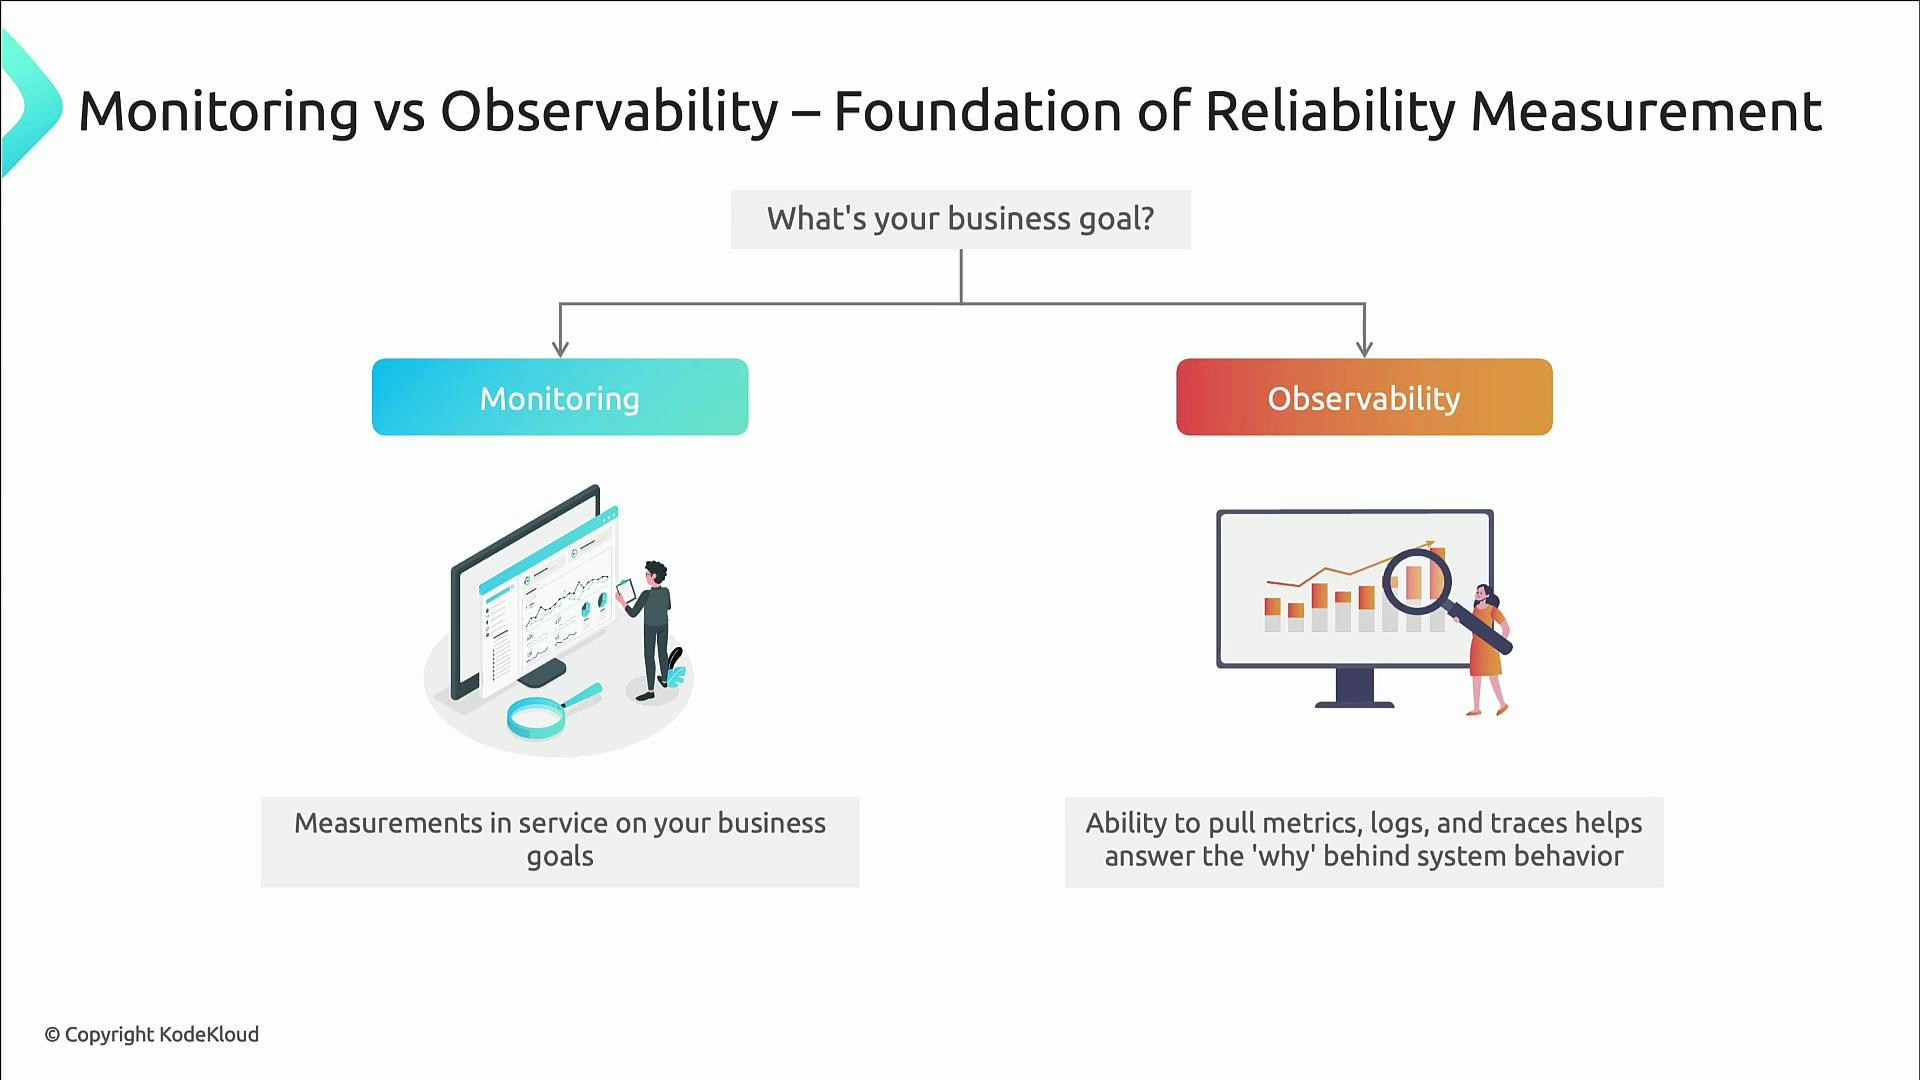
- Monitoring — provides the quantitative measurements used to check service health and SLO compliance.
- Observability — provides the context (metrics, logs, traces) required to answer why things fail.
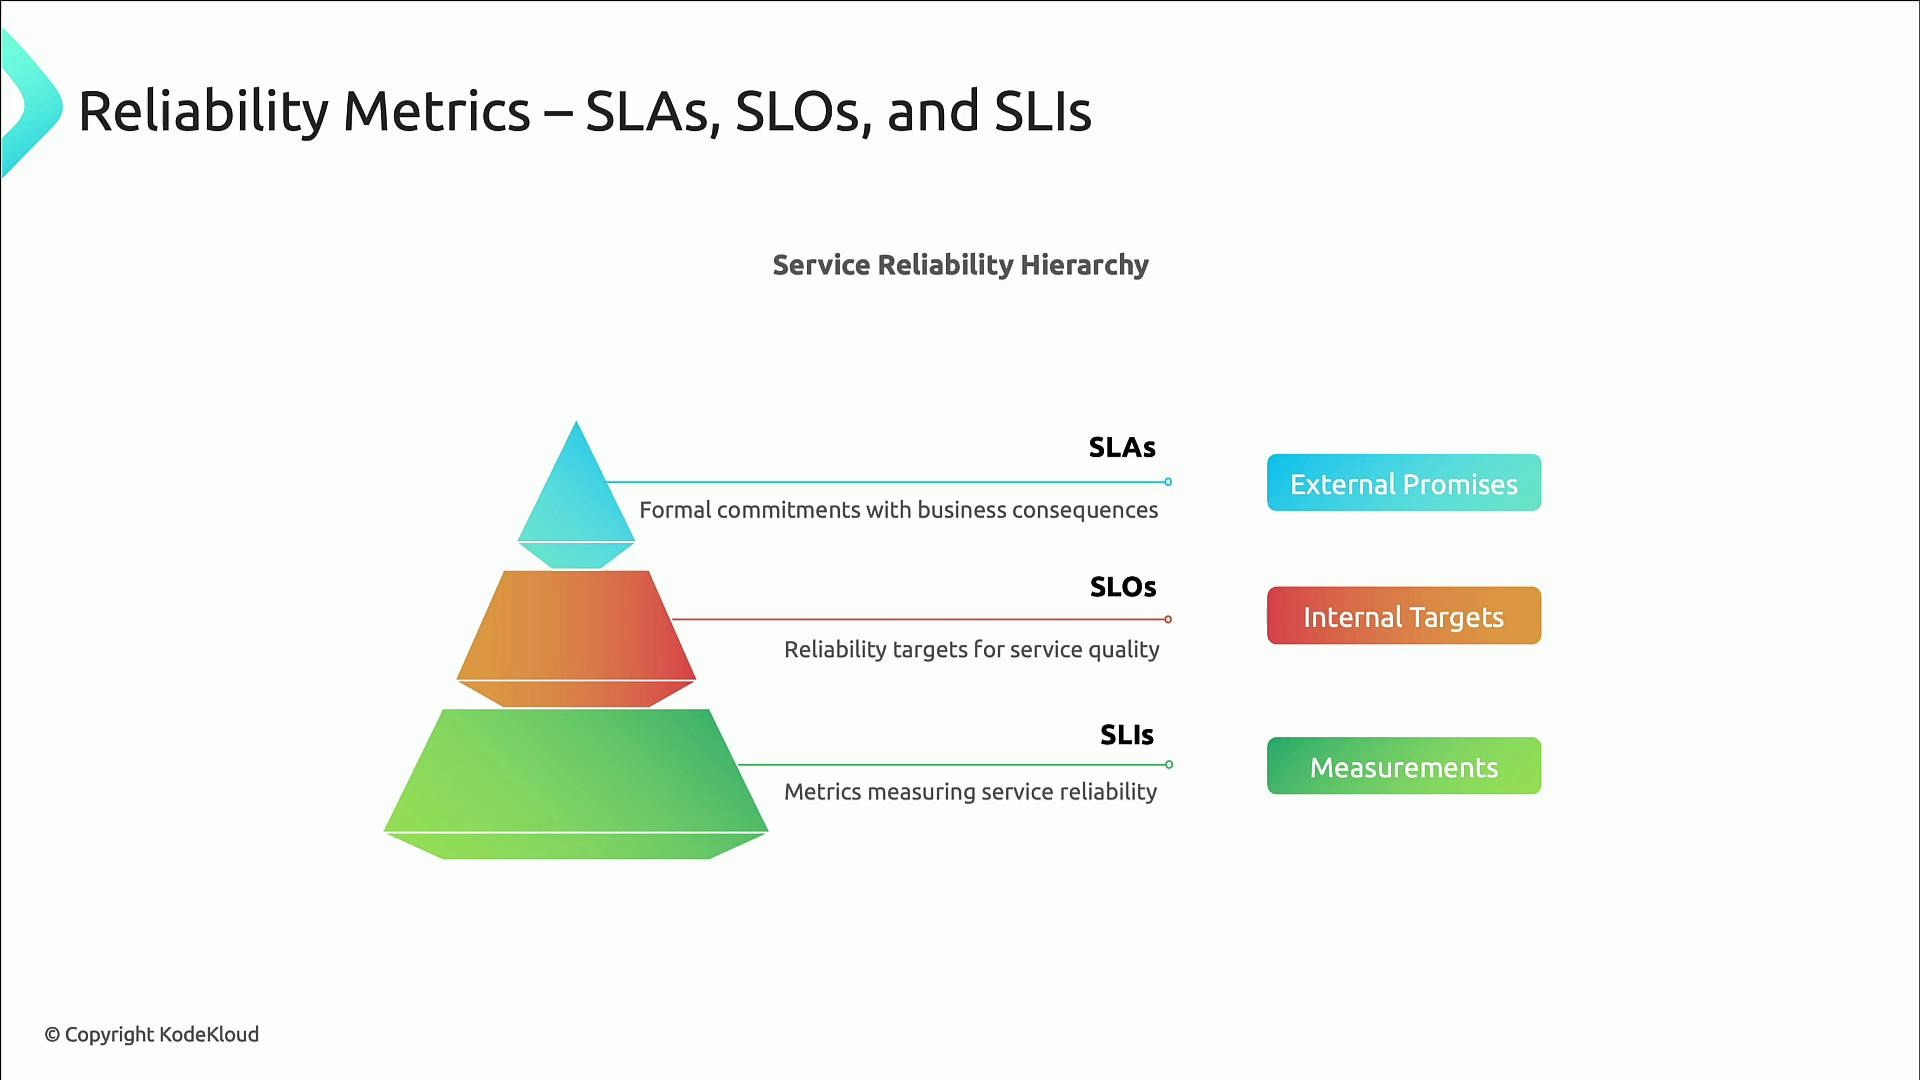
Core concepts: SLIs, SLOs, SLAs
These three concepts form the foundation of reliability measurement. Keep them distinct and linked:- SLAs (Service Level Agreements) — formal, often contractual promises to customers. SLAs frequently include financial or business consequences if missed. Because they are customer-facing, SLAs are typically less aggressive than internal targets.
- Example: 99.9% availability guaranteed; credits issued if availability dips below that.
- SLOs (Service Level Objectives) — internal reliability targets teams set to guide engineering and operations. SLOs answer: how reliable should this service be?
- Examples: 99.9% successful requests over a 30-day window; 95% of requests complete in under 200 ms.
- SLOs are time-bound, measurable, and drive operational behavior (alerts, prioritization, error budgets).
- SLIs (Service Level Indicators) — the measurable signals that reflect user experience. SLIs are the raw metrics you measure to determine SLO compliance.
- Examples: request success rate, latency percentiles, error counts, throughput.
- SLIs must be quantitative and user-focused.
SLOs are internal targets; SLAs are external promises. Set SLOs more aggressively than SLAs to maintain a buffer between internal goals and customer-facing guarantees.
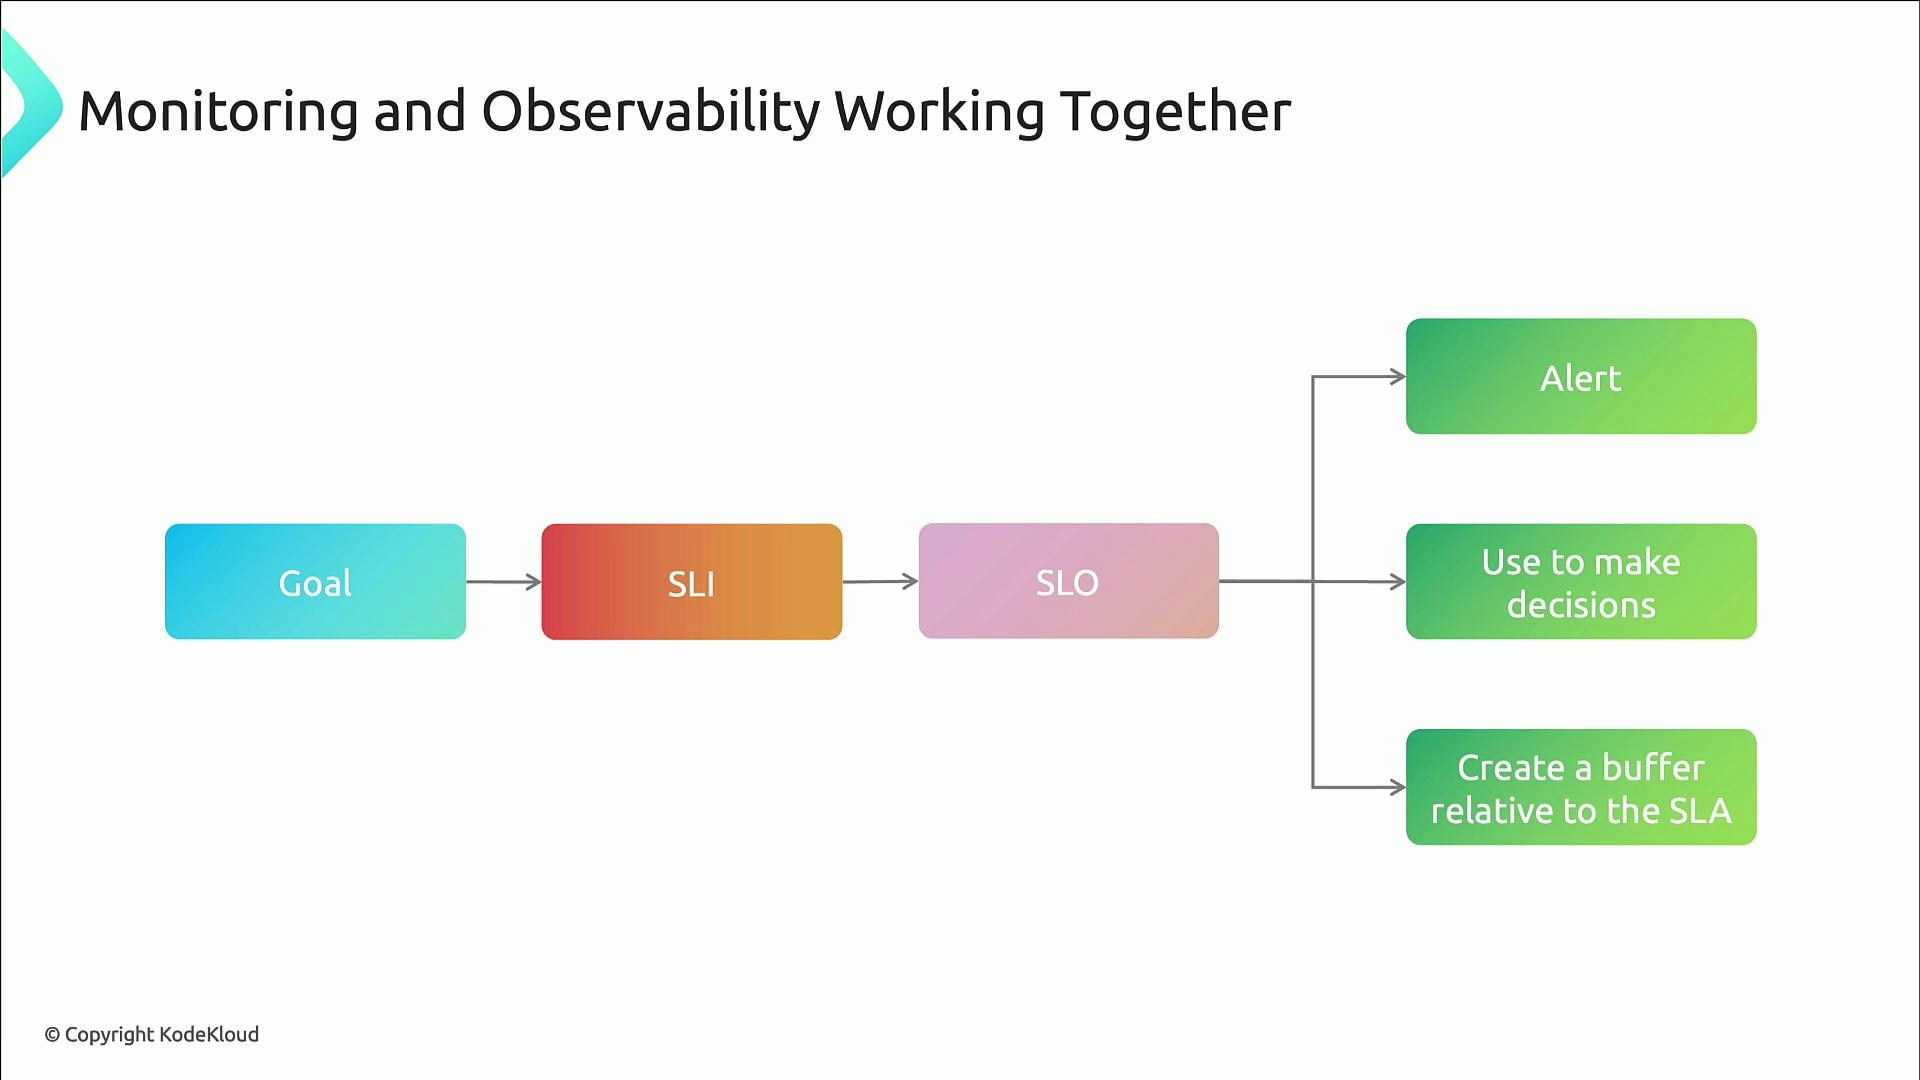
How monitoring and observability work together
- Monitoring supplies the raw measurements (metrics and computed SLIs) and answers “what” — are we within thresholds, is the SLO met, is the error budget being consumed?
- Observability supplies context to answer “why” — traces and logs let you debug unknown failure modes and correlate data across systems.
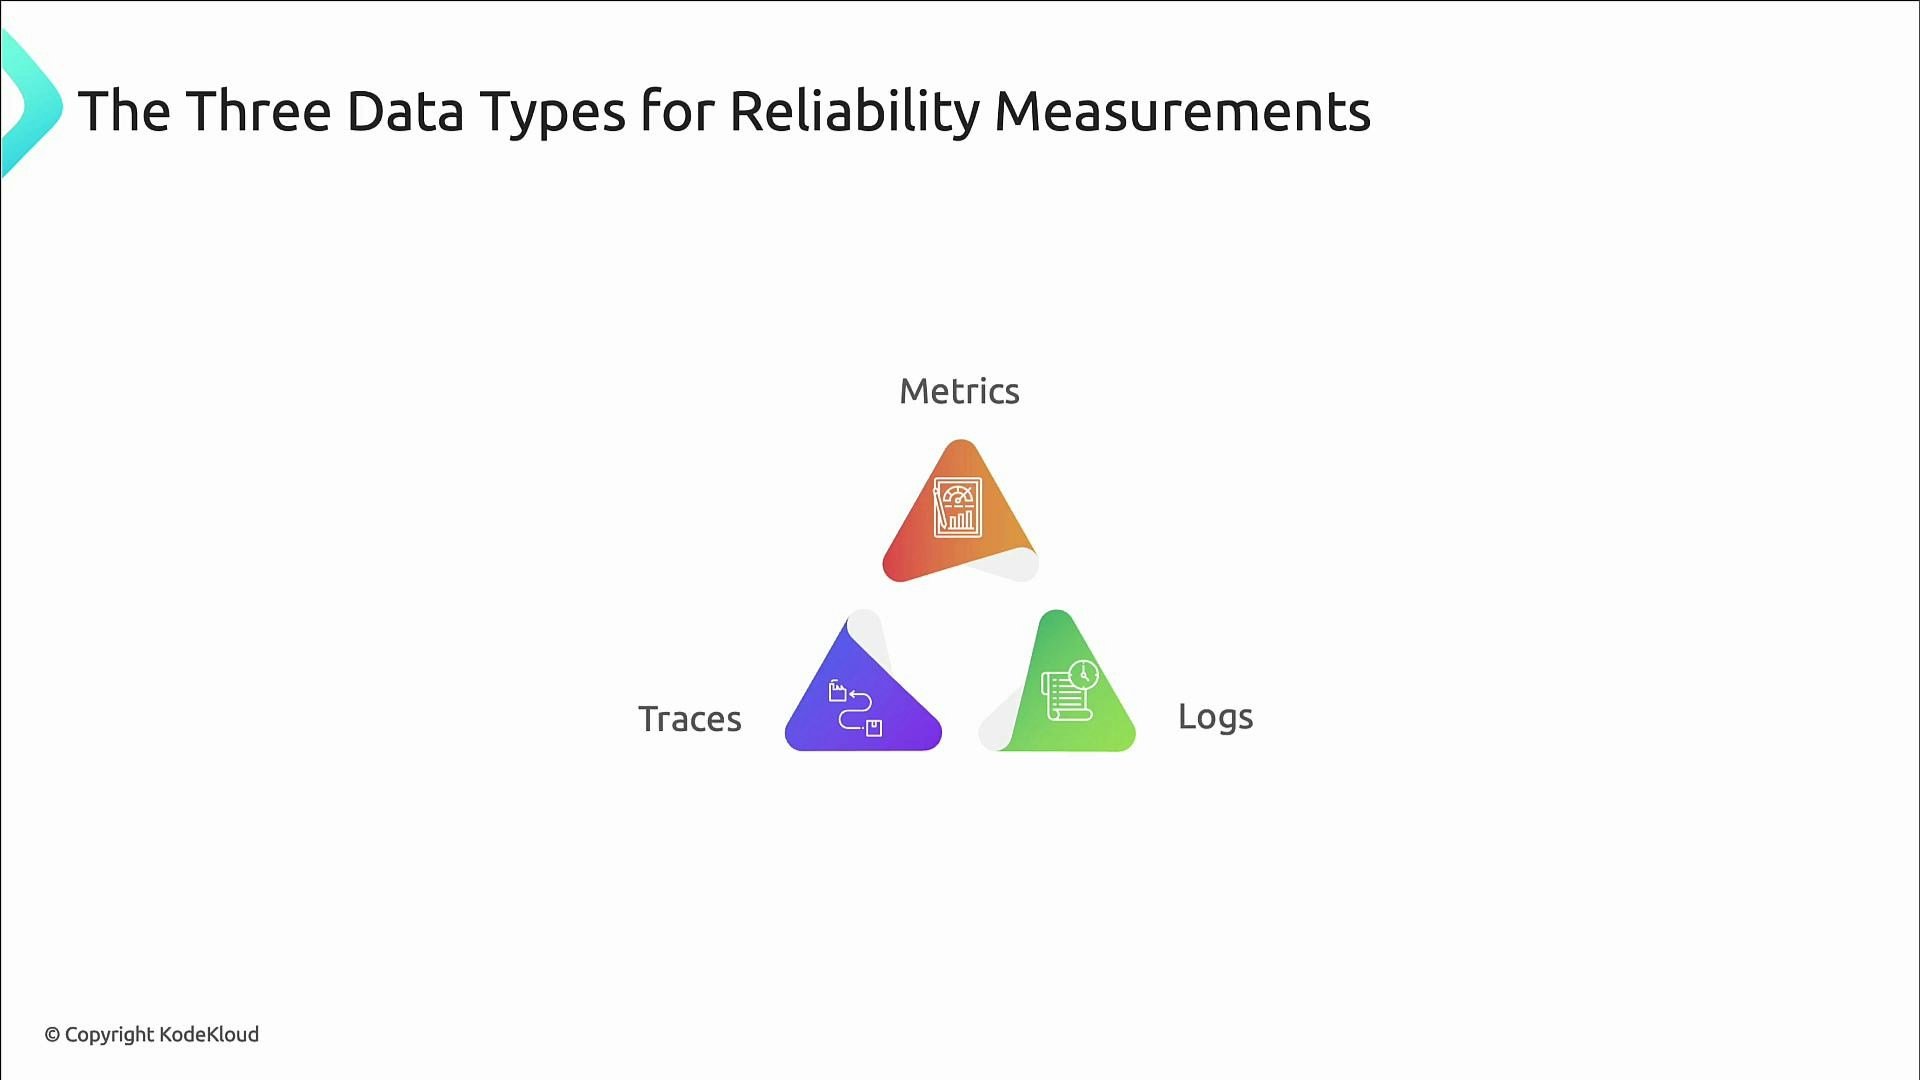
Telemetry types and their roles
- Metrics — numerical measurements sampled over time. Metrics form the backbone of SLIs and SLO checks. Use metrics for trend detection, anomaly detection, and error-budget accounting.
- Common SLI metrics:
- Request success rate / availability
- Latency percentiles (p50, p95, p99)
- Throughput (requests/sec)
- Error counts
- Example Prometheus-style exposition:
- Common SLI metrics:
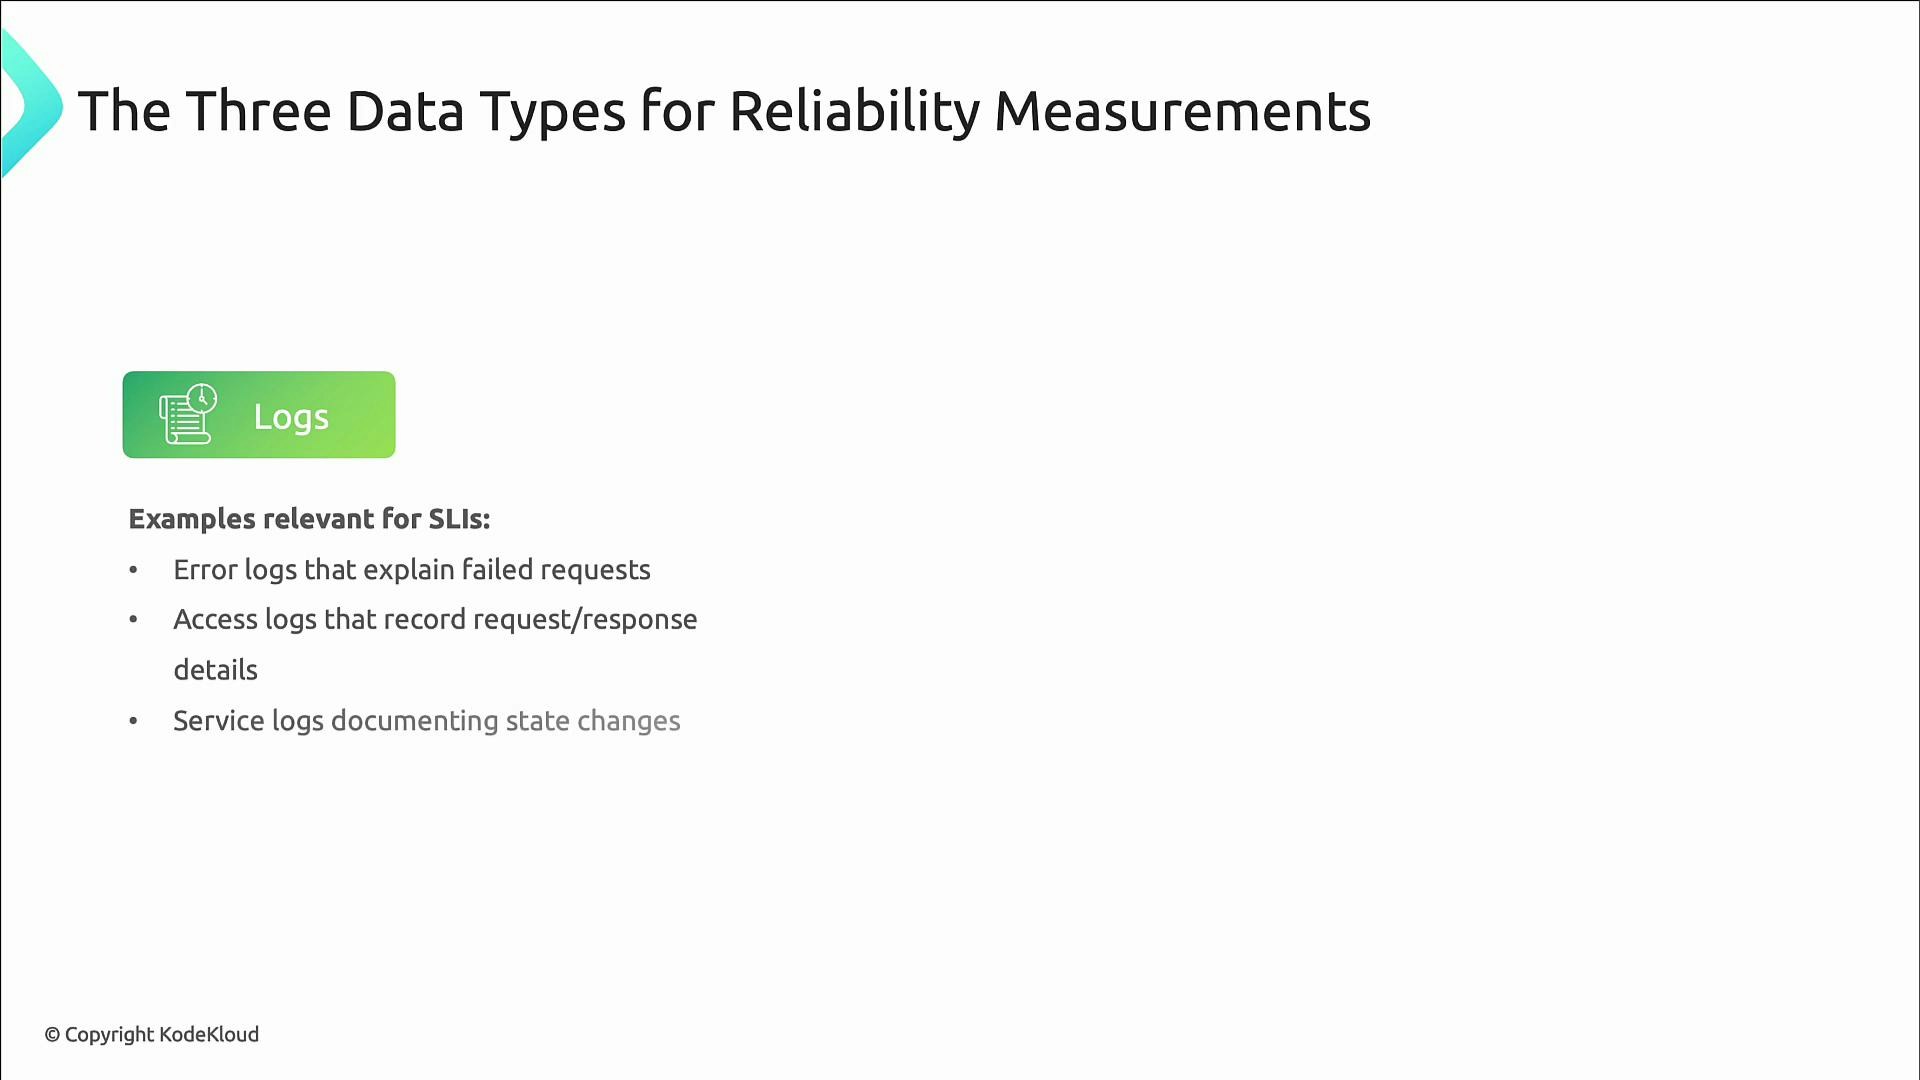
- Logs — timestamped event records that provide rich context: error stacks, request/response payloads, and state transitions. Logs validate metrics and are essential for root-cause analysis. Example log entries:
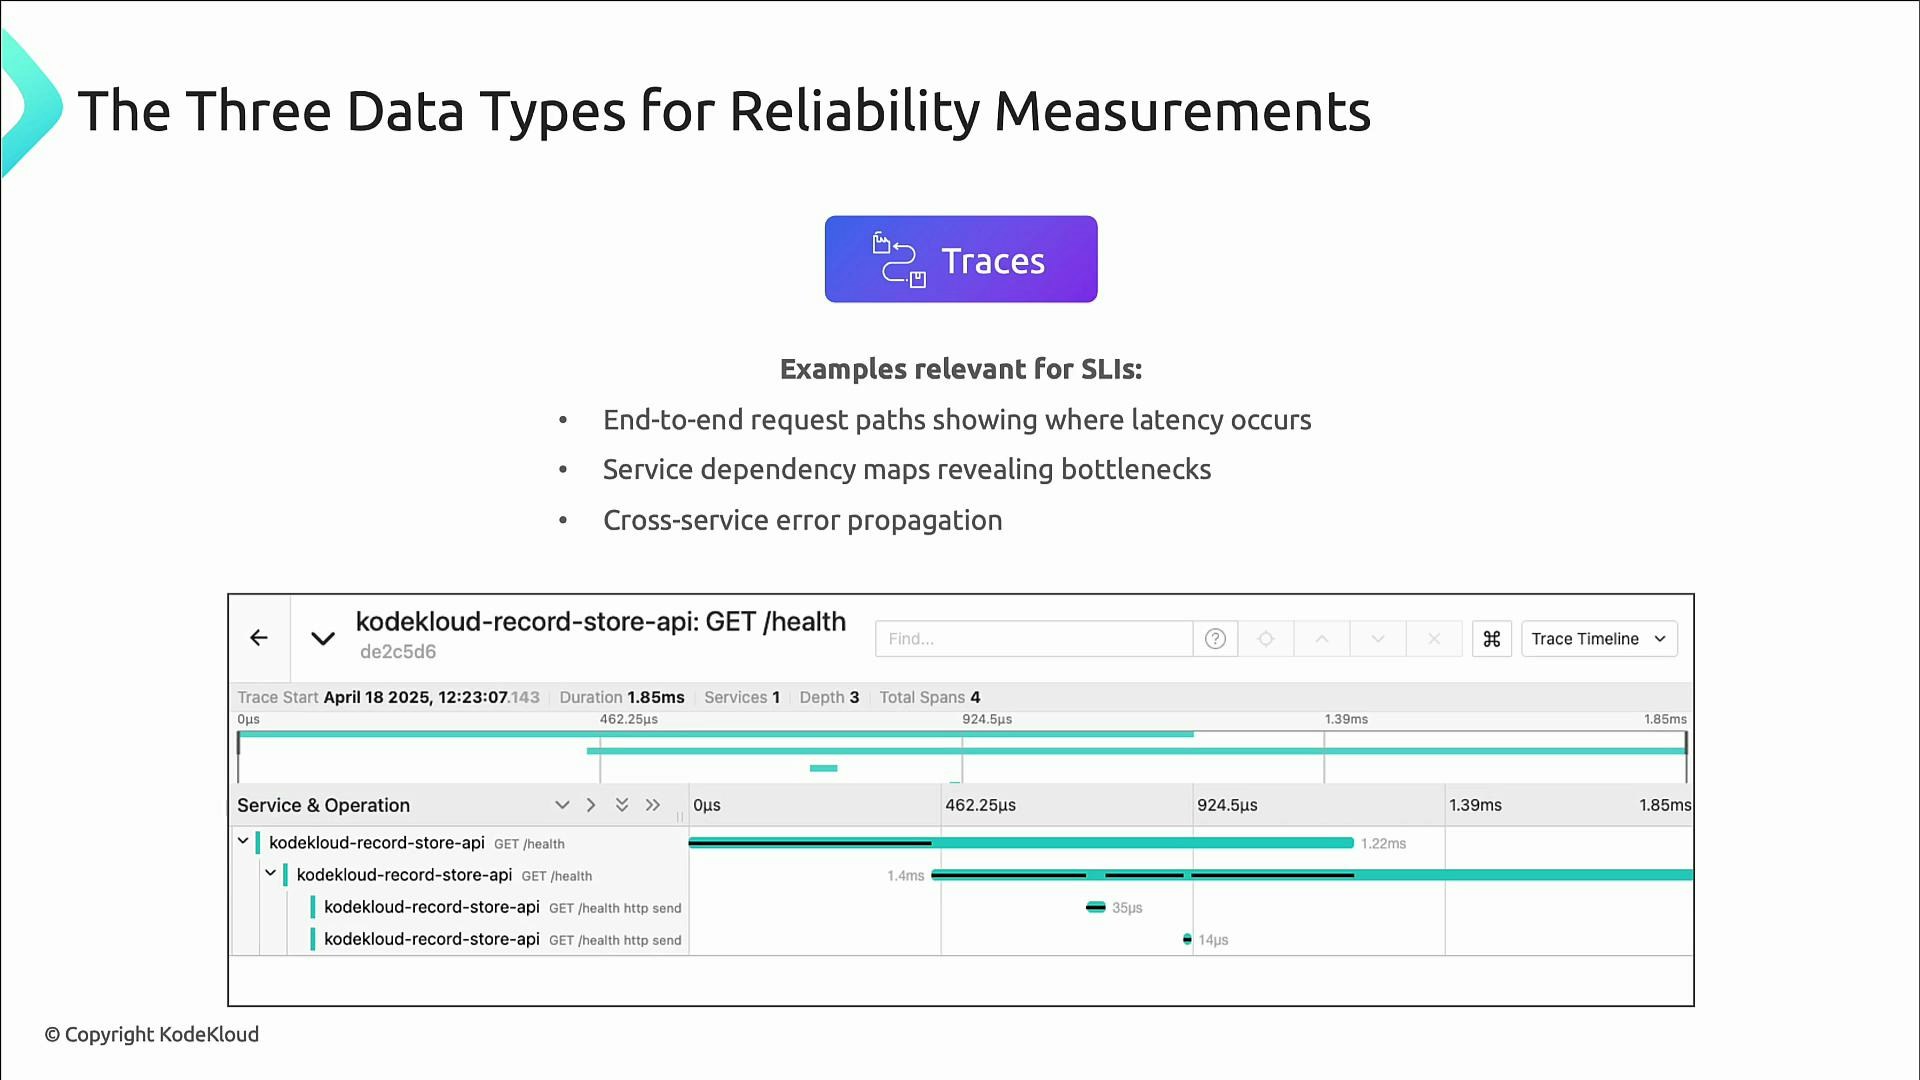
- Traces — record the life of a single request across services and network hops. Traces are vital in distributed systems to pinpoint which service added latency or propagated an error.
Minimal set of SLIs — Google’s four golden signals
If you can only measure four things, capture Google’s golden signals — essential SLIs for reliability and incident response:- Latency — time to serve a request. Use percentiles (p95, p99) to surface slow requests rather than averages.
- Example: 99% of requests complete under 200 ms.
- Traffic — volume of requests (requests per second). Important for capacity planning and impact assessment.
- Example: 1,000 requests/s with under 1% errors.
- Saturation — how close resources are to limits (CPU, memory, queue depth). Saturation is an early warning sign of trouble.
- Errors — rate of failed requests. Define what constitutes an error for your system (HTTP 5xx, timeouts, application exceptions).
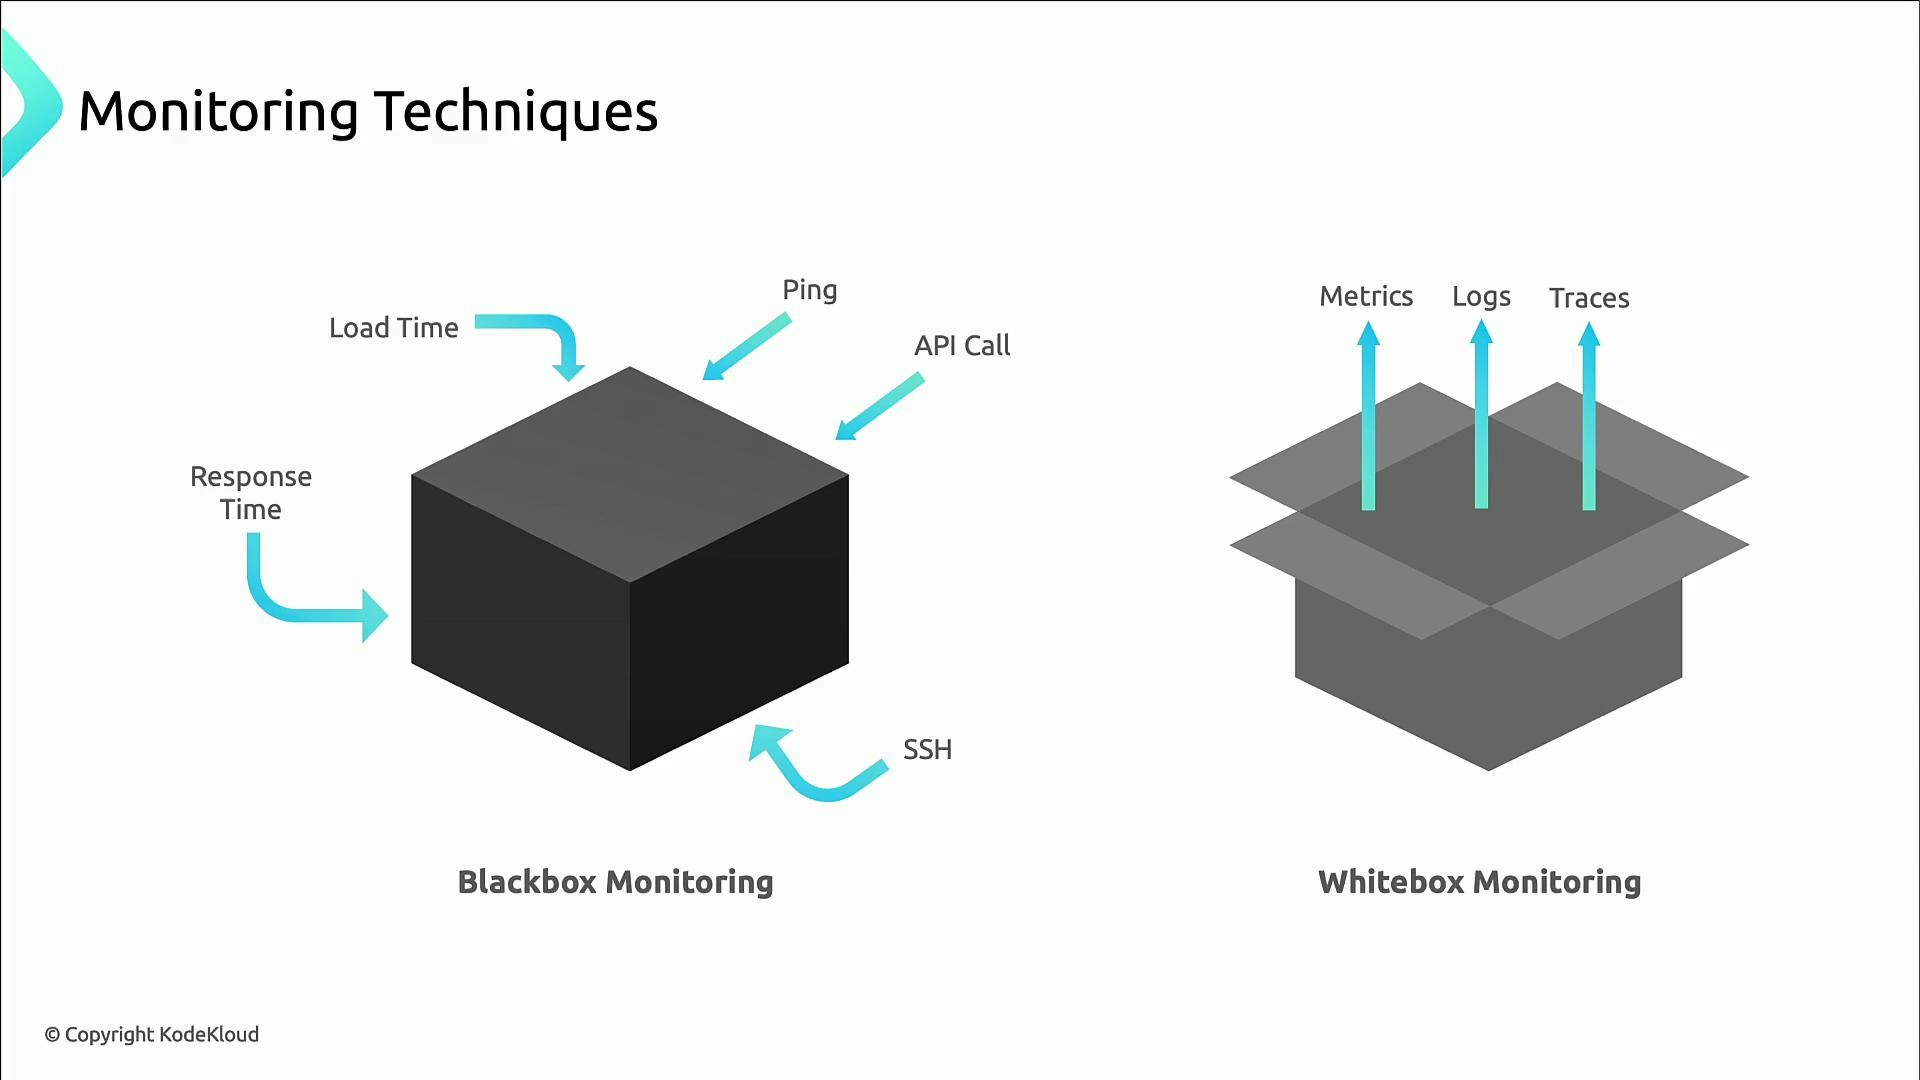
Black box vs white box monitoring
- Black box (external) monitoring simulates user interactions and measures availability/latency from the end-user perspective: pings, synthetic transactions, page load timings.
- White box (internal) monitoring exposes service-internal telemetry (metrics, logs, traces) so you can diagnose why an SLO failed.
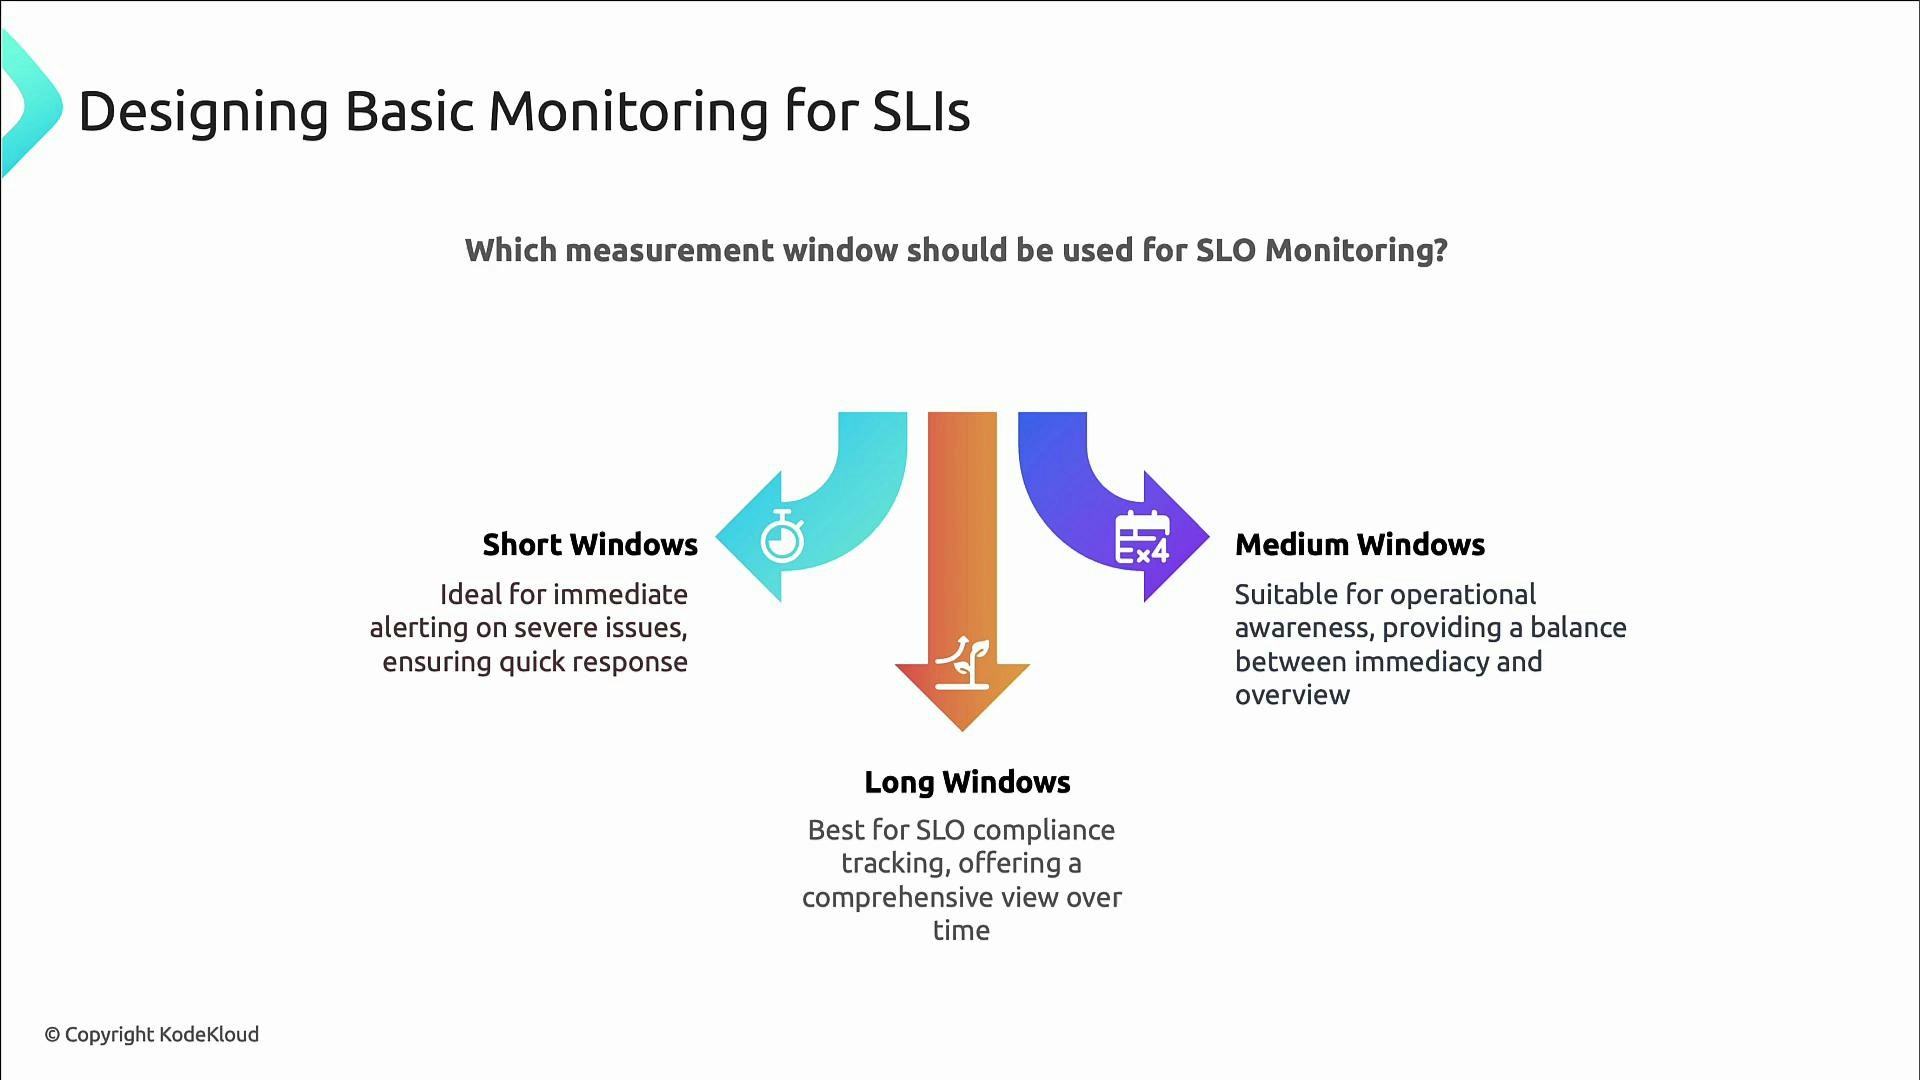
Measurement windows: short, medium, long
Choose measurement windows to match their operational purpose:- Short windows (minutes or hours): immediate alerting and action.
- Medium windows (a few hours): detect gradual degradation and provide operational context.
- Long windows (weeks to months): SLO compliance tracking and long-term reliability goals (e.g., 30-day or quarterly windows).
Common pitfalls when building SLI-based monitoring:
- Using infrastructure metrics (CPU, disk) as SLIs — they rarely reflect user experience.
- Using averages rather than percentiles — averages can hide tail latency that affects users.
- Setting thresholds that are too sensitive (alert fatigue) or too lax (missed incidents).
- Measuring in the wrong place — always measure as close to the user as possible (use synthetic and real-user monitoring).
- Prometheus exposition formats
- Google SRE Book — Monitoring Distributed Systems
- Observability resources and practices