Welcome back. In this final lesson/article we’ll cover root cause analysis (RCA) — the structured approach for moving beyond surface symptoms of an incident to discover why it happened and how to prevent recurrence. RCA is investigative, not accusatory: the goal is to learn how the system and processes allowed the failure, then design specific, testable fixes. A typical scenario: a service becomes slower and slower. At first you only see degraded behavior — is it a bug, a resource bottleneck, or something else? As you inspect logs and metrics you might find old jobs piling up and clogging the system. RCA helps you peel layers like this until you identify the true drivers of failure and actions that reduce future risk. Common misconceptions about RCA:
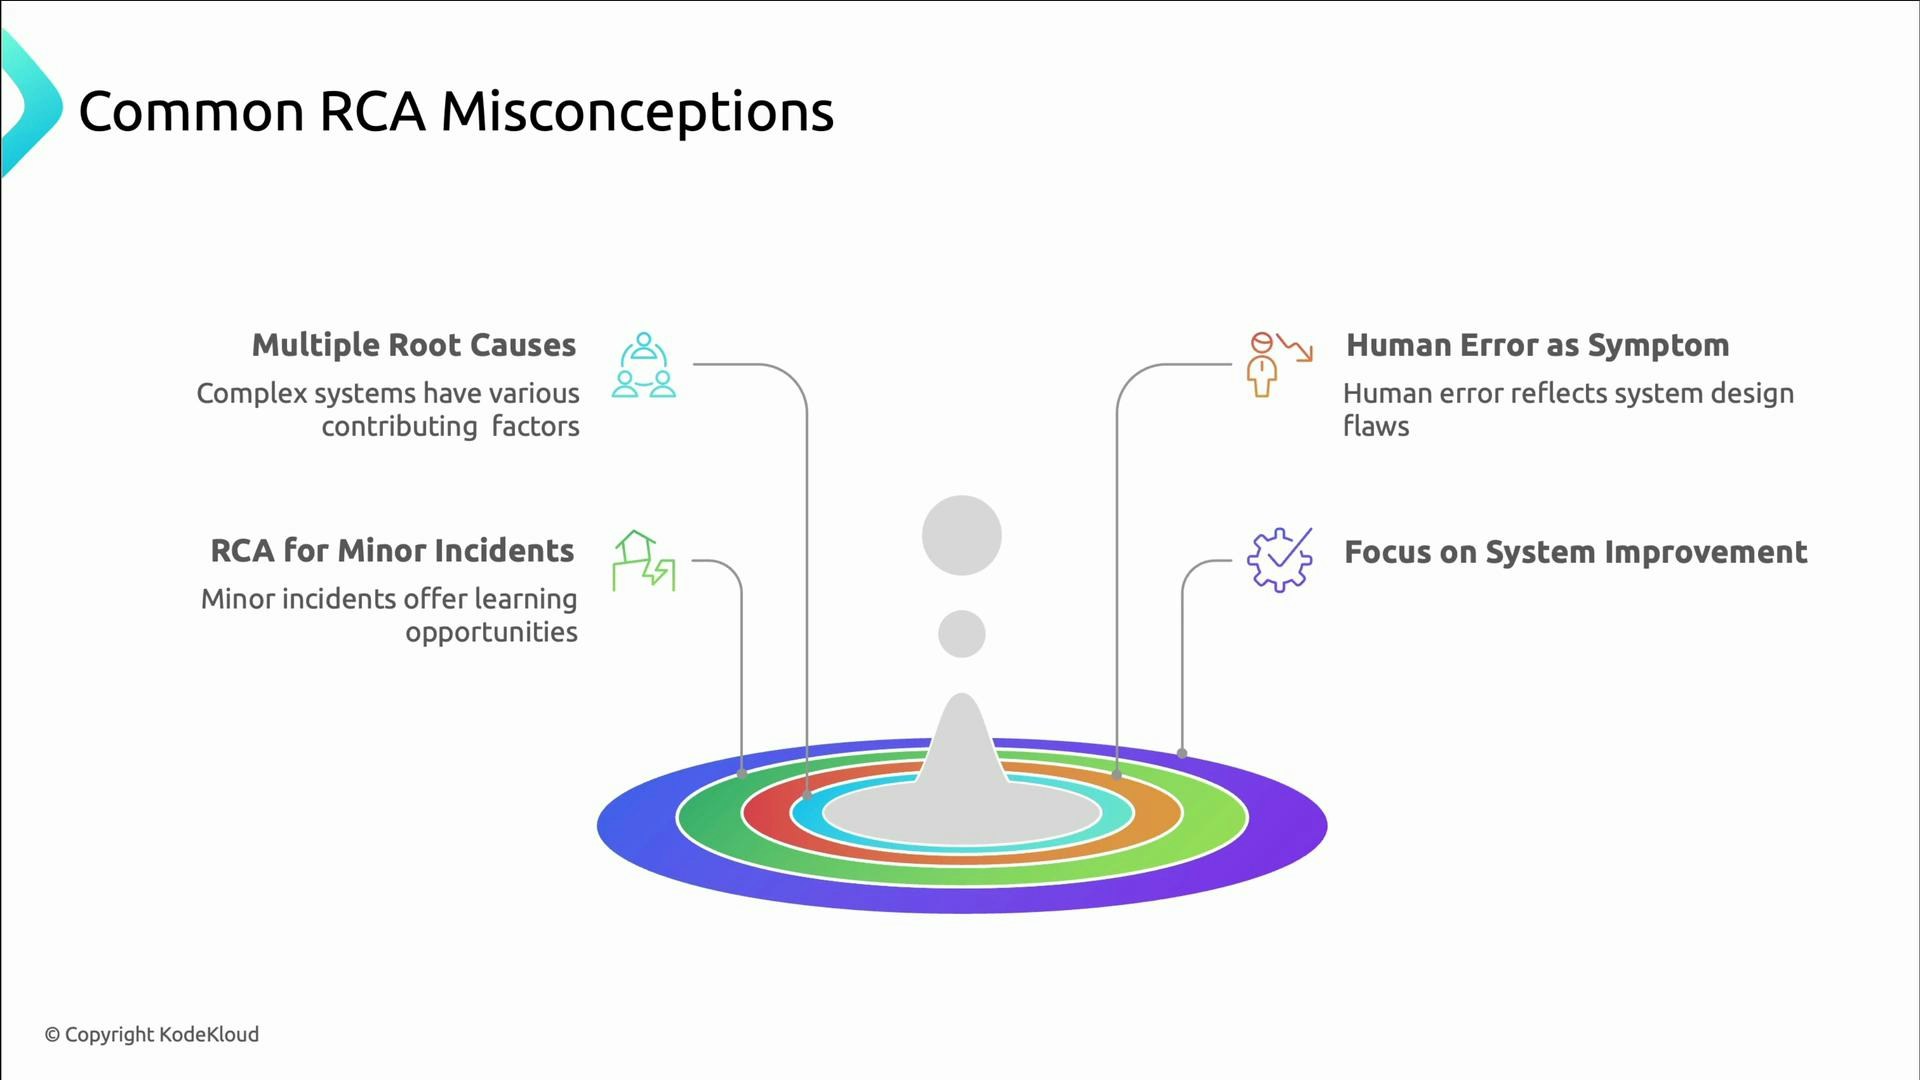
  • Complex systems rarely fail from a single cause — incidents usually have multiple contributing factors.
  • Human error is typically a symptom, not the fundamental root cause; it often exposes gaps in tooling, processes, or design.
  • RCA isn’t only for large outages; small incidents offer high‑value learning opportunities.
  • The aim of RCA is system improvement and prevention, not assigning blame.
A presentation slide titled "Common RCA Misconceptions" listing four points: Multiple Root Causes, RCA for Minor Incidents, Human Error as Symptom, and Focus on System Improvement. A colorful concentric-ring graphic with a central peak and small icons accompanies the text.
Root cause vs. contributing factors
  • Root cause: the underlying reason the incident occurred (e.g., a faulty configuration or missing safeguard).
  • Contributing factors: conditions that amplified impact or delayed recovery (e.g., insufficient alerts or overloaded queues).
Separate the levels of causation when investigating:
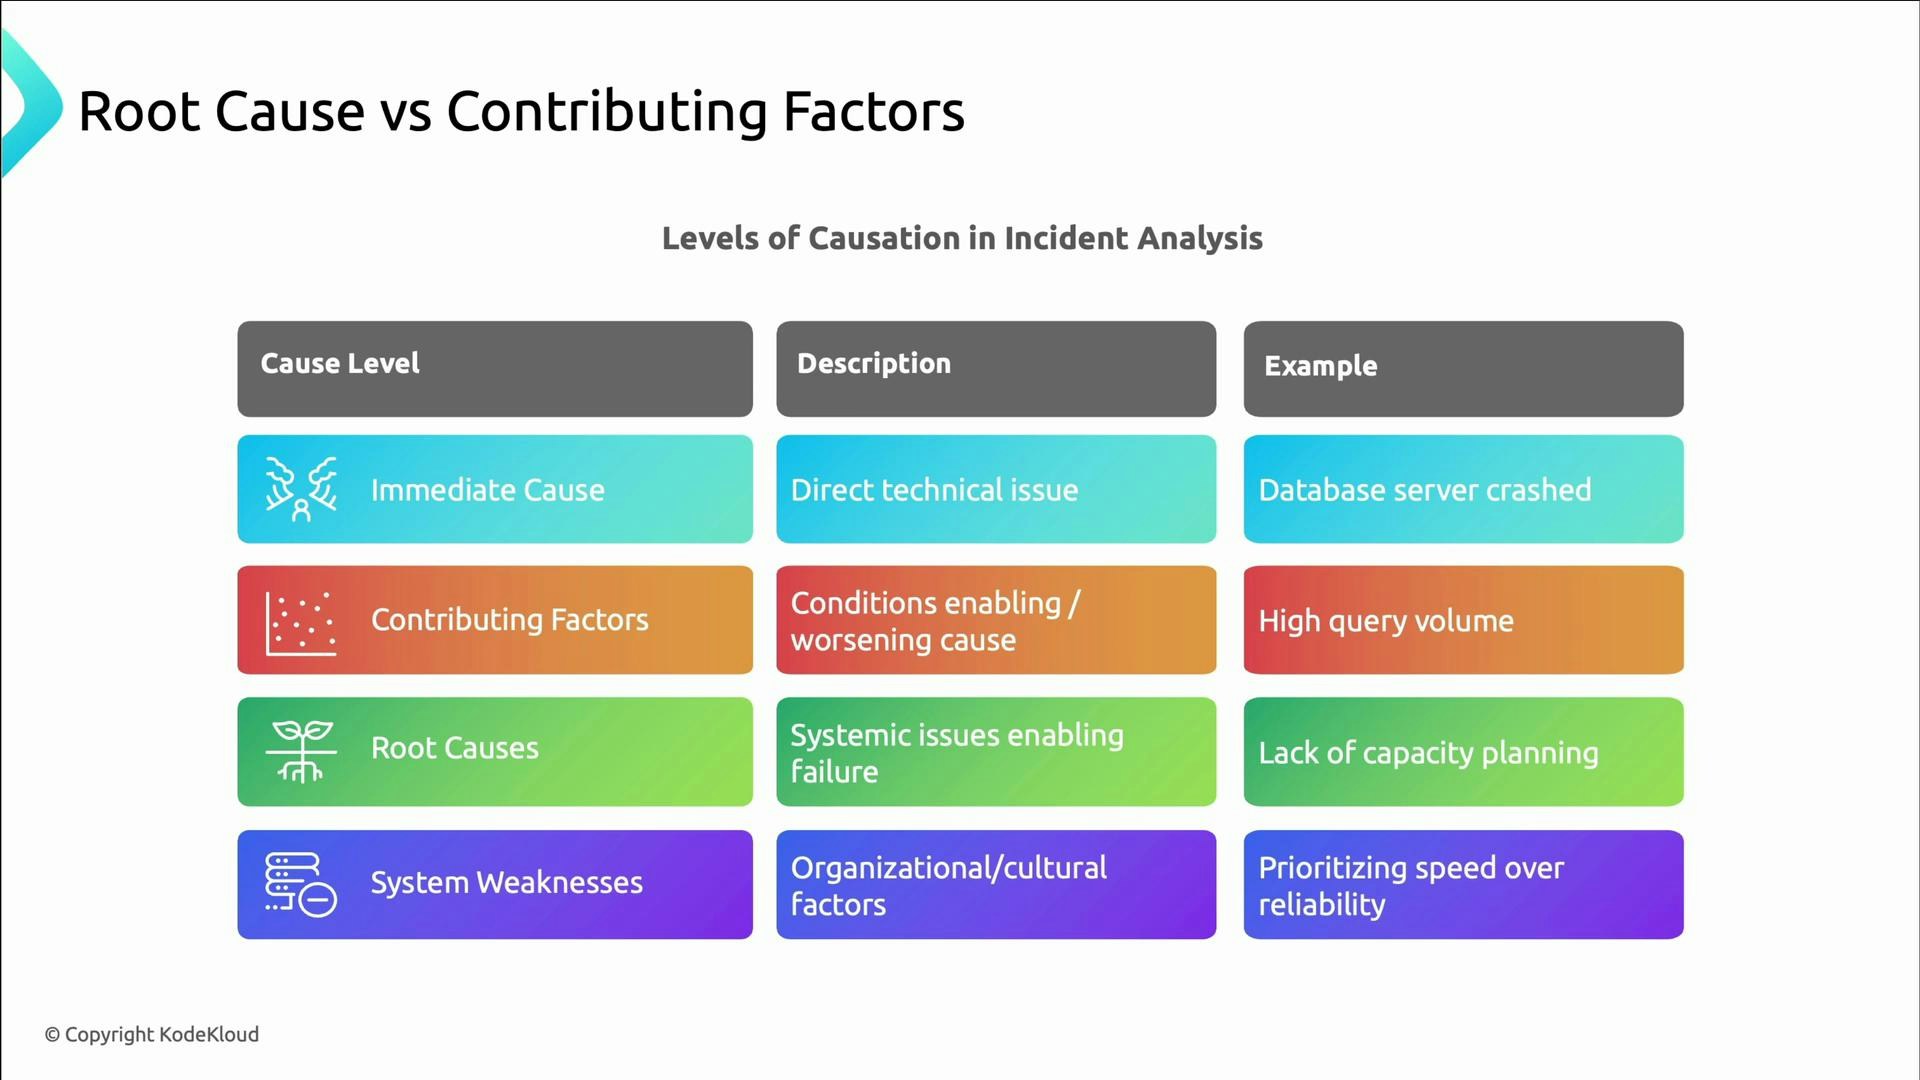
  • Immediate cause: the direct technical failure (e.g., the database server crashed).
  • Contributing factors: conditions that worsened the outcome (e.g., sudden spike in traffic).
  • Root causes: systemic gaps that permitted the failure (e.g., lack of capacity planning).
  • System weaknesses: cultural or organizational patterns (e.g., prioritizing speed over reliability).
Effective RCA drills into each level so you can both fix the visible symptom and strengthen the system to reduce recurrence.
An infographic titled "Root Cause vs Contributing Factors" that outlines levels of causation in incident analysis with columns for Cause Level, Description, and Example. It lists Immediate Cause (e.g., database server crashed), Contributing Factors (e.g., high query volume), Root Causes (e.g., lack of capacity planning), and System Weaknesses (e.g., prioritizing speed over reliability).
Real-world example: the 2017 Amazon S3 outage
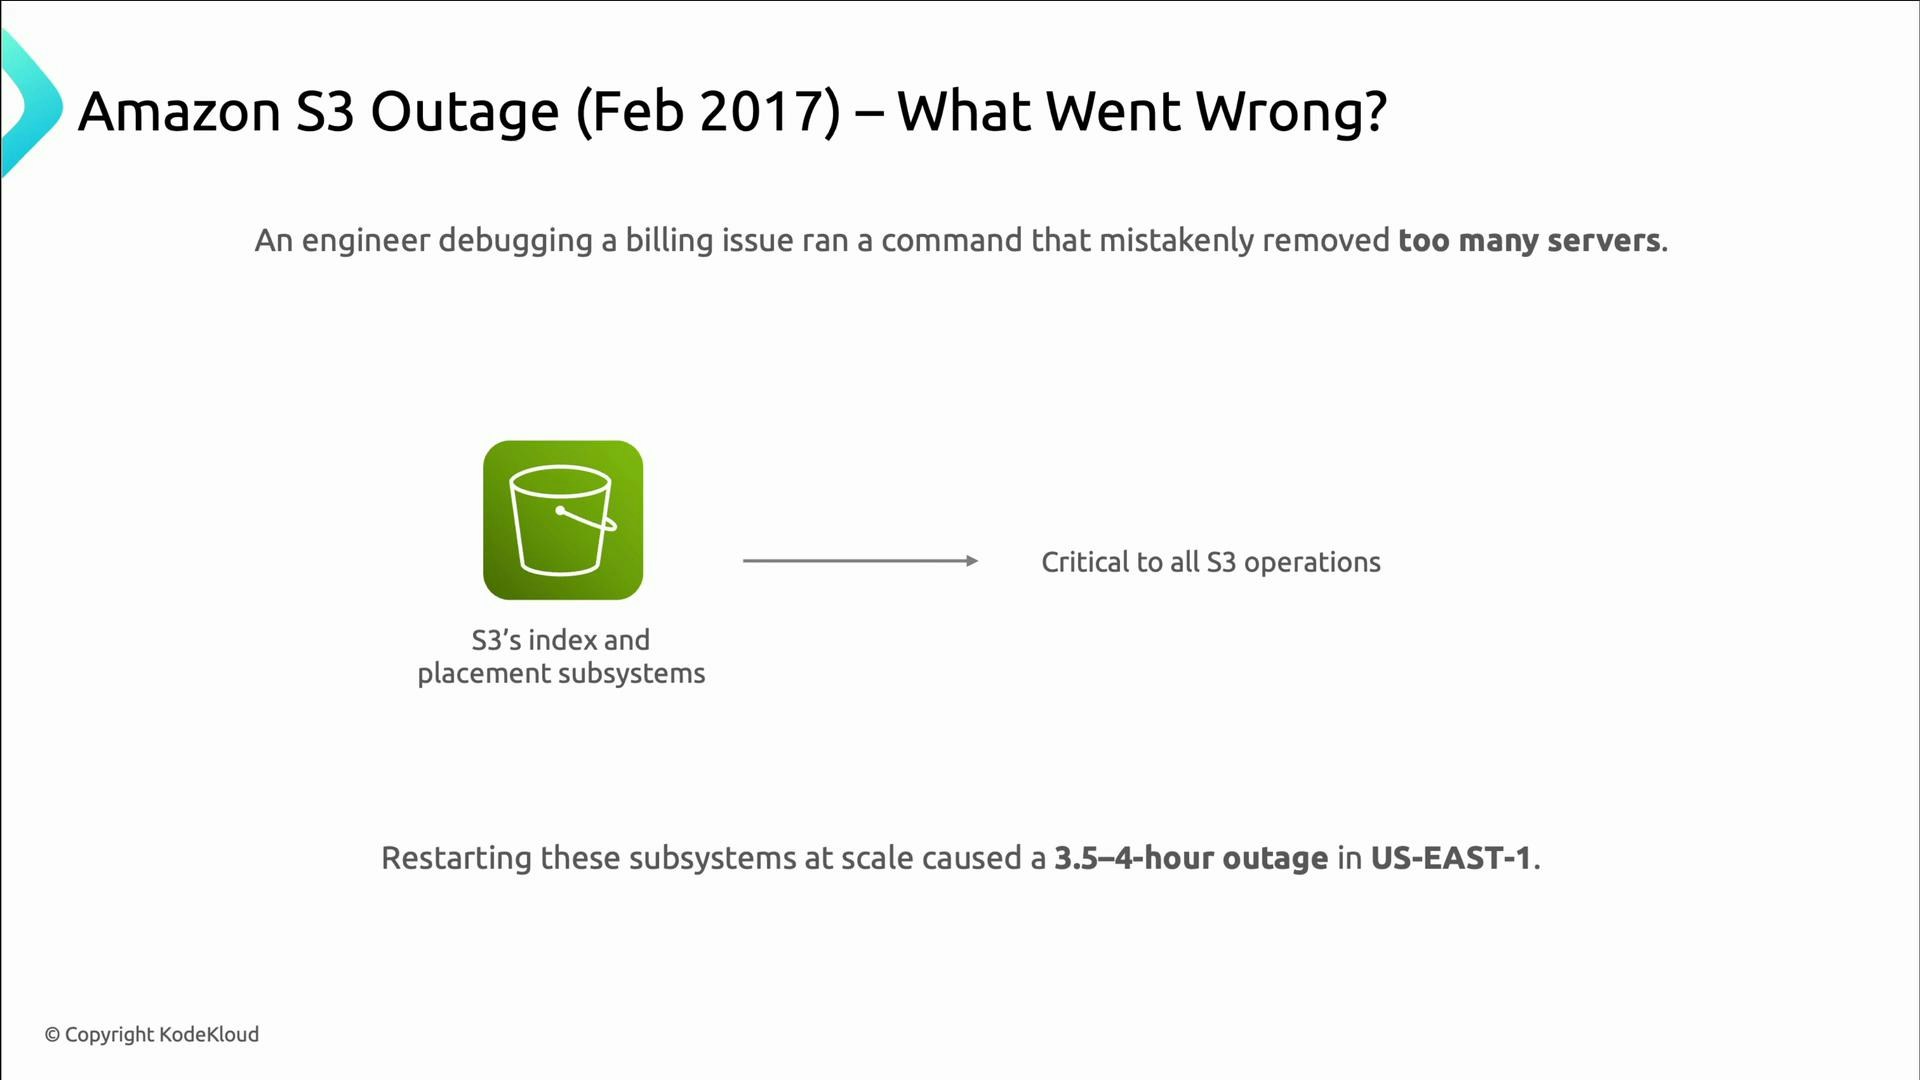
  • While debugging a billing system, an engineer accidentally removed more capacity than intended.
  • That capacity supported S3’s index and placement systems — core to S3 operations.
  • Restarting those subsystems at scale caused a cascading failure and a multi‑hour outage in US‑East‑1.
A presentation slide about the Amazon S3 outage (Feb 2017) explaining that an engineer’s mistaken command removed too many servers, which broke S3’s index and placement subsystems and caused a 3.5–4 hour outage in US‑East‑1.
The outage’s impact was broad: S3 unavailability affected EC2, EBS, Lambda, and even AWS’s service health dashboard (which itself relied on S3). Thousands of applications and websites experienced interruptions. This incident illustrates how a single operator action can cascade when containment and tooling are insufficient. Make RCA repeatable: a common six‑step flow
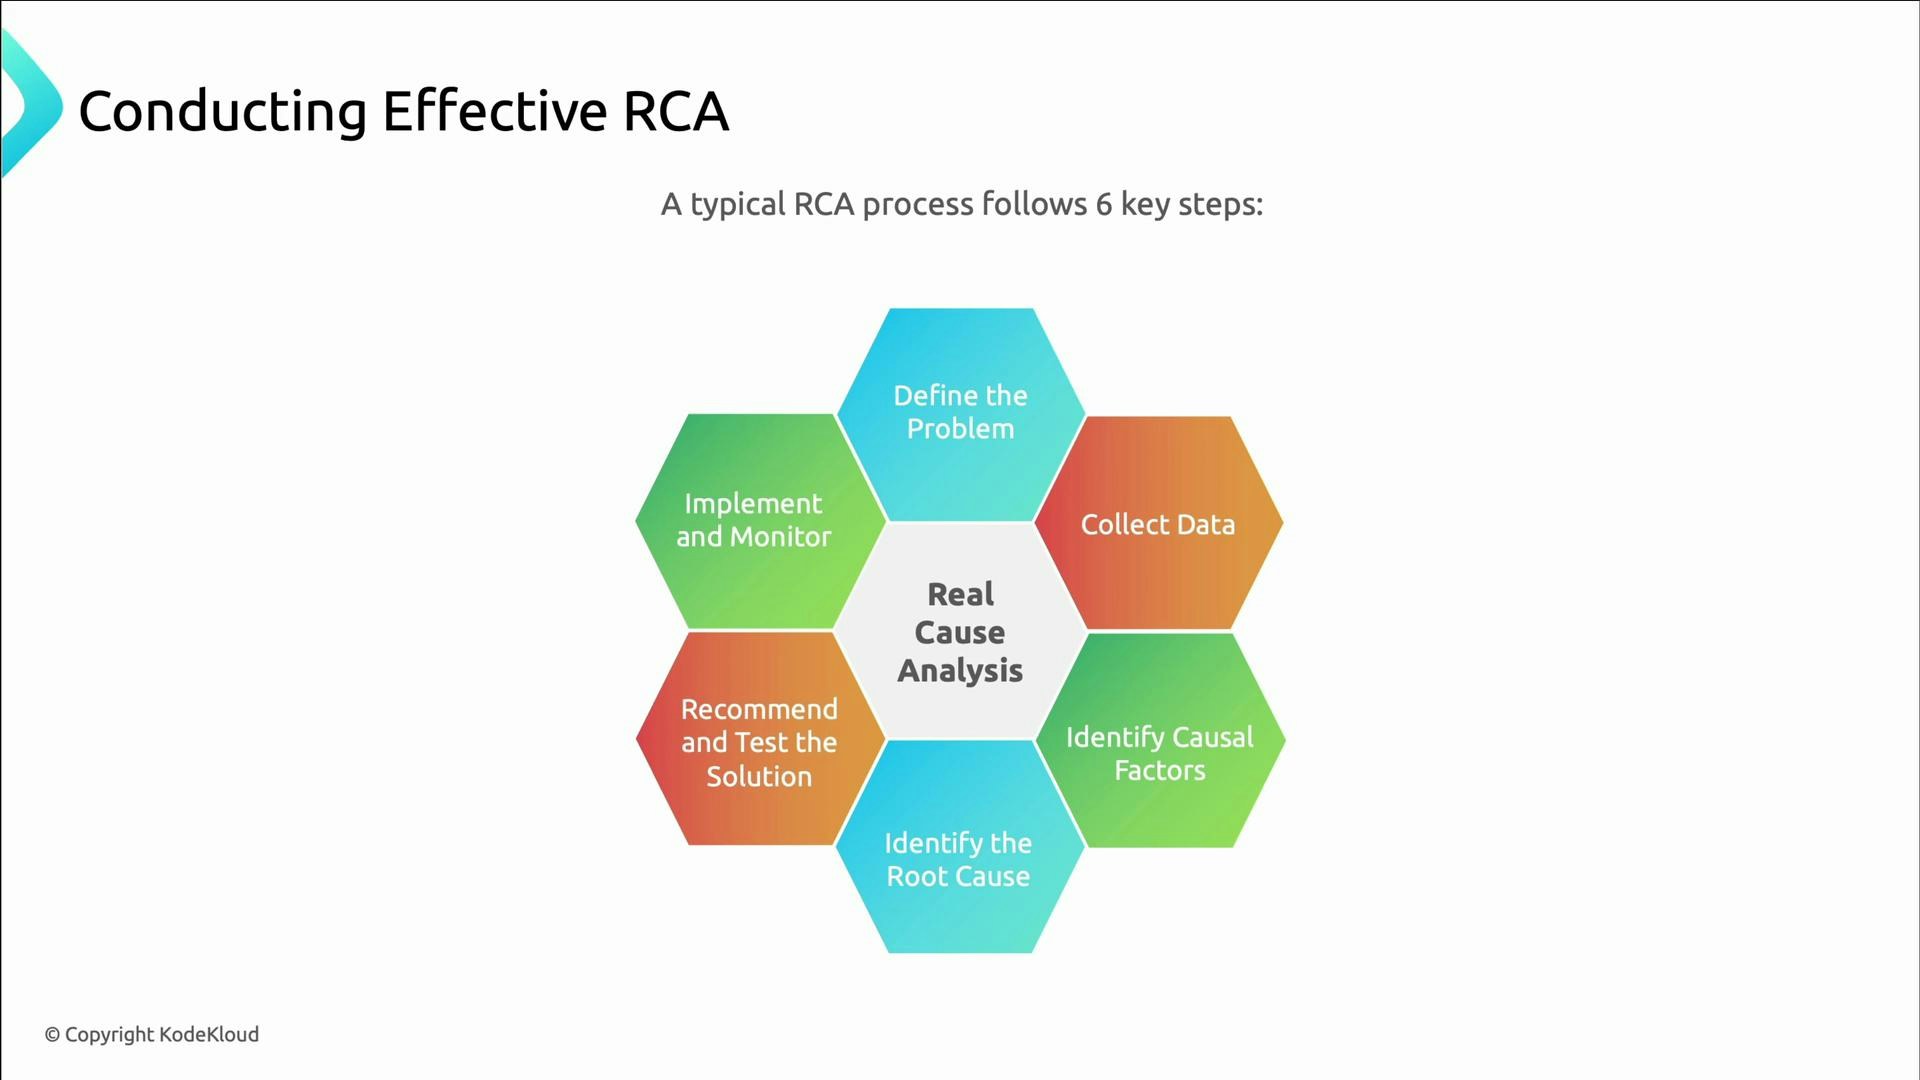
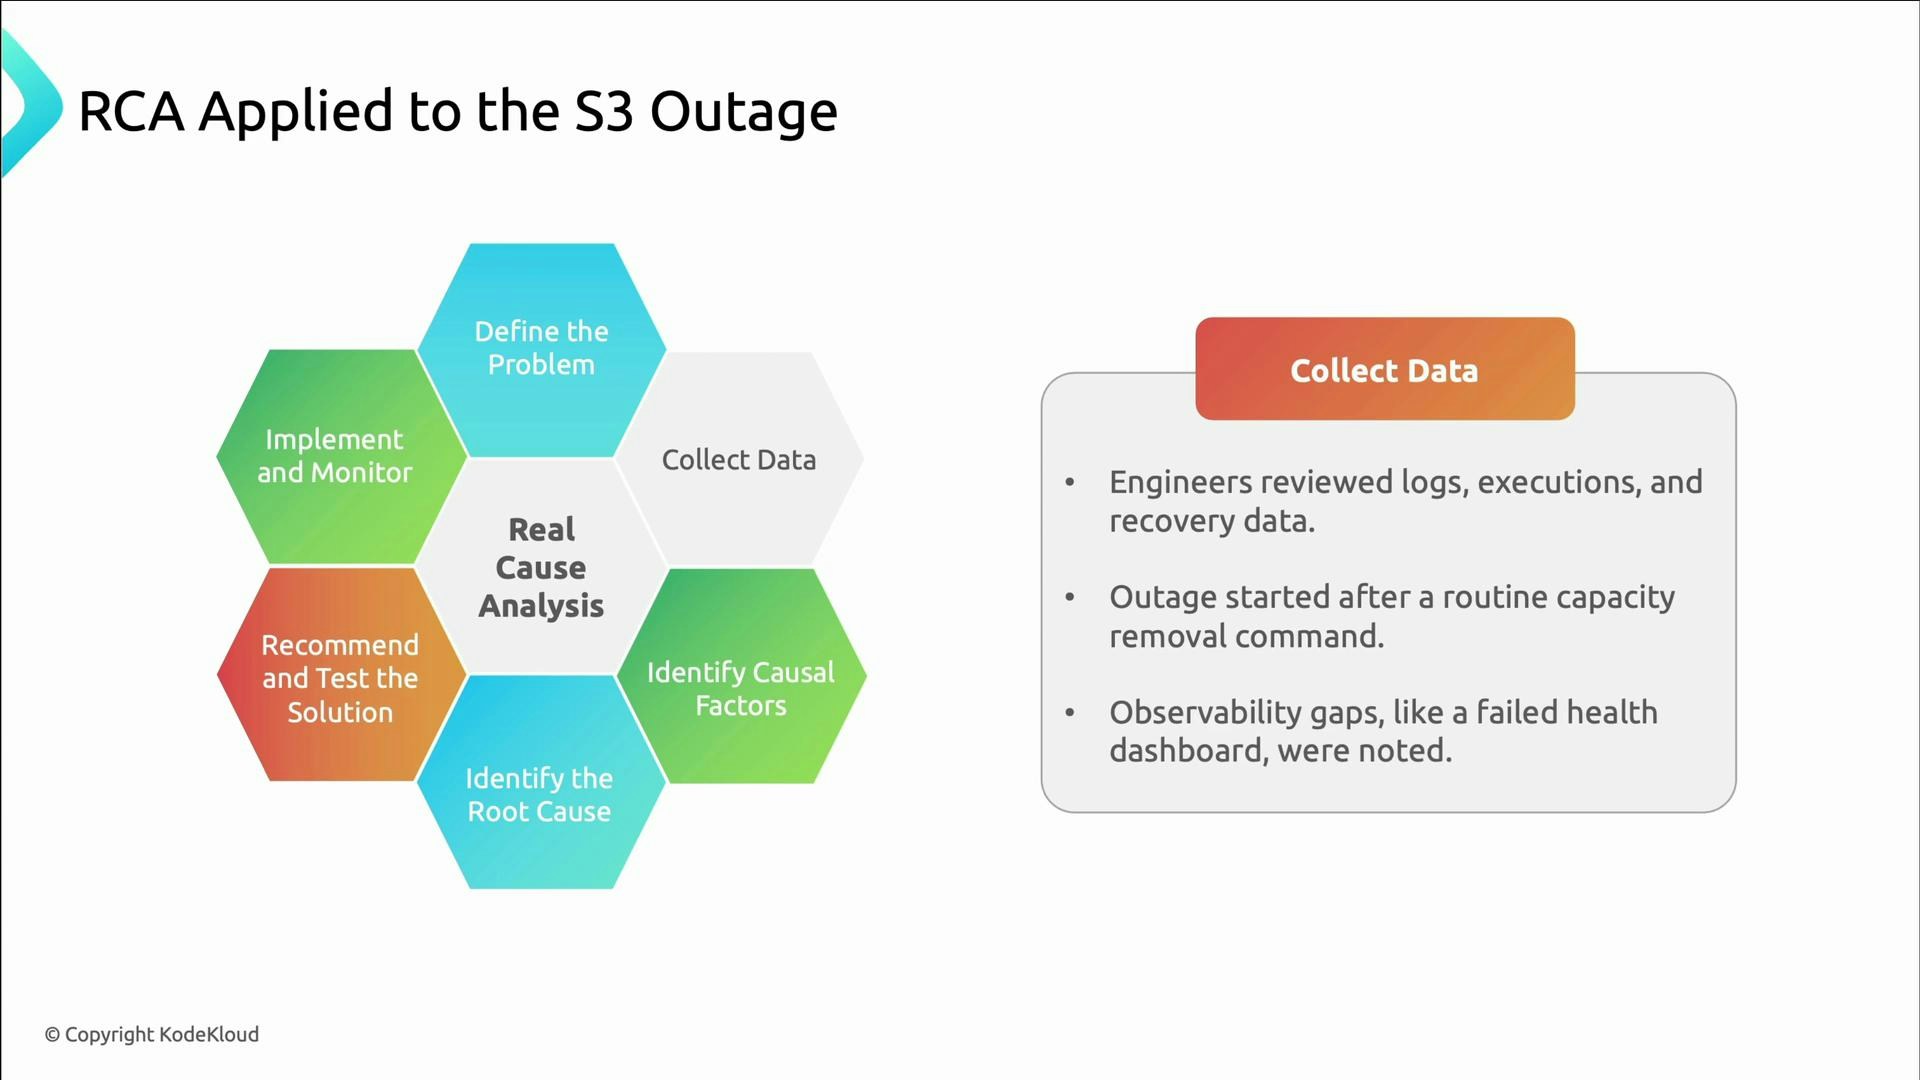
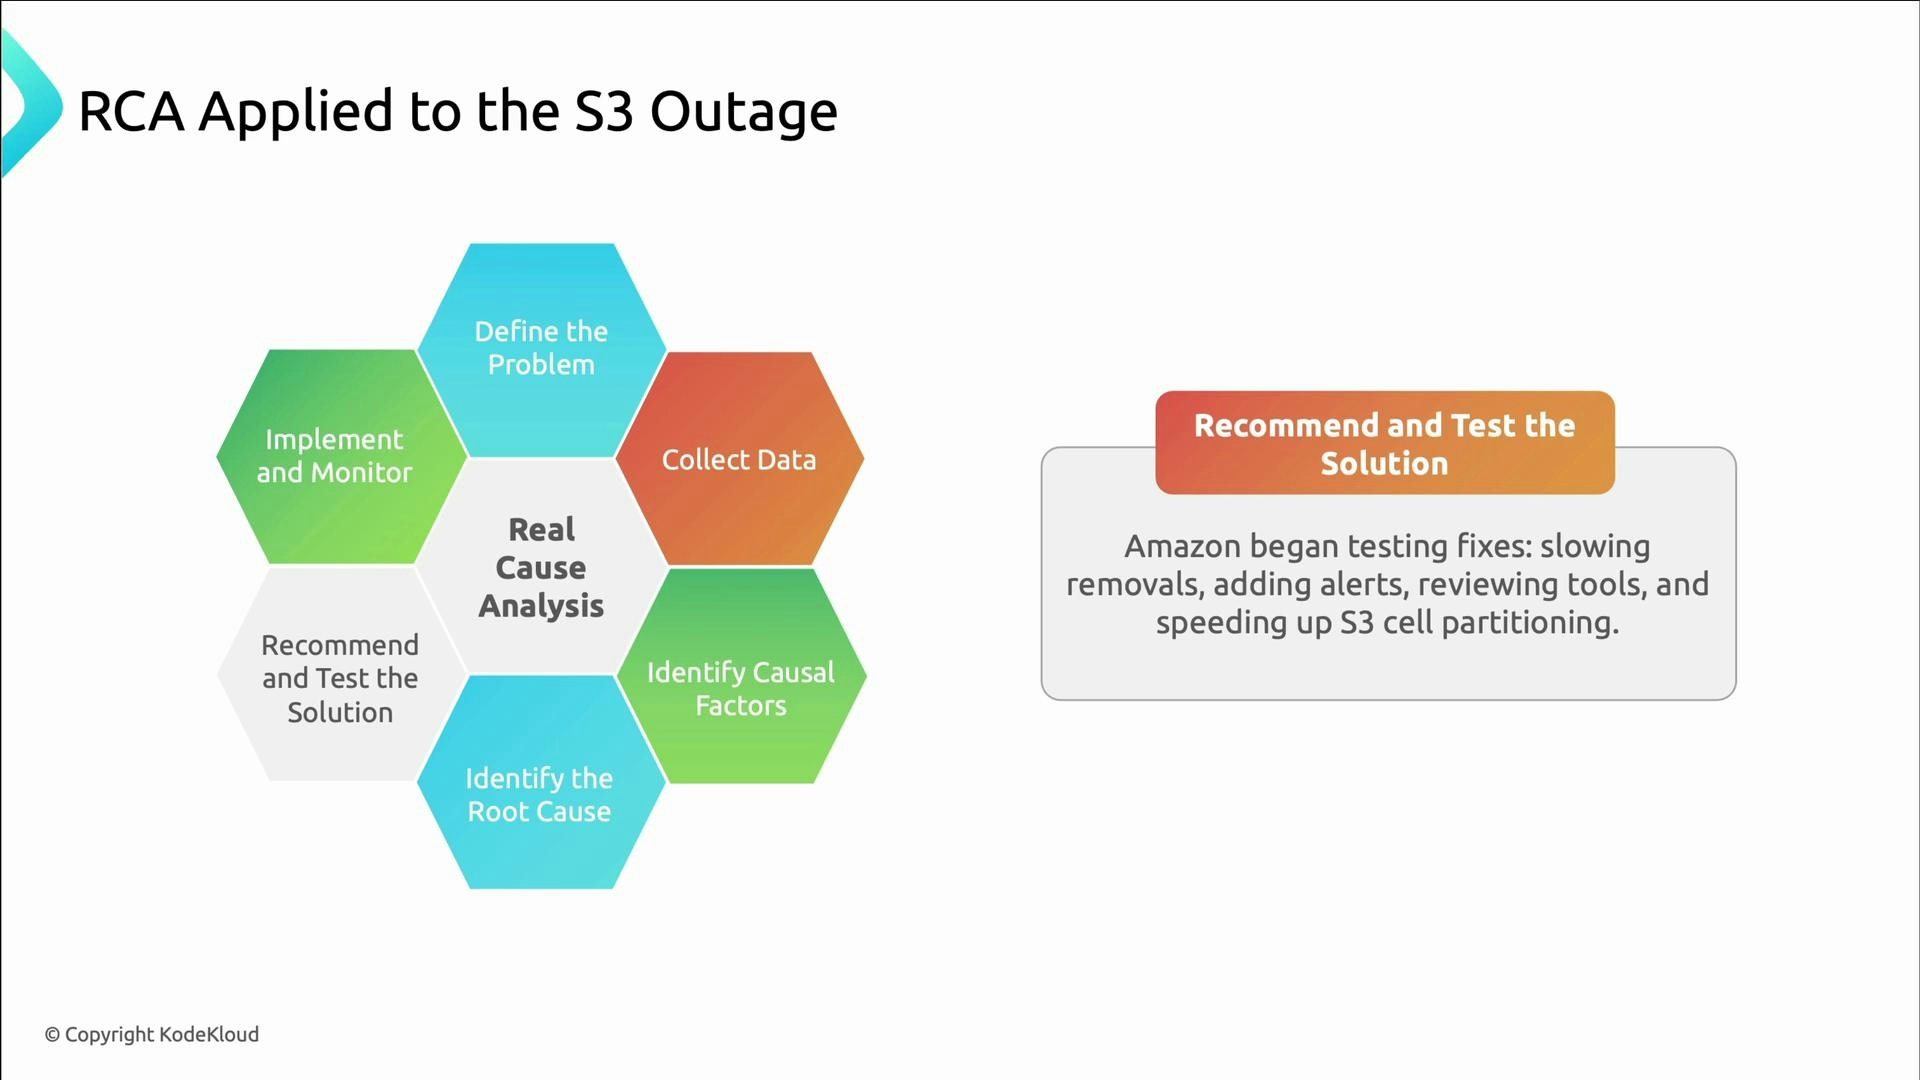
  1. Define the problem clearly.
  2. Collect relevant data.
  3. Identify causal factors.
  4. Determine the root causes.
  5. Recommend and test solutions.
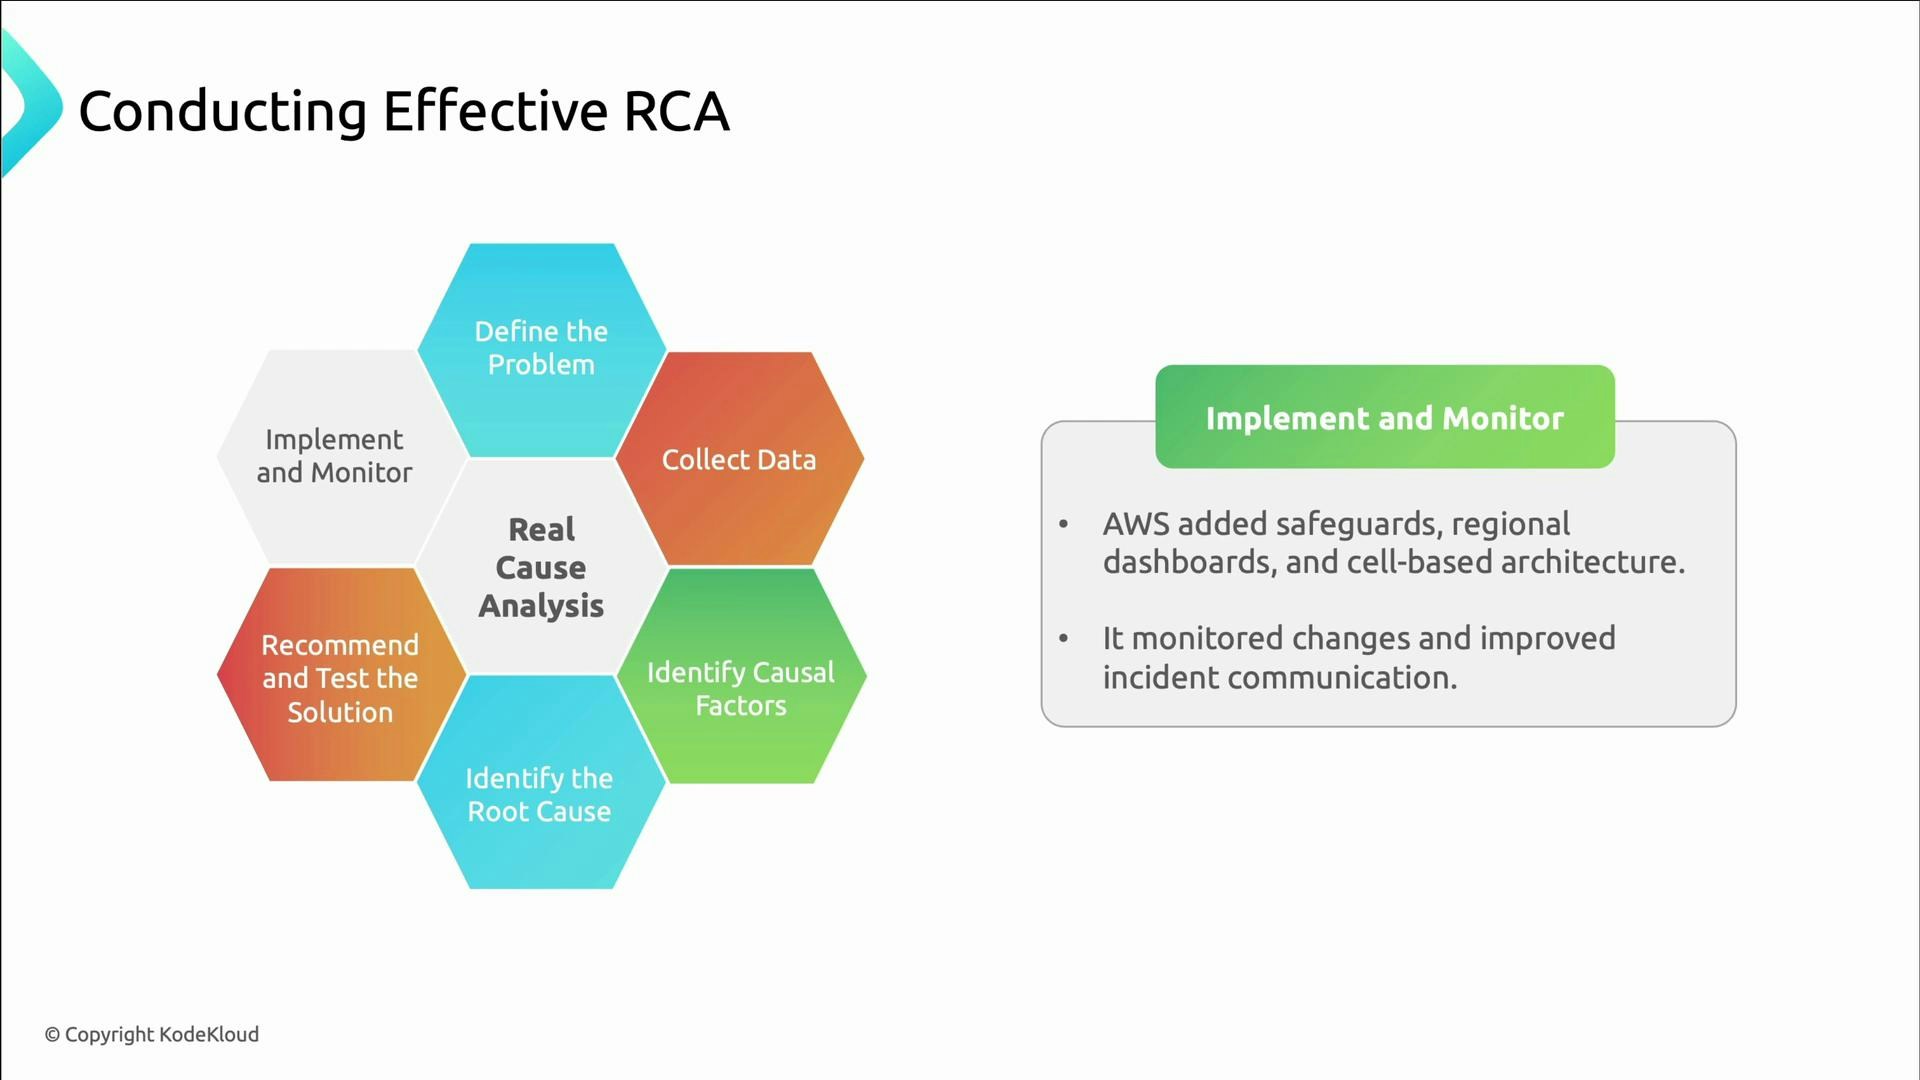
  6. Implement solutions and monitor results.
StepPurposeExample artifact
Define the problemScope the incident preciselyIncident timeline and impact statement
Collect dataGather logs, metrics, execution historyAggregated logs, dashboards, runbooks
Identify causal factorsMap what directly led to the symptomCausal chain, timeline
Determine root causesAsk why those factors existedRoot cause statements
Recommend & testPropose mitigations and validate themTest plans, experiments
Implement & monitorDeploy fixes and measure effectivenessDashboards, post-deployment checks
A slide titled "Conducting Effective RCA" showing a hexagonal diagram of a six-step root cause analysis process. The center reads "Real Cause Analysis" and the surrounding steps are Define the Problem, Collect Data, Identify Causal Factors, Identify the Root Cause, Recommend and Test the Solution, and Implement and Monitor.
Applying the six steps to the S3 outage (high level):
  • Define the problem: In US‑East‑1, S3 failed to service GET/PUT/LIST operations, disrupting many AWS services for hours.
  • Collect data: Engineers reviewed logs, execution histories, and recovery timelines; they traced the outage to a routine capacity-removal command and found observability gaps (the S3 dashboard also failed).
  • Identify causal factors: Too many servers were removed at once, and safeguards that would limit impact were missing.
  • Determine root causes and recommend fixes (examples follow), test mitigations, then deploy changes and monitor outcomes.
A presentation slide titled "RCA Applied to the S3 Outage" showing a hexagonal flowchart of Real Cause Analysis steps (Define the Problem, Collect Data, Identify Causal Factors, Identify the Root Cause, Recommend and Test the Solution, Implement and Monitor). To the right is a "Collect Data" panel with bullets noting engineers reviewed logs and recovery data, the outage started after a routine capacity removal command, and observability gaps were found.
Techniques to discover causal factors
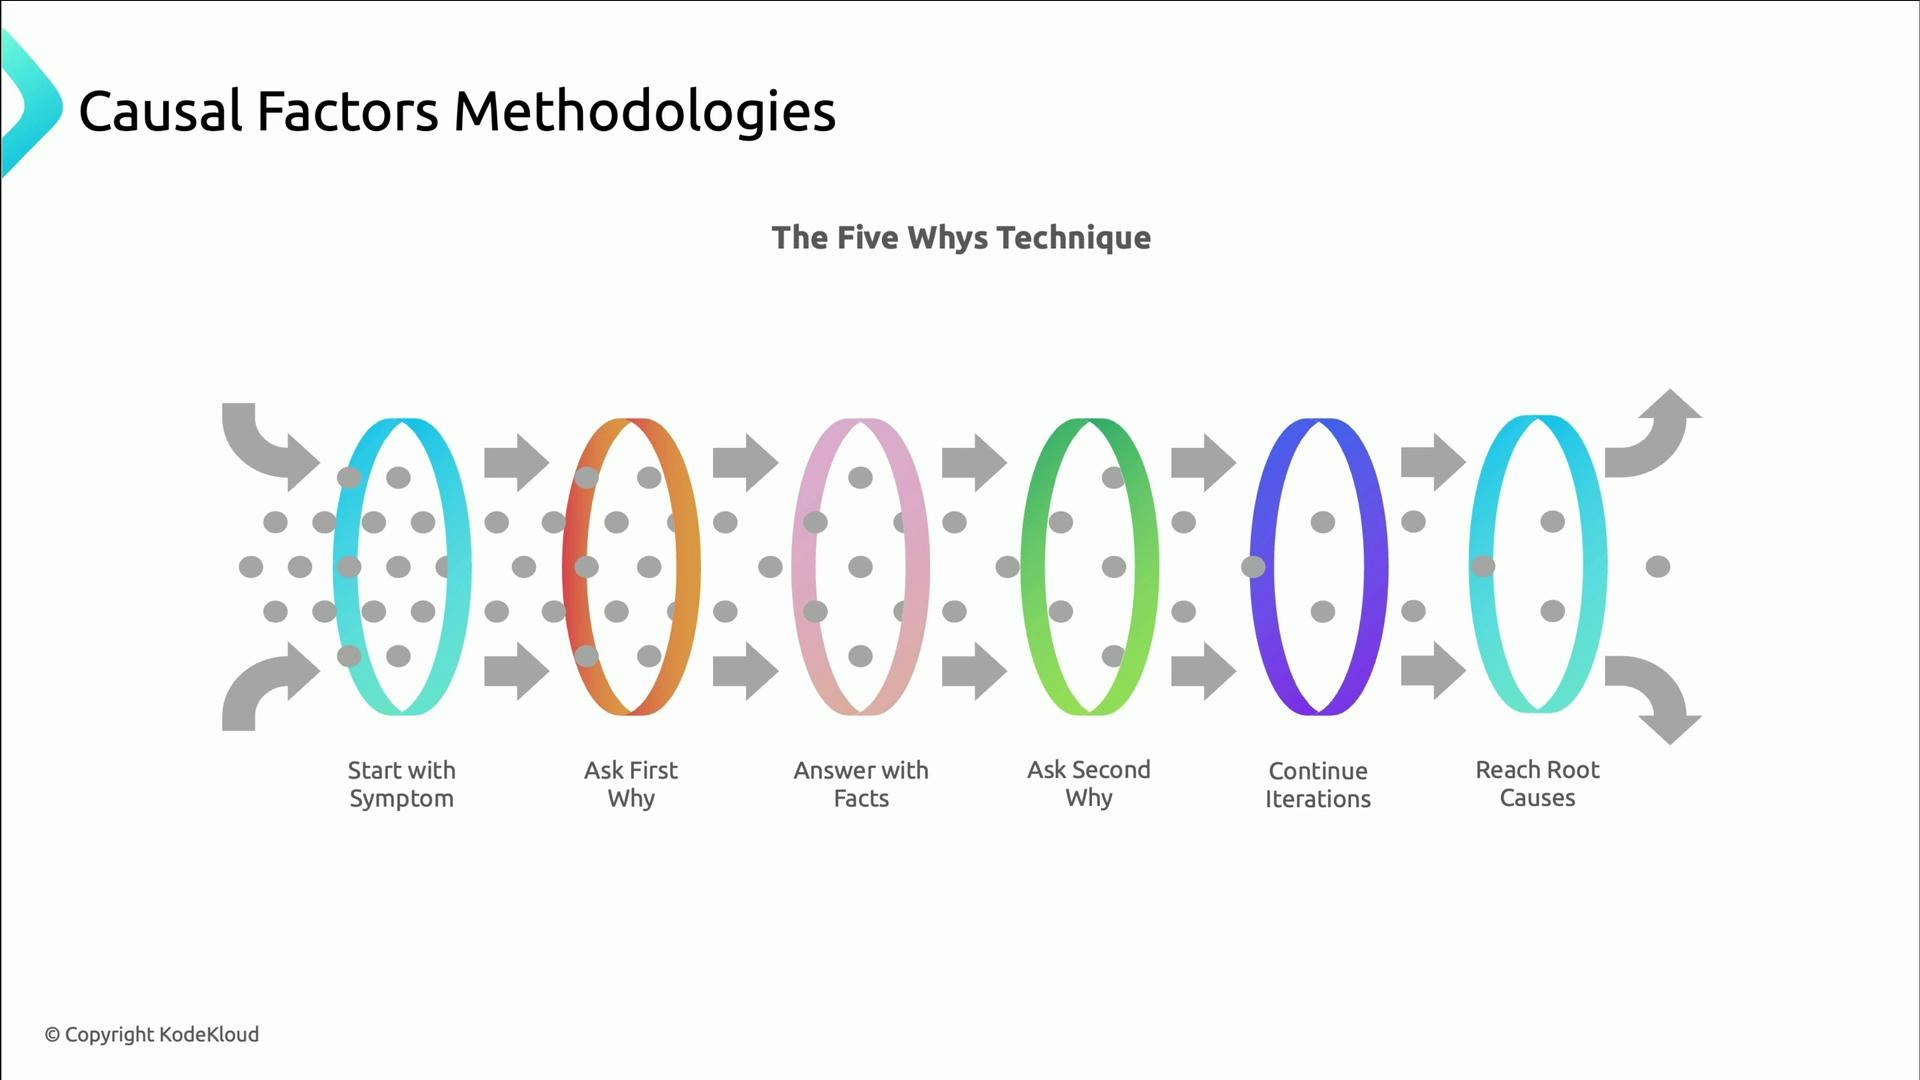
  • Five Whys: repeatedly ask “why” to move from symptom to deeper causes. The goal is to reach actionable root causes; the number five is a guideline, not a rule.
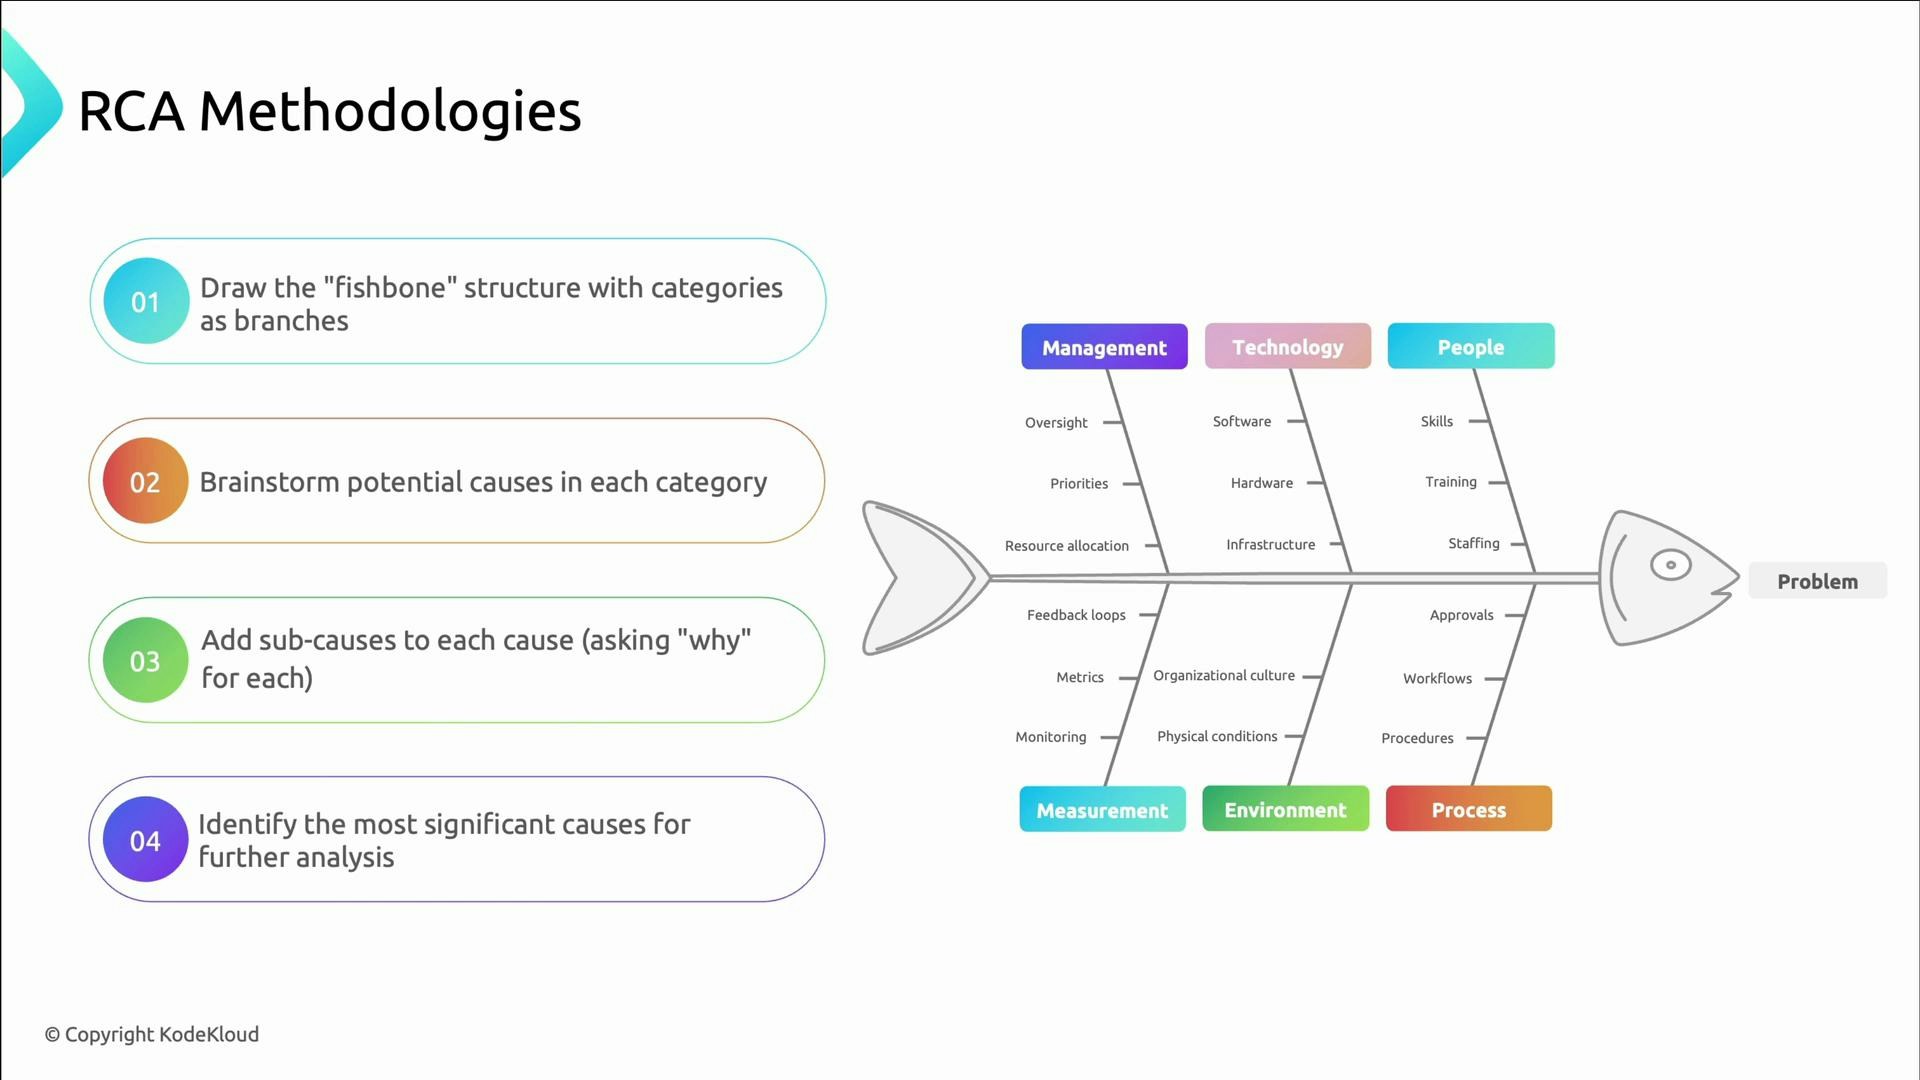
  • Fishbone (Ishikawa) diagrams: structure brainstorming into categories (People, Process, Tools/Technology, Environment, Measurement) to avoid tunnel vision and ensure broad analysis.
A slide titled "Causal Factors Methodologies" illustrating the Five Whys technique as a sequence of colored filter-like ovals and arrows. Each stage is labeled (Start with Symptom, Ask First Why, Answer with Facts, Ask Second Why, Continue Iterations, Reach Root Causes) showing dots passing through toward root causes.
Example — Five Whys applied to a website outage:
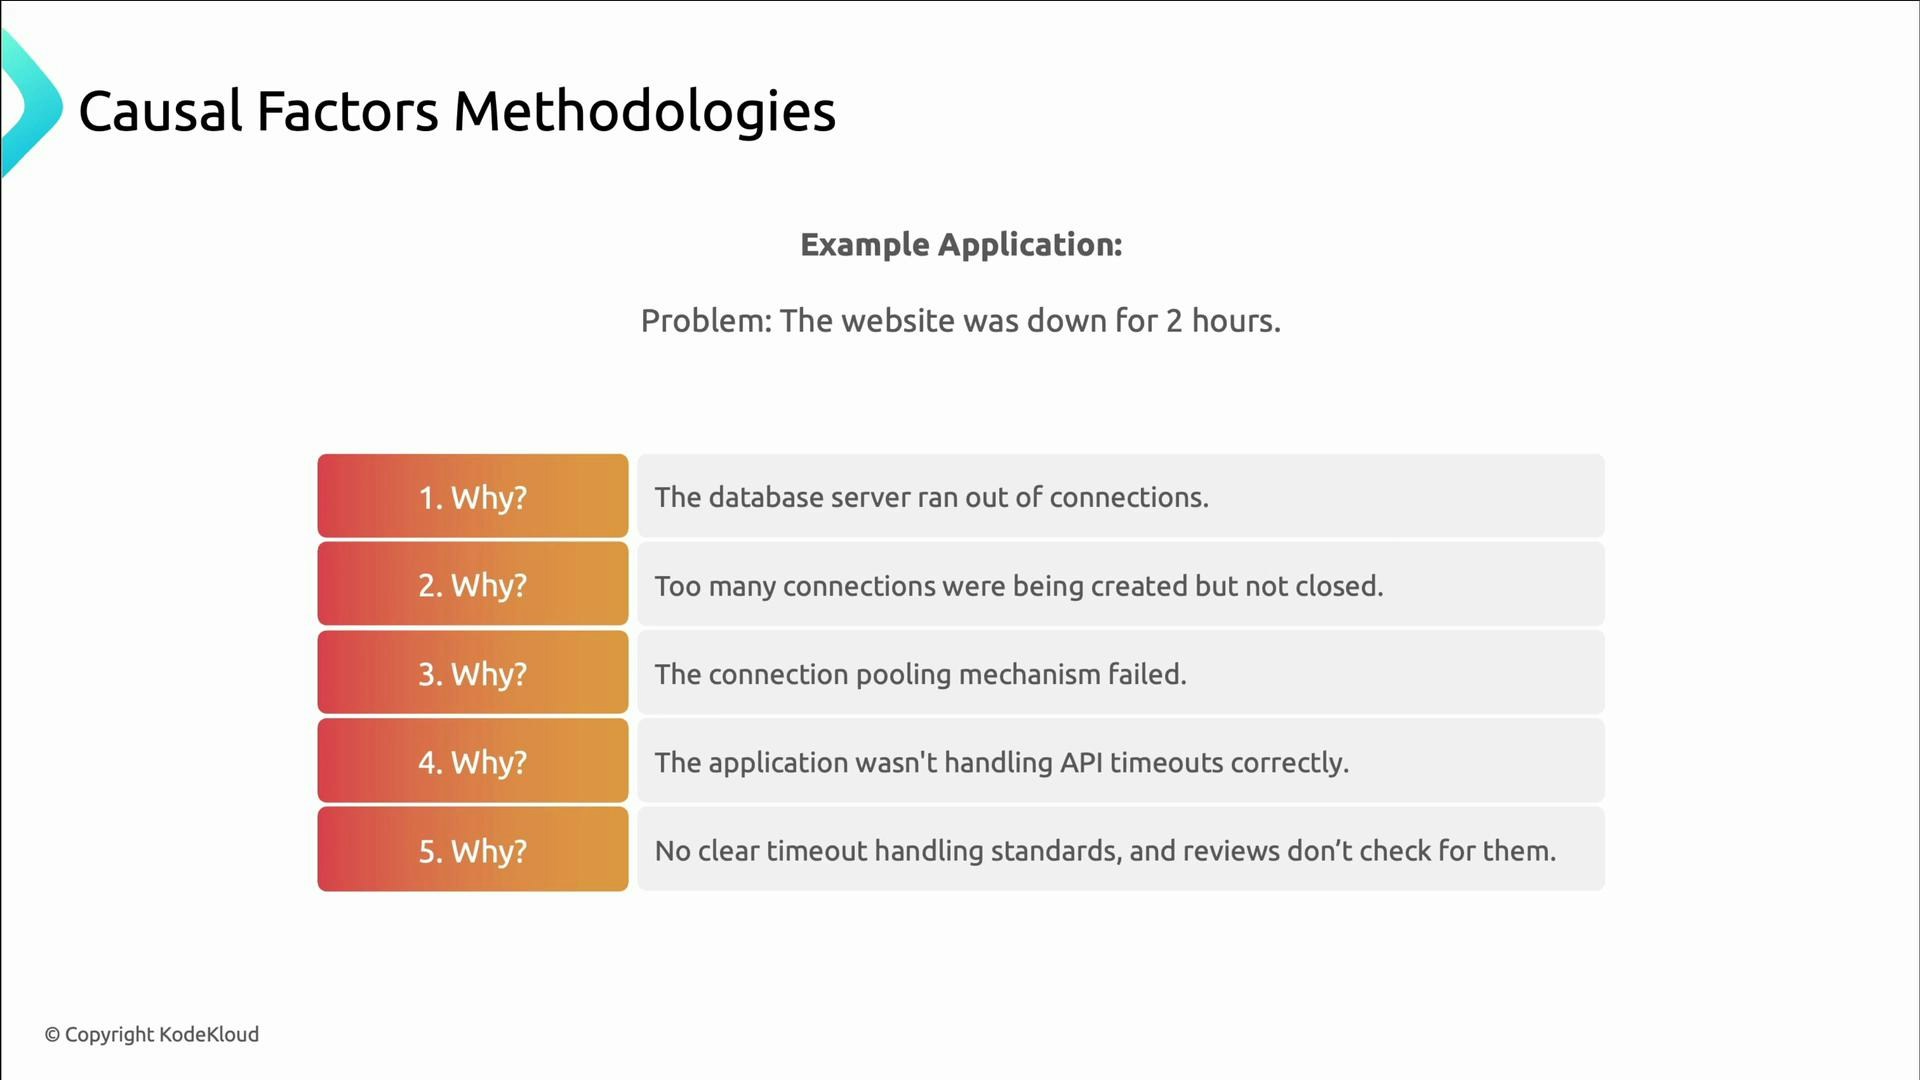
  • Symptom: Website down for two hours.
  • Why 1: Database server ran out of connections.
  • Why 2: Too many connections were created and not closed.
  • Why 3: The connection pooling mechanism failed.
  • Why 4: Timeouts weren’t properly handled in the codebase.
  • Why 5: No coding standards for timeout handling and code reviews didn’t check for them.
Actionable fixes that come from this chain: update error‑handling standards, add timeout checks to code reviews, and implement connection-pool monitoring with alerts.
A slide titled "Causal Factors Methodologies" showing an example problem: "The website was down for 2 hours." It lists a 5‑Whys chain from "the database server ran out of connections" down to the root cause "no clear timeout handling standards, and reviews don’t check for them."
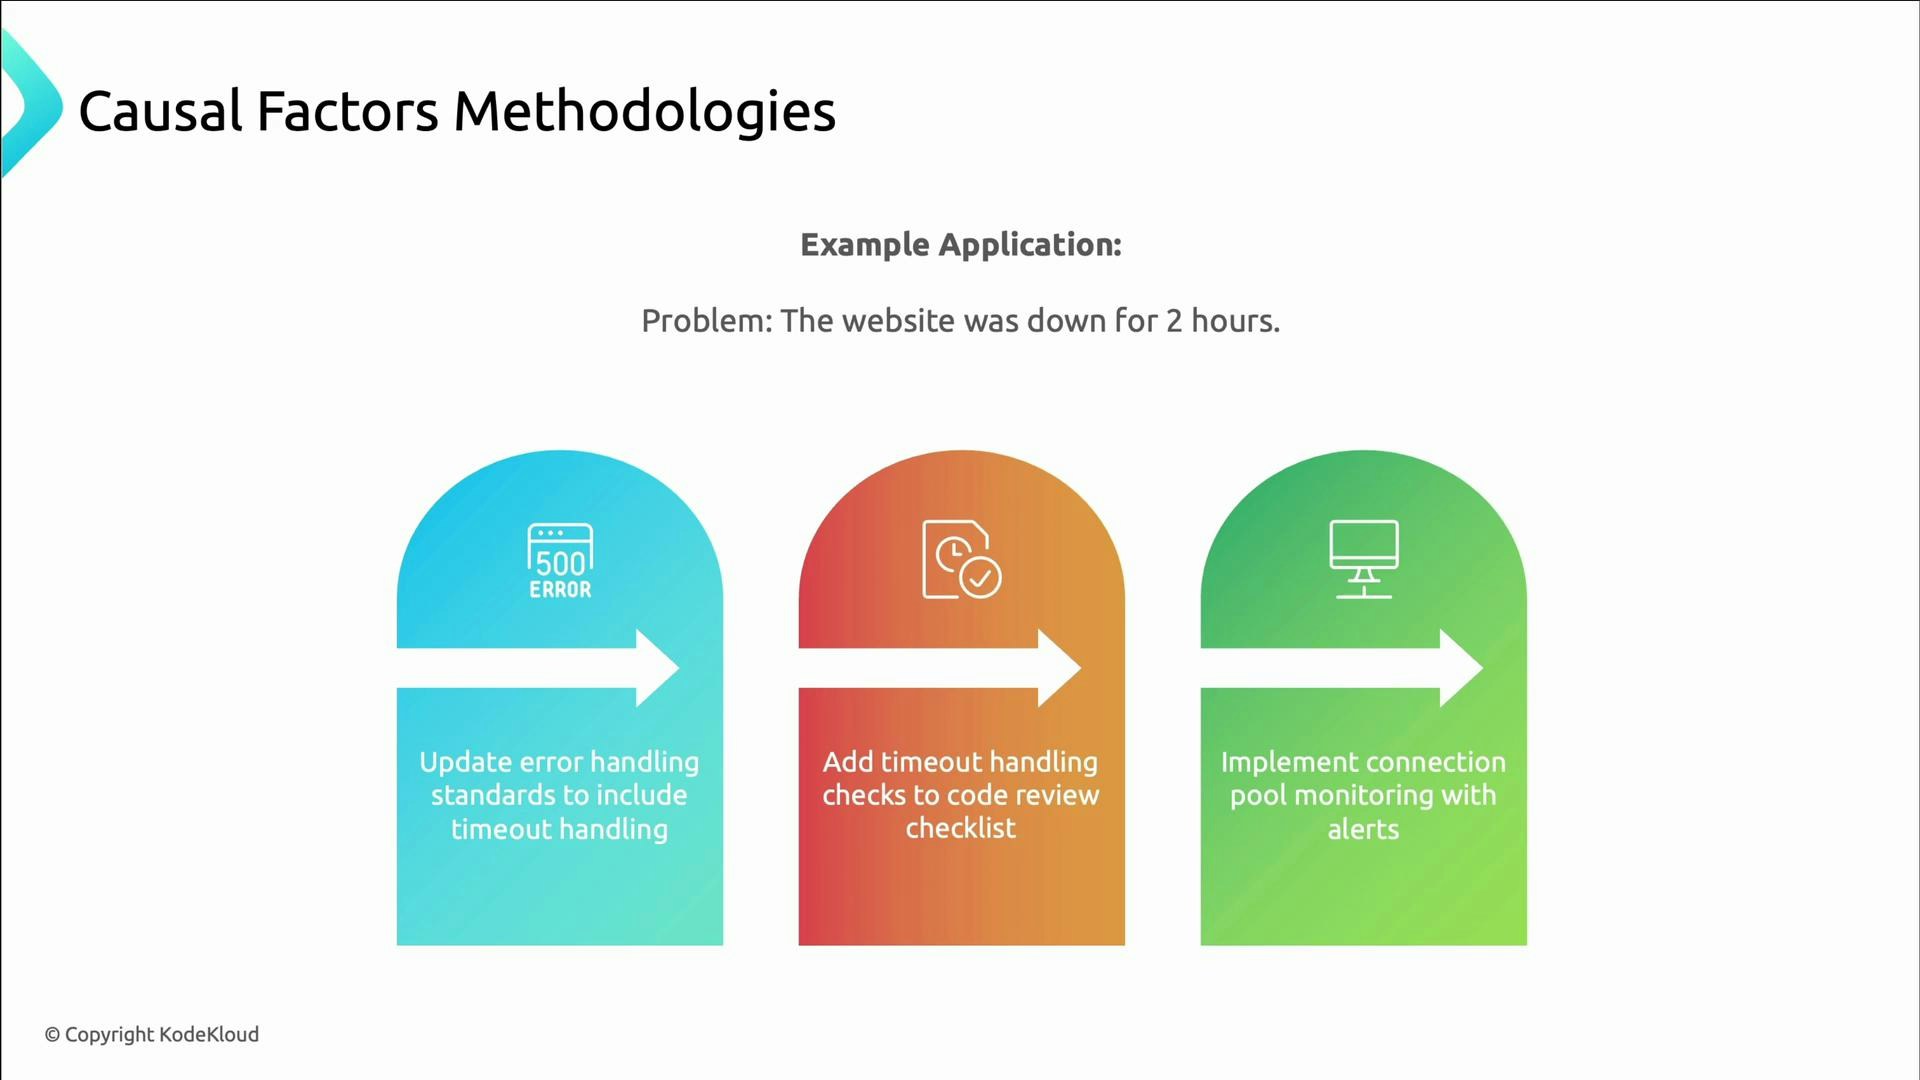
Good RCAs produce actionable, testable recommendations — not vague platitudes. Each action should measurably reduce either the probability or the impact of the failure mode you identified.
Example action items (from the website outage):
  • Update error-handling standards to include timeouts.
  • Add timeout checks to the code-review checklist.
  • Implement connection-pool monitoring with alerts.
A presentation slide titled "Causal Factors Methodologies" showing an example application where a website was down for two hours. It uses three colored panels with arrows listing fixes: update error handling to include timeouts, add timeout checks to code review, and implement connection-pool monitoring with alerts.
Ishikawa (fishbone) diagrams
  • Use main branches such as People, Process, Technology, Environment, and Measurement.
  • Brainstorm causes under each branch, keep asking why to reveal sub-causes, then prioritize the most significant contributors for investigation and mitigation.
A slide titled "RCA Methodologies" listing four numbered steps for creating a fishbone (Ishikawa) diagram. On the right is a fishbone diagram with branches labeled Management, Technology, People, Measurement, Environment, and Process pointing to a "Problem" head.
Back to the S3 outage: the root causes were a combination of human error (an incorrect command) and inadequate tooling and guardrails. The command removed critical capacity and triggered cascading failures because the system lacked containment mechanisms. Identifying both the immediate human action and the missing safeguards let Amazon prioritize fixes that reduced recurrence. After identifying causes, recommend and test solutions. Example mitigations for S3 included slowing capacity removals, adding alerts and safety checks, reviewing operational tools, improving observability, and accelerating a cell‑based partitioning architecture to limit blast radius. Testing these mitigations is essential to validate that they address root causes rather than just symptoms.
A presentation slide titled "RCA Applied to the S3 Outage" showing a hexagonal diagram of real cause analysis steps (define the problem, collect data, identify causal factors/root cause, recommend and implement). A callout box summarizes recommended fixes Amazon tested: slowing removals, adding alerts, reviewing tools, and speeding up S3 cell partitioning.
Action-item quality matters. Vague tasks rarely produce measurable improvement. Use SMART-like criteria: specific, measurable, owned, realistic, time‑bound, and verifiable.
Poor action itemBetter action item
“Improve monitoring.”“Implement connection-pool monitoring with alerts at 80% utilization by 2023-03-15; owner: Jane.”
“Write better code.”“Create and implement timeout-handling standards for all API calls by end of Q2; owner: development team.”
A presentation slide titled "Beyond the Obvious" showing a two-column table of "Poor" vs "Better" action items. It contrasts vague tasks like "Improve monitoring" and "Write better code" with specific, measurable actions that include deadlines and owners.
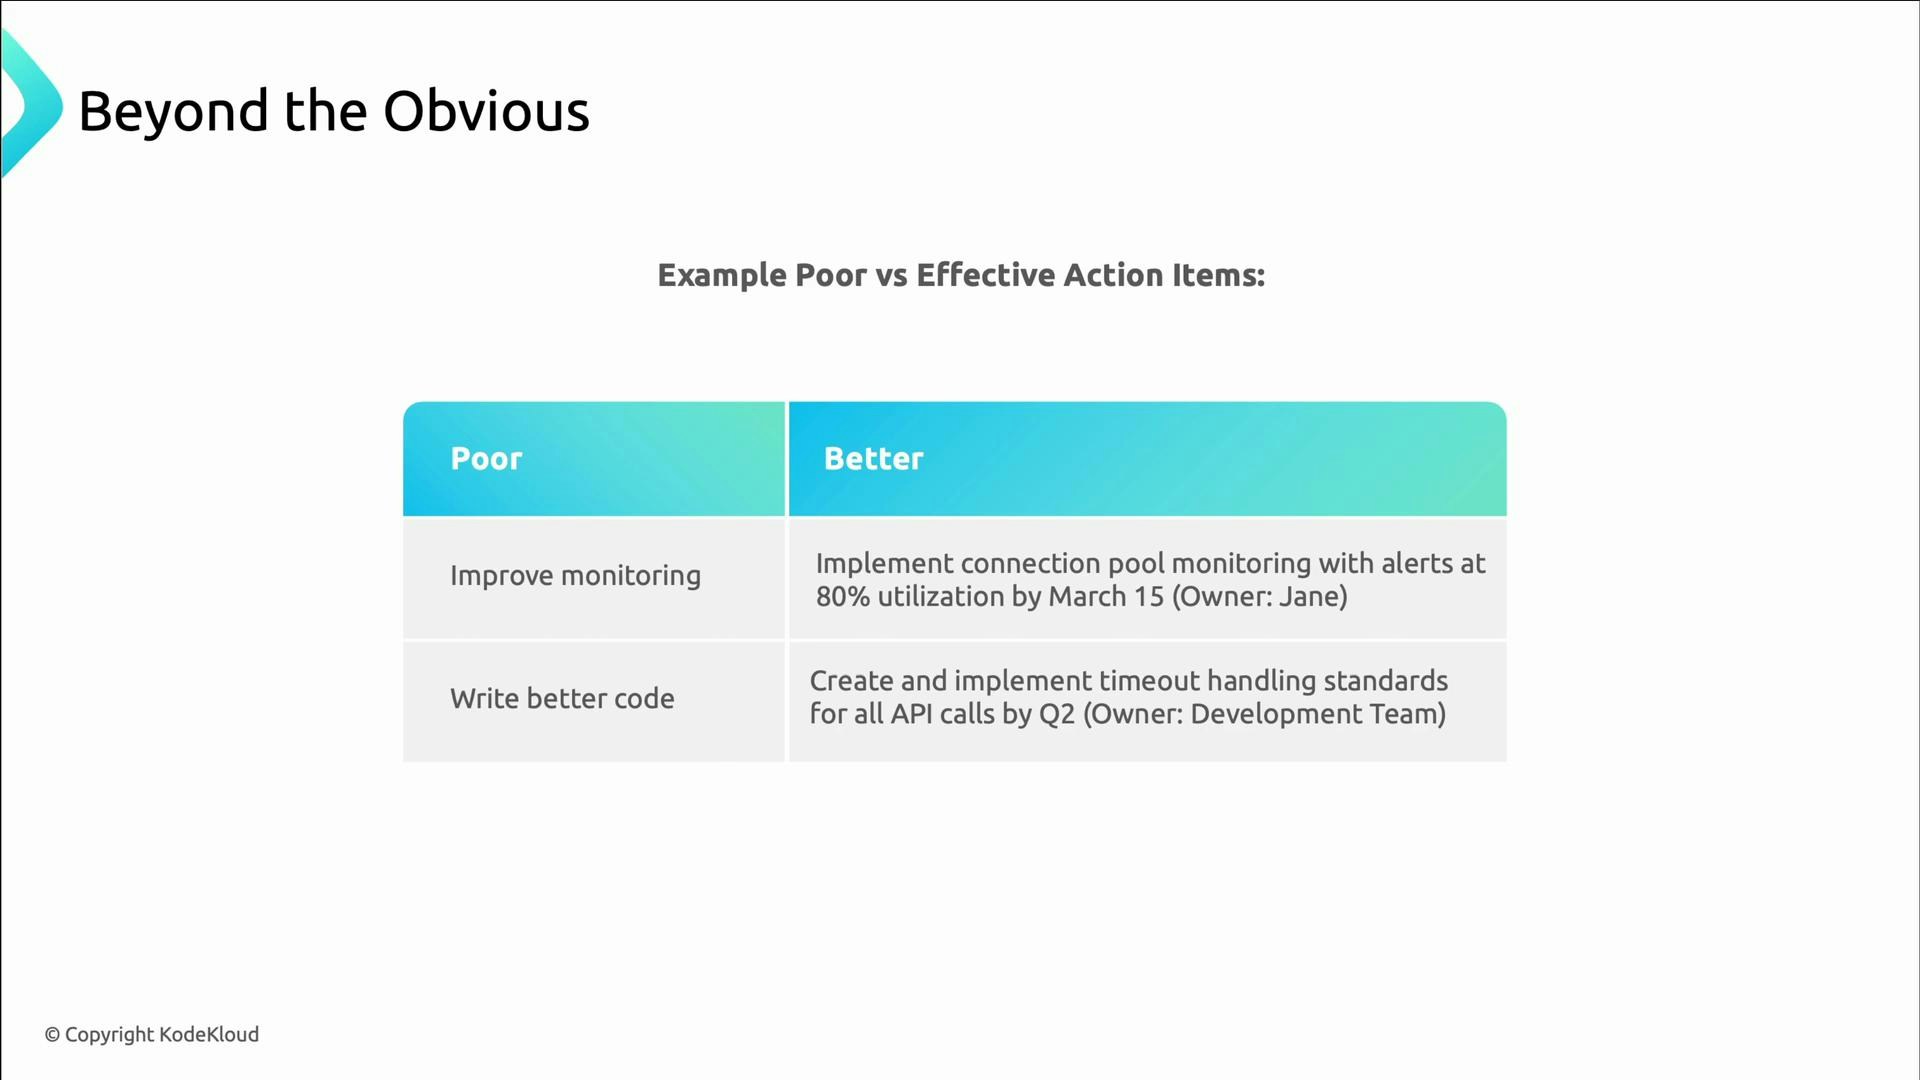
Avoid vague, unverifiable action items. Without an owner, deadline, and success criteria, an action item will likely never produce measurable improvement.
Implementing and monitoring close the loop
  • Deploy mitigations, then measure their effectiveness using new or updated observability.
  • Iterate: if a mitigation doesn’t reduce risk as expected, revisit the causal analysis and refine the solution.
  • AWS’s follow-up to the S3 outage included rolling out safeguards, distributing the health dashboard across regions, adopting cell partitioning, and improving incident communication — changes that reduced the chance and impact of repeat failures.
A presentation slide titled "Conducting Effective RCA" showing a hexagonal diagram of steps around "Real Cause Analysis" (Define the Problem, Collect Data, Identify Causal Factors, Identify the Root Cause, Recommend and Test the Solution, Implement and Monitor). To the right is a callout labeled "Implement and Monitor" noting AWS safeguards, regional dashboards, and improved incident communication.
Common root causes to watch for
  • Technical patterns: insufficient monitoring, poor capacity planning, missing error handling, silent failures, cascading dependencies without safeguards.
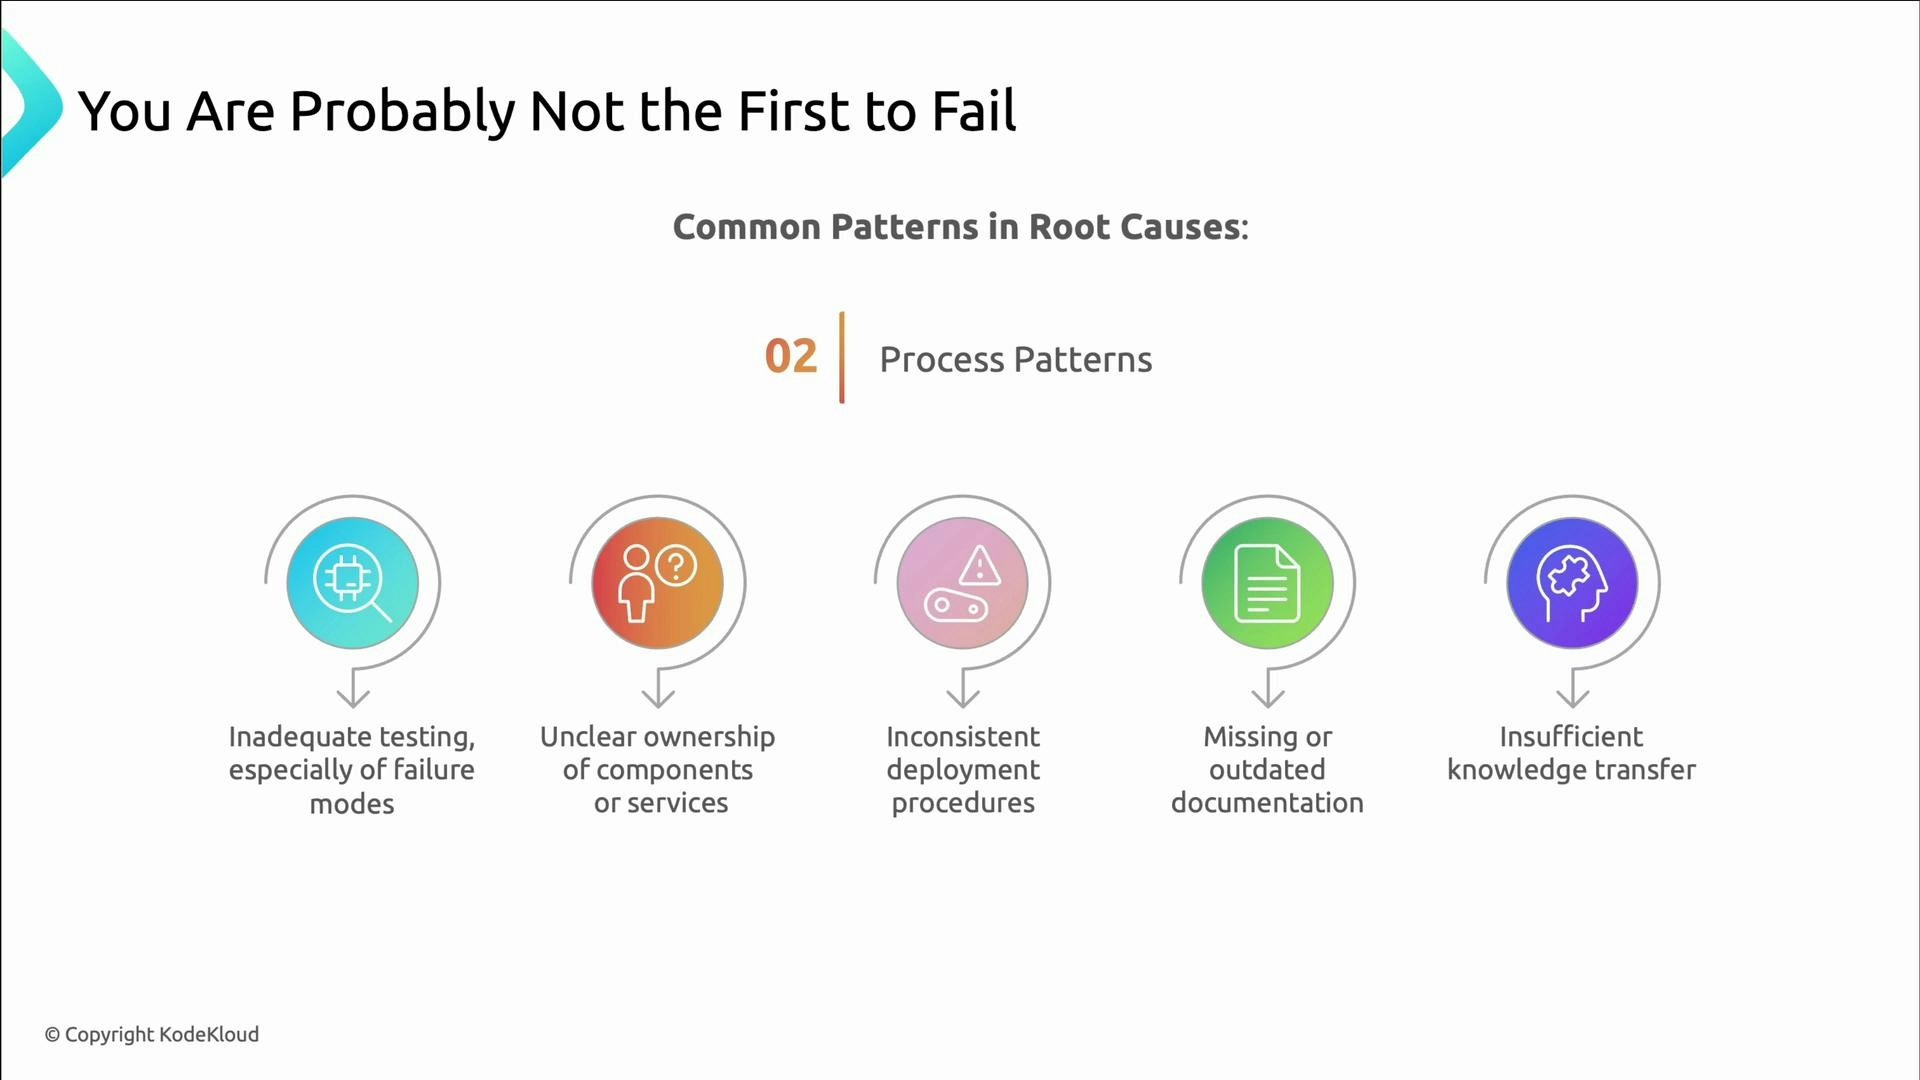
  • Process patterns: inadequate testing of failure modes, unclear service ownership, inconsistent deployment procedures, missing or outdated runbooks, and weak knowledge transfer.
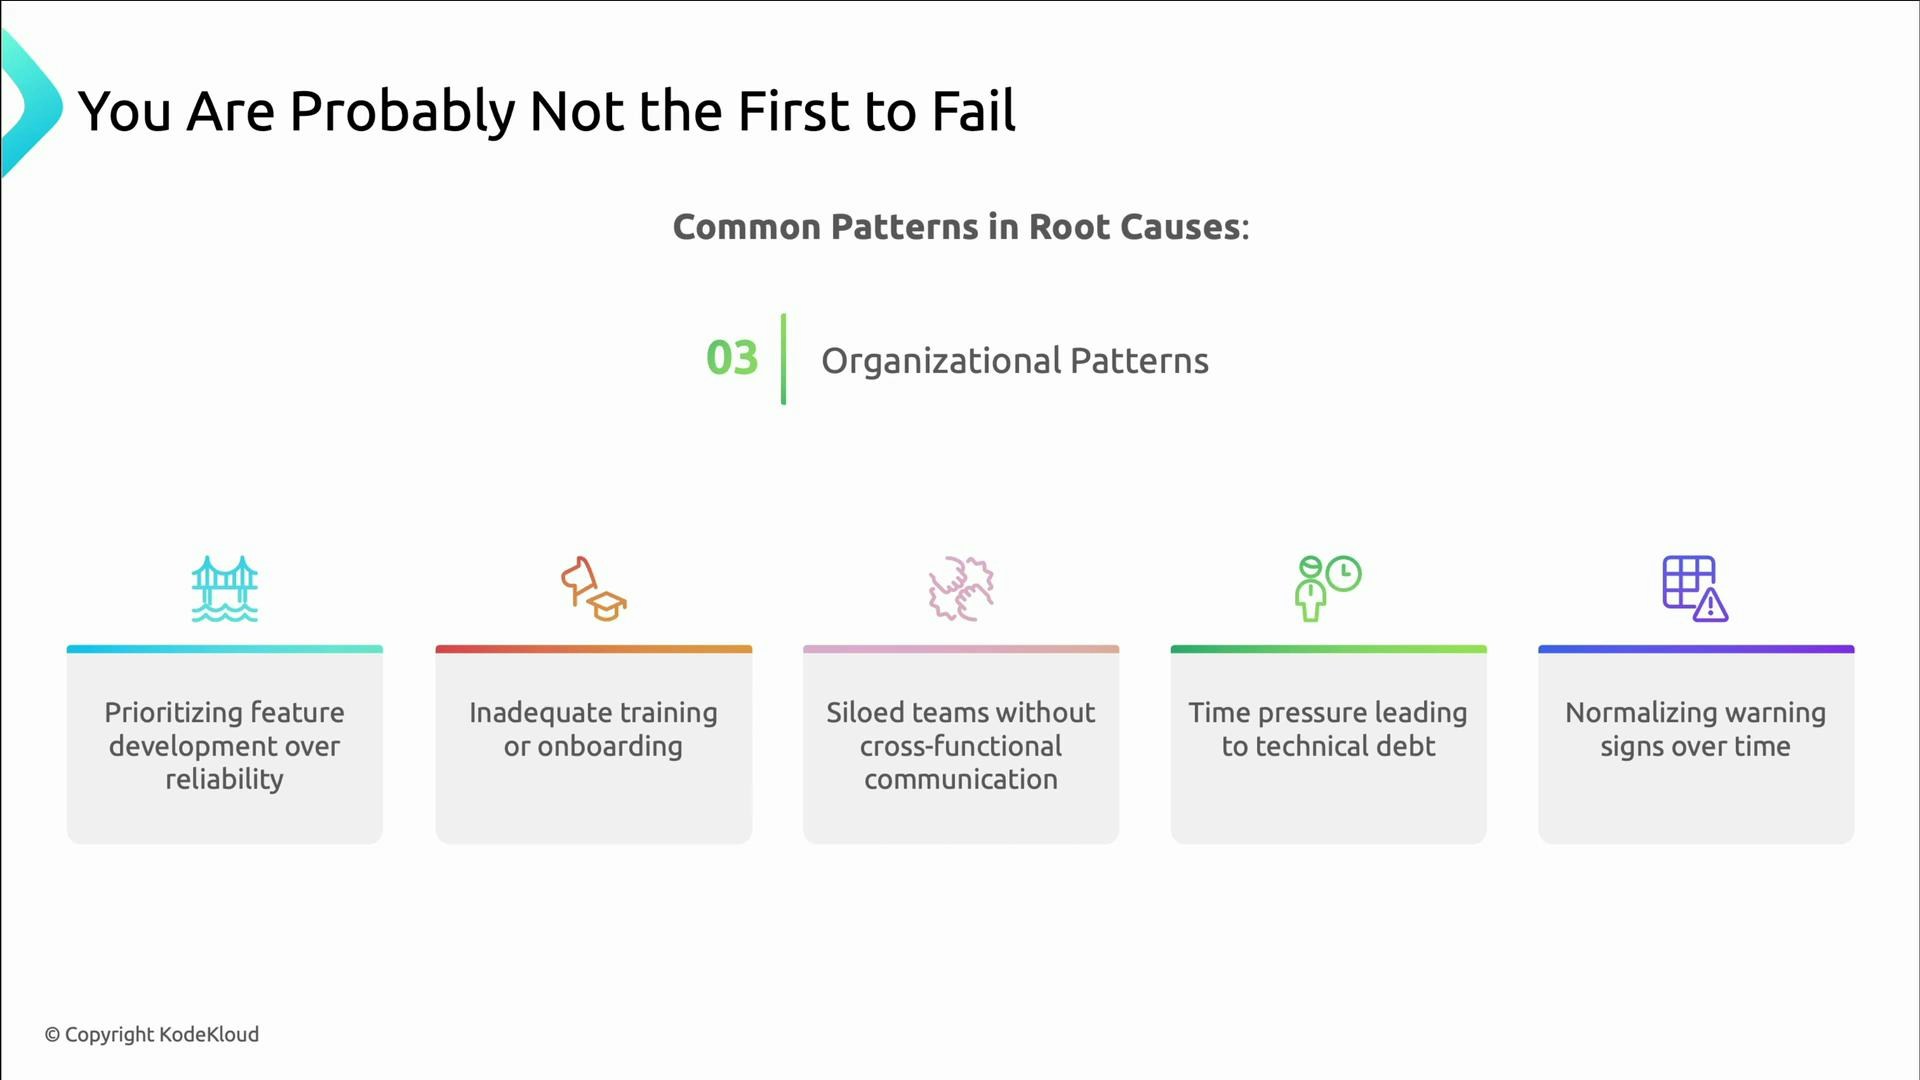
  • Organizational patterns: prioritizing features over reliability, rushed onboarding, siloed teams, time pressure that accumulates technical debt, and normalizing warning signs.
These patterns recur across organizations — learning from others’ failures can help avoid repeating the same mistakes.
A presentation slide titled "You Are Probably Not the First to Fail" showing “Common Patterns in Root Causes — Process Patterns” with five icons and brief items: inadequate testing, unclear ownership, inconsistent deployment procedures, missing or outdated documentation, and insufficient knowledge transfer.
A presentation slide titled “You Are Probably Not to First to Fail” showing "03 Organizational Patterns" and listing common root causes: prioritizing features over reliability, inadequate training/onboarding, siloed teams, time pressure causing technical debt, and normalizing warning signs.
That wraps up this module on Incident Management covering incident response, alerting, preparation, response structures, blameless culture, and Root Cause Analysis. Next, we’ll examine how software delivery practices (CI/CD, testing, and deployment automation) can reduce risk and improve reliability. Further reading and references