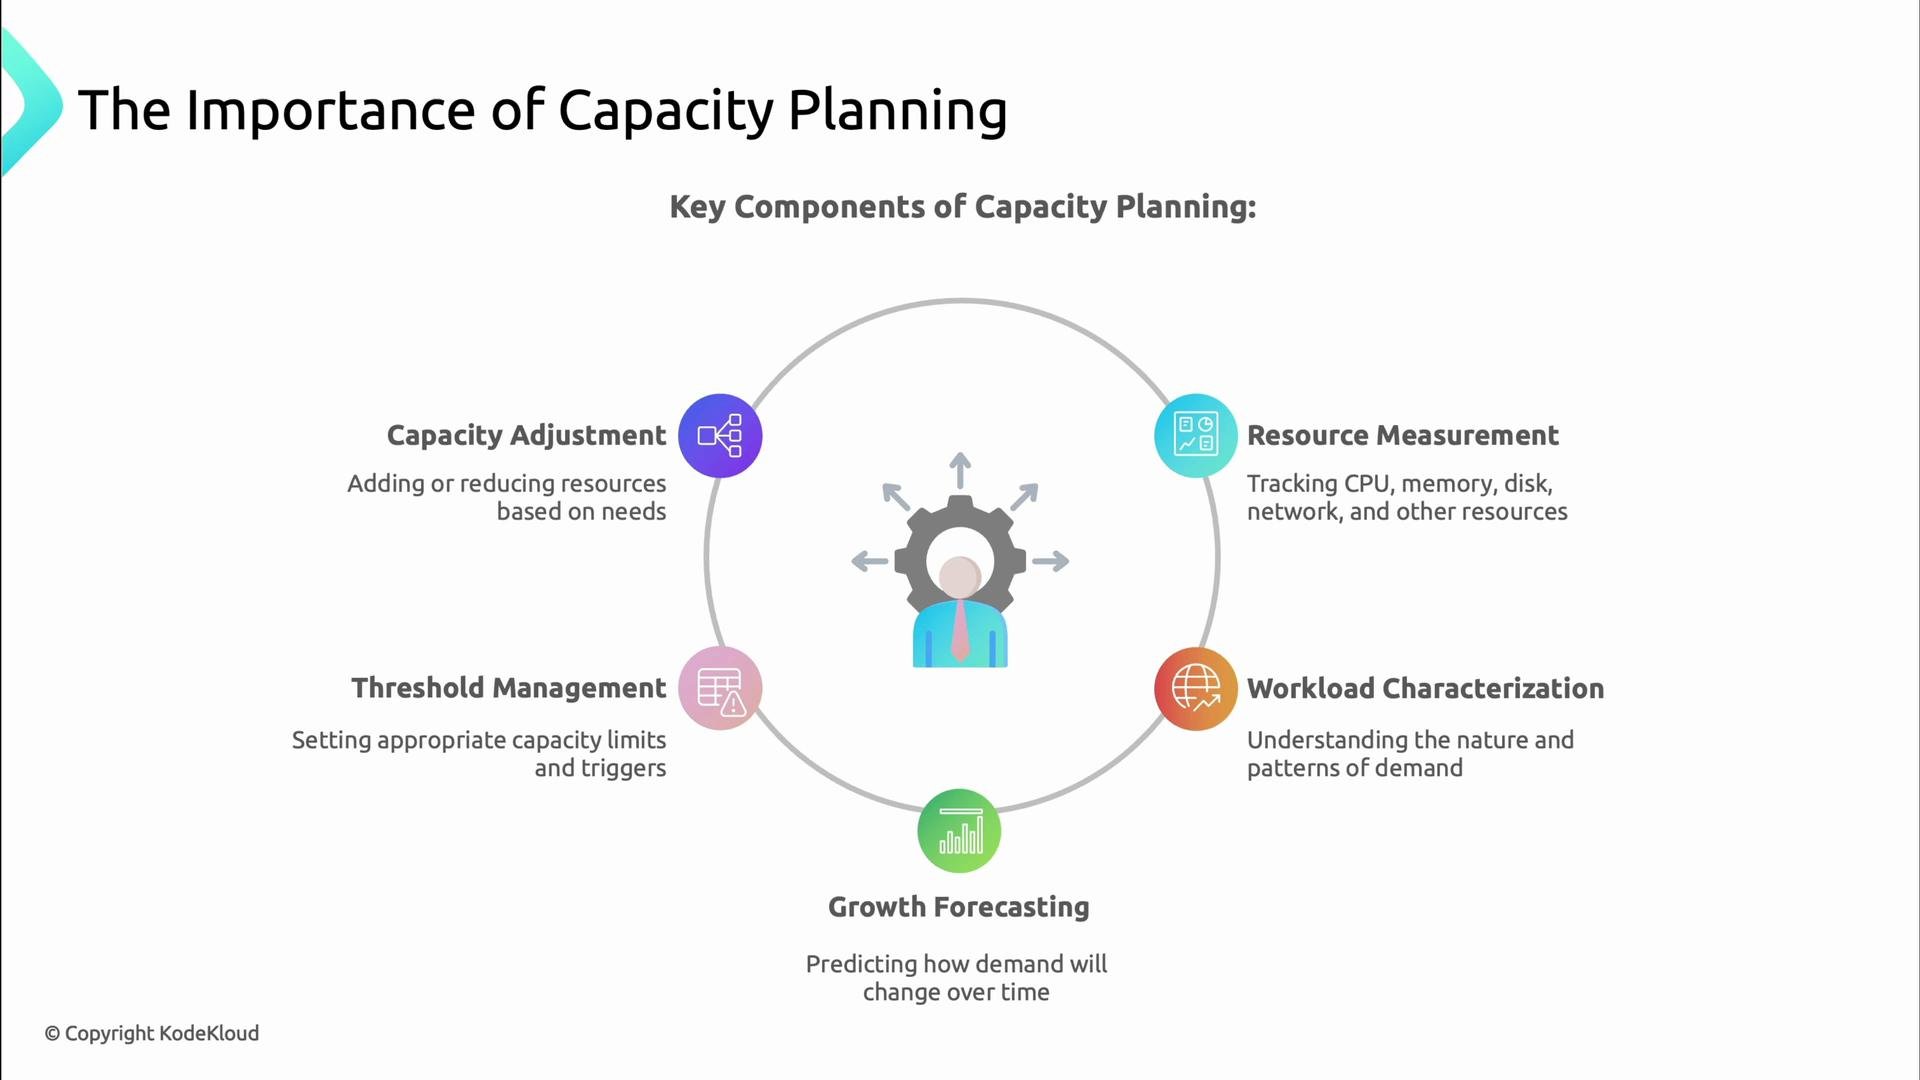
Capacity planning is the practice of forecasting, provisioning, and monitoring the compute, storage, and network resources your services need so users stay happy as demand grows. Good capacity planning prevents outages, reduces latency, and avoids unnecessary cloud spend. Imagine Black Friday: if you only react after alerts fire, it’s already too late. Capacity planning answers one critical question: do you have enough resources now and in the future to serve users reliably? If not, you either overspend or fail under load.
A presentation slide titled "The Importance of Capacity Planning" showing resources flowing to a system with the caption "Capacity planning forecasts resources for reliable workload handling." Below are three icons listing consequences: experience outages, degraded performance, and excessive costs.

Main components

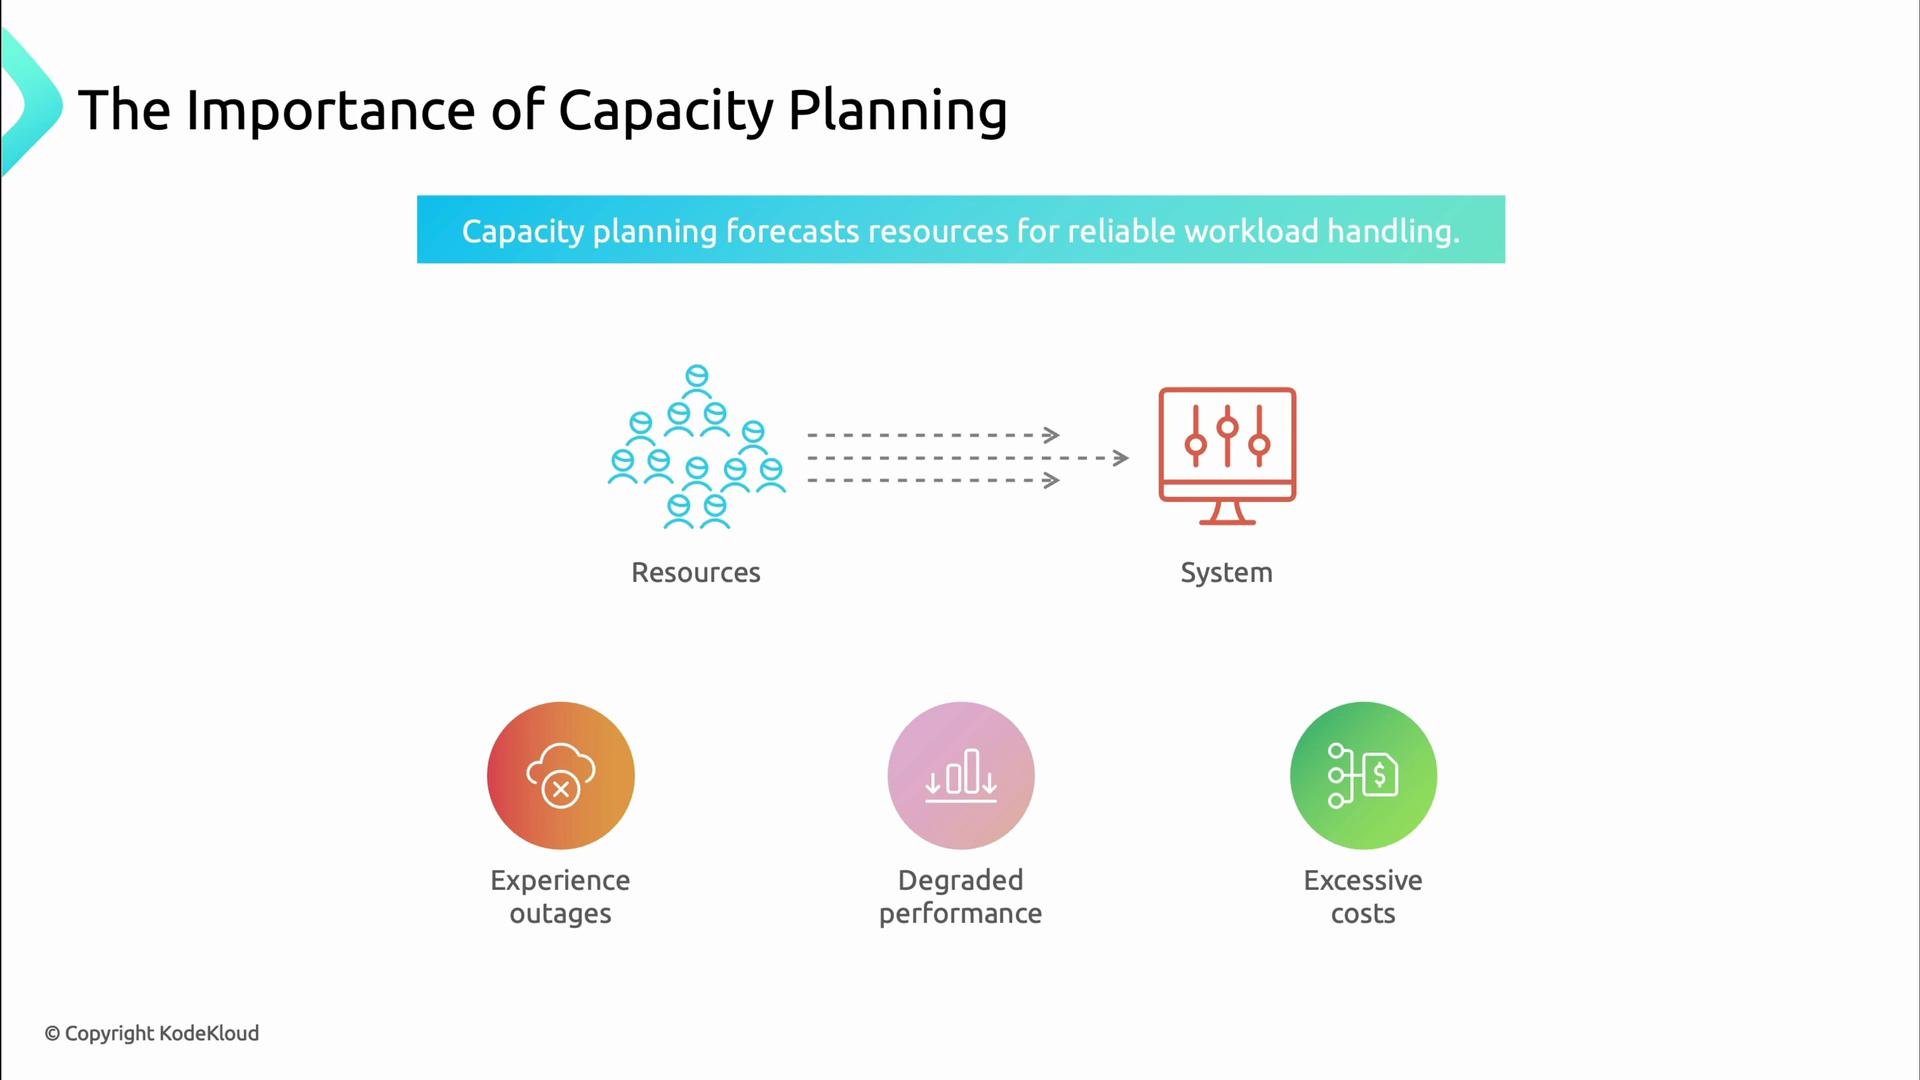
Capacity planning is built from a few repeatable activities:
  • Resource measurement — track CPU, memory, disk, network, and application-level metrics.
  • Workload characterization — map request patterns, peaks, and steady-state behavior.
  • Growth forecasting — predict future demand from historical trends and business drivers.
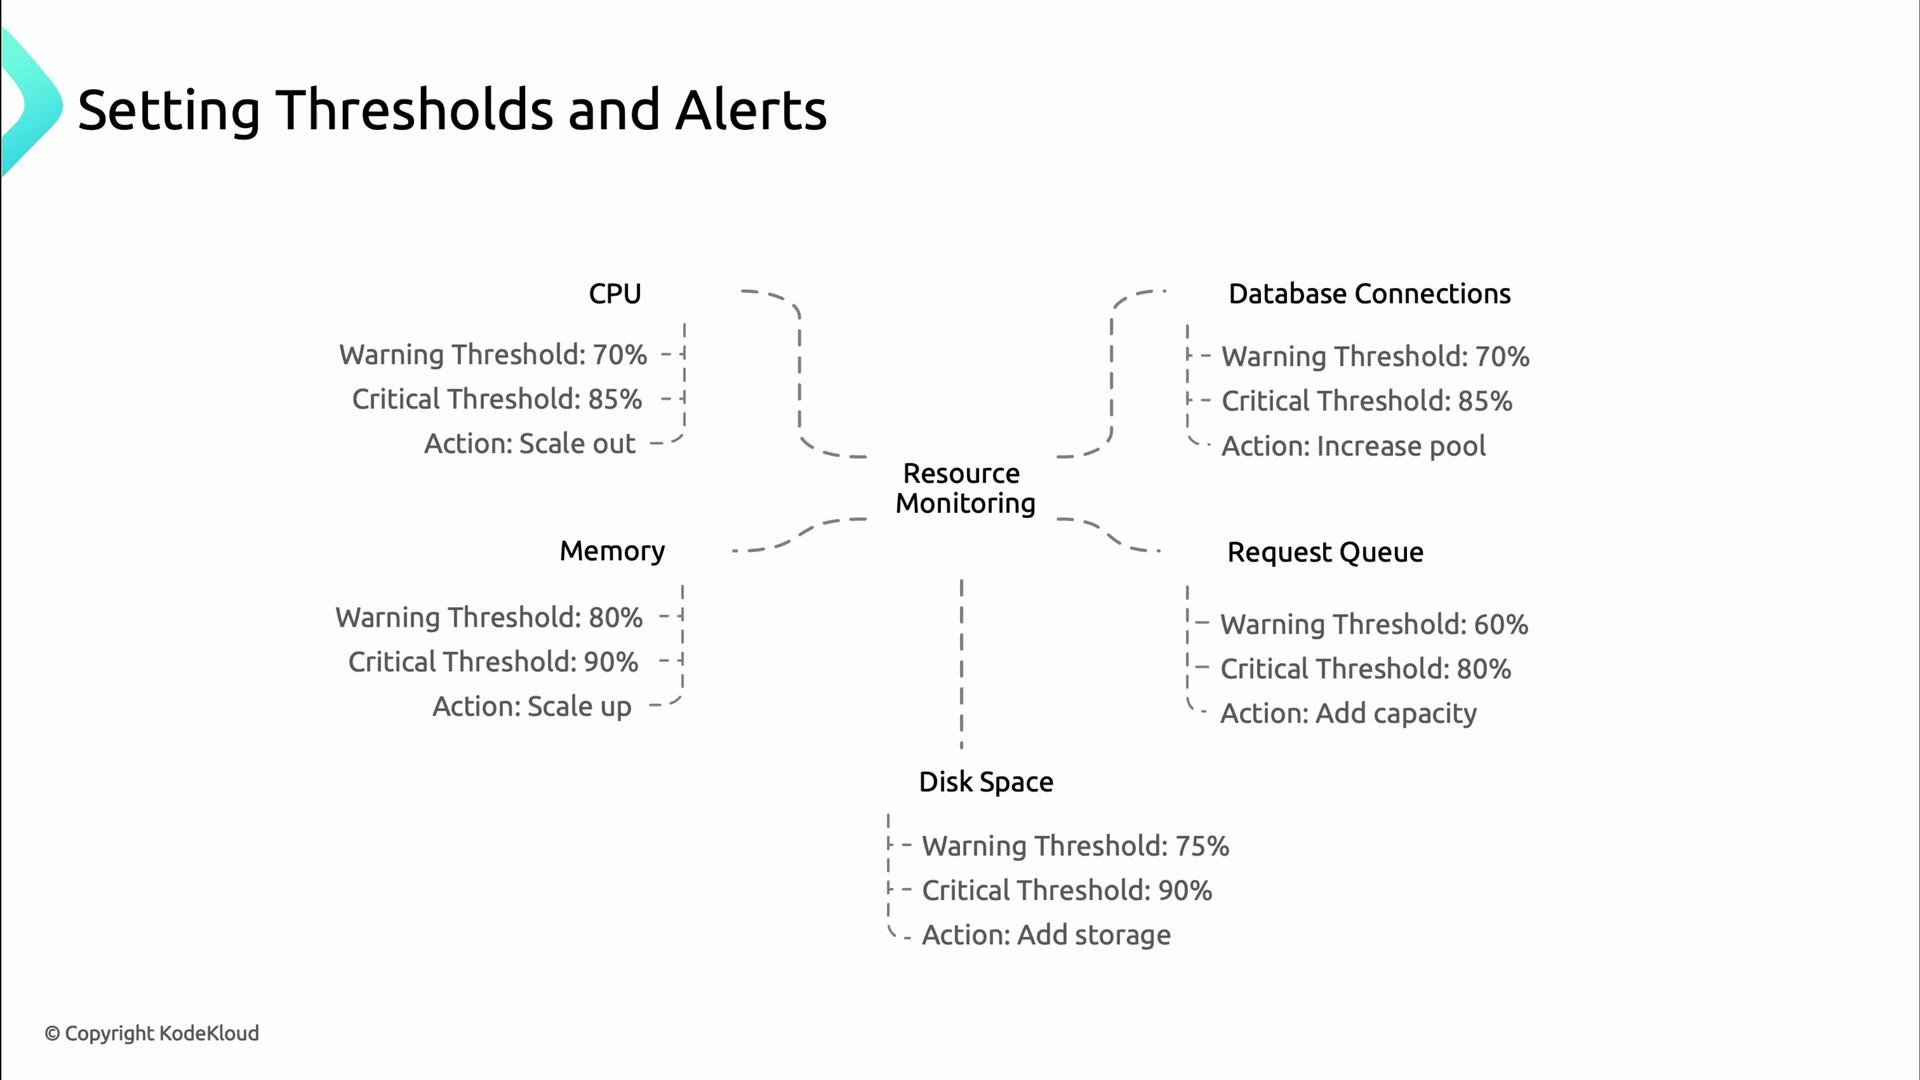
  • Threshold management — define warnings and critical limits and the actions they trigger.
  • Capacity adjustment — automate scaling and schedule planned provisioning.
A presentation slide titled "The Importance of Capacity Planning" showing a circular diagram with five key components — Resource Measurement, Workload Characterization, Growth Forecasting, Threshold Management, and Capacity Adjustment — around a central gear-and-person icon. Each component has a short description about tracking resources, understanding demand patterns, predicting growth, setting limits, and adjusting capacity.
When implemented, these activities lead to fewer outages from resource exhaustion, lower cloud bills through right-sizing, improved support for business growth, better user experience, and more predictable budgeting.
A presentation slide titled "The Importance of Capacity Planning" that lists five benefits of effective capacity planning with simple circular-arrow icons and captions. The benefits shown include preventing outages, reducing costs, supporting business growth, improving user experience, and enabling predictable budgeting (© KodeKloud).

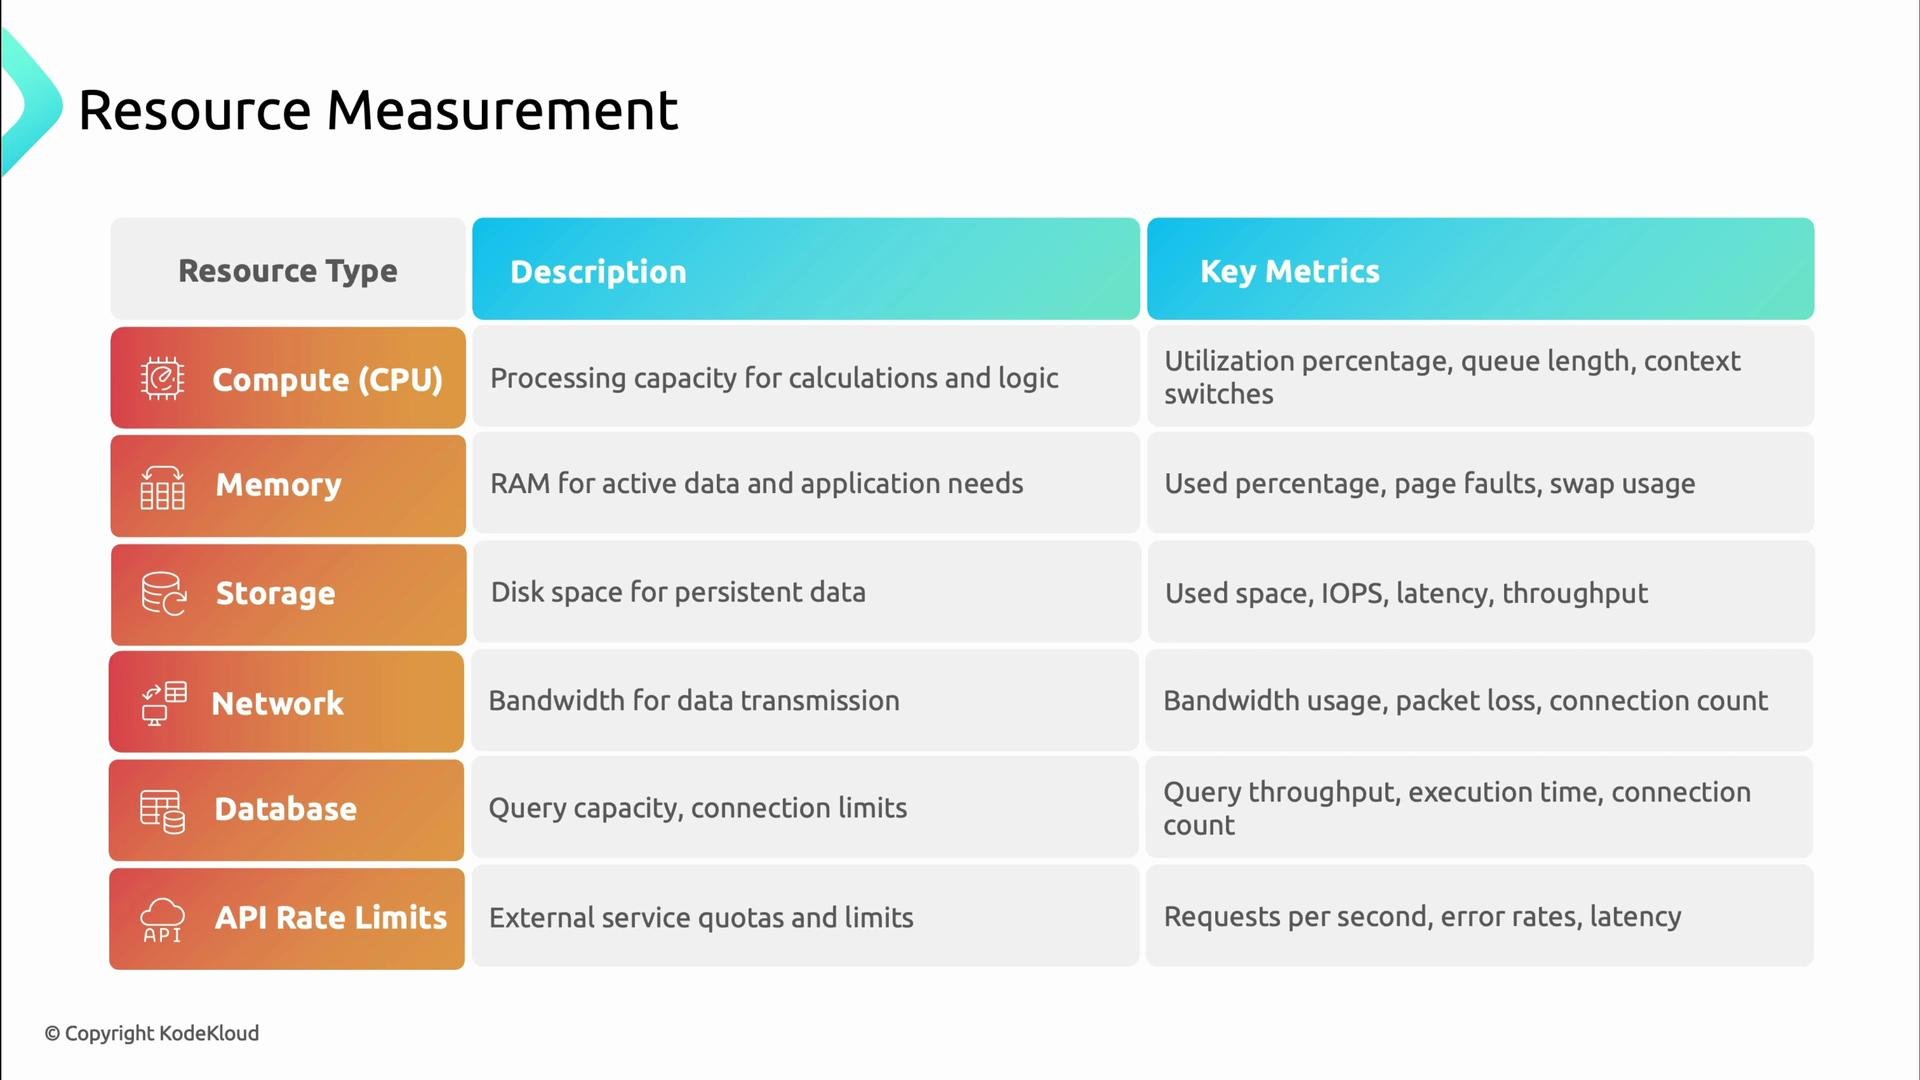
Resource types and metrics

Track the resources that directly affect reliability and performance. Use the table below to decide what to collect, visualize, and alert on.
Resource TypeKey MetricsTypical Signals to Monitor
Compute (CPU)Utilization %, load, runnable queueHigh sustained CPU -> scale, increase cores
Memory (RAM)Used %, page faults, swapRising usage -> OOM risk, memory leaks
Storage (Disk)Used space %, IOPS, latency, throughputFast growth -> add storage, tune retention
NetworkBandwidth, packets/sec, packet lossSaturation -> rate-limit, add capacity
DatabaseQuery throughput, latency, connectionsLong queries/connection spikes -> scale DB
API / Rate limitsRequests/sec, 4xx/5xx error rate, p95/p99 latencyTraffic bursts -> throttling or scaling
Collect these metrics consistently so forecasting, alerting, and scaling decisions can be data-driven.
A slide titled "Resource Measurement" showing a three-column table of resource types, descriptions, and key metrics. It lists rows for Compute (CPU), Memory, Storage, Network, Database, and API Rate Limits with brief descriptions and example metrics like utilization, IOPS, bandwidth, query throughput, and requests/sec.

Example metric signals

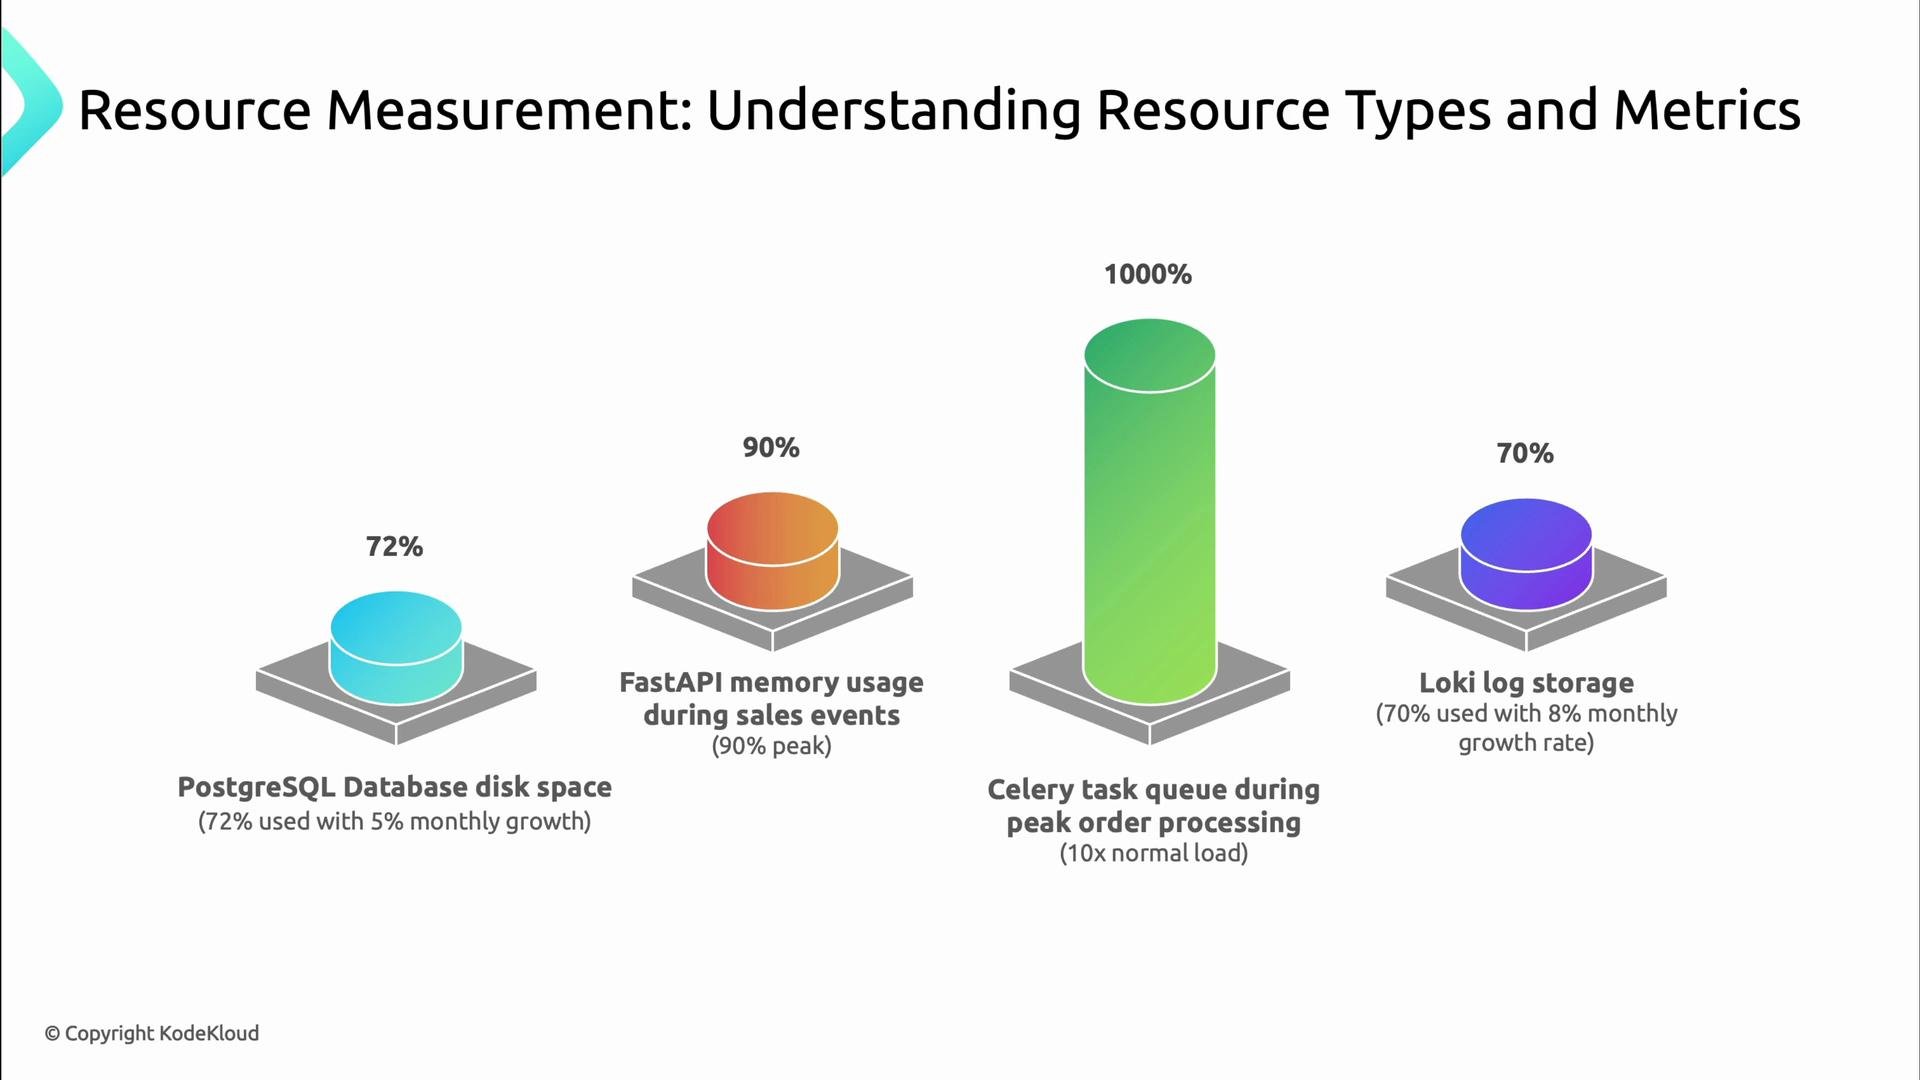
Real-world signals tell you when to act:
  • PostgreSQL disk usage: 72% used, growing at 5% monthly — schedule additional storage or reduce retention.
  • FastAPI memory: peaks at 90% during sales — investigate leaks or increase pod memory and HPA targets.
  • Celery task queue: 10× normal load during peak — add workers or throttle producers.
  • Loki log storage: 70% used, growing at 8% monthly — change retention or add storage.
These signals should feed into dashboards and alerts so you can act before users see problems.
A presentation slide titled "Resource Measurement: Understanding Resource Types and Metrics" showing four 3D cylinder charts for different resources. The cylinders show PostgreSQL disk space 72%, FastAPI memory usage 90% (peak), Celery task queue 1000% (10x normal load), and Loki log storage 70%.

Example topology metrics

Below is an example snapshot of per-component metrics from a sample application. Use this structure to feed dashboards, alerts, and capacity models.
KodeKloud Records Store
├─ API Service (FastAPI)
│  ├─ CPU: 40-60% average, 85% peak during high traffic
│  ├─ Memory: 70% average, 90% peak during sales
│  ├─ Network: 500 Mbps average, 1.2 Gbps peak
│  ├─ Connections: 2000/sec average, 5000/sec peak
│  └─ Response Time: 150ms average, 350ms during peak
├─ Database Connection
│  └─ PostgreSQL Database
│     ├─ CPU: 50% average, 90% peak during checkout rush
│     ├─ Memory: 75% average, 95% peak during sales
│     ├─ Disk: 72% used, growing at 5% per month
│     ├─ Connections: 200 average, 500 peak
│     └─ IOPS: 1000 average, 5000 peak during sales
├─ Background Processing
│  ├─ Celery Worker
│  │  ├─ CPU: 30% average, 80% peak during order processing
│  │  ├─ Memory: 60% average, 85% peak
│  │  └─ Task Queue: 200 tasks/min average, 2000 tasks/min peak
│  └─ RabbitMQ Message Queue
│     ├─ CPU: 25% average, 70% peak
│     ├─ Memory: 45% average, 80% peak
│     ├─ Disk: 30% used
│     └─ Queue Size: 500 messages average, 10,000 peak
└─ Observability Stack
   ├─ Prometheus (Metrics)
   │  ├─ CPU: 20% average, 40% peak
   │  ├─ Memory: 60% average, 75% peak
   │  └─ Disk: 65% used, growing at 3% per month
   ├─ Loki (Logs)
   │  ├─ CPU: 15% average, 35% peak
   │  ├─ Memory: 50% average, 70% peak
   │  └─ Disk: 70% used, growing at 8% per month
   └─ Jaeger (Tracing)
      ├─ CPU: 10% average, 30% peak
      ├─ Memory: 40% average, 65% peak
      └─ Disk: 45% used, growing at 2% per month

Monitoring and visibility

Metrics only help when collected, stored, and visualized. Build dashboards that show trends (not just current values), wire alerts into incident workflows, and enable automated responders where safe. Without observability, forecasting and right-sizing are guesswork.

Capacity forecasting

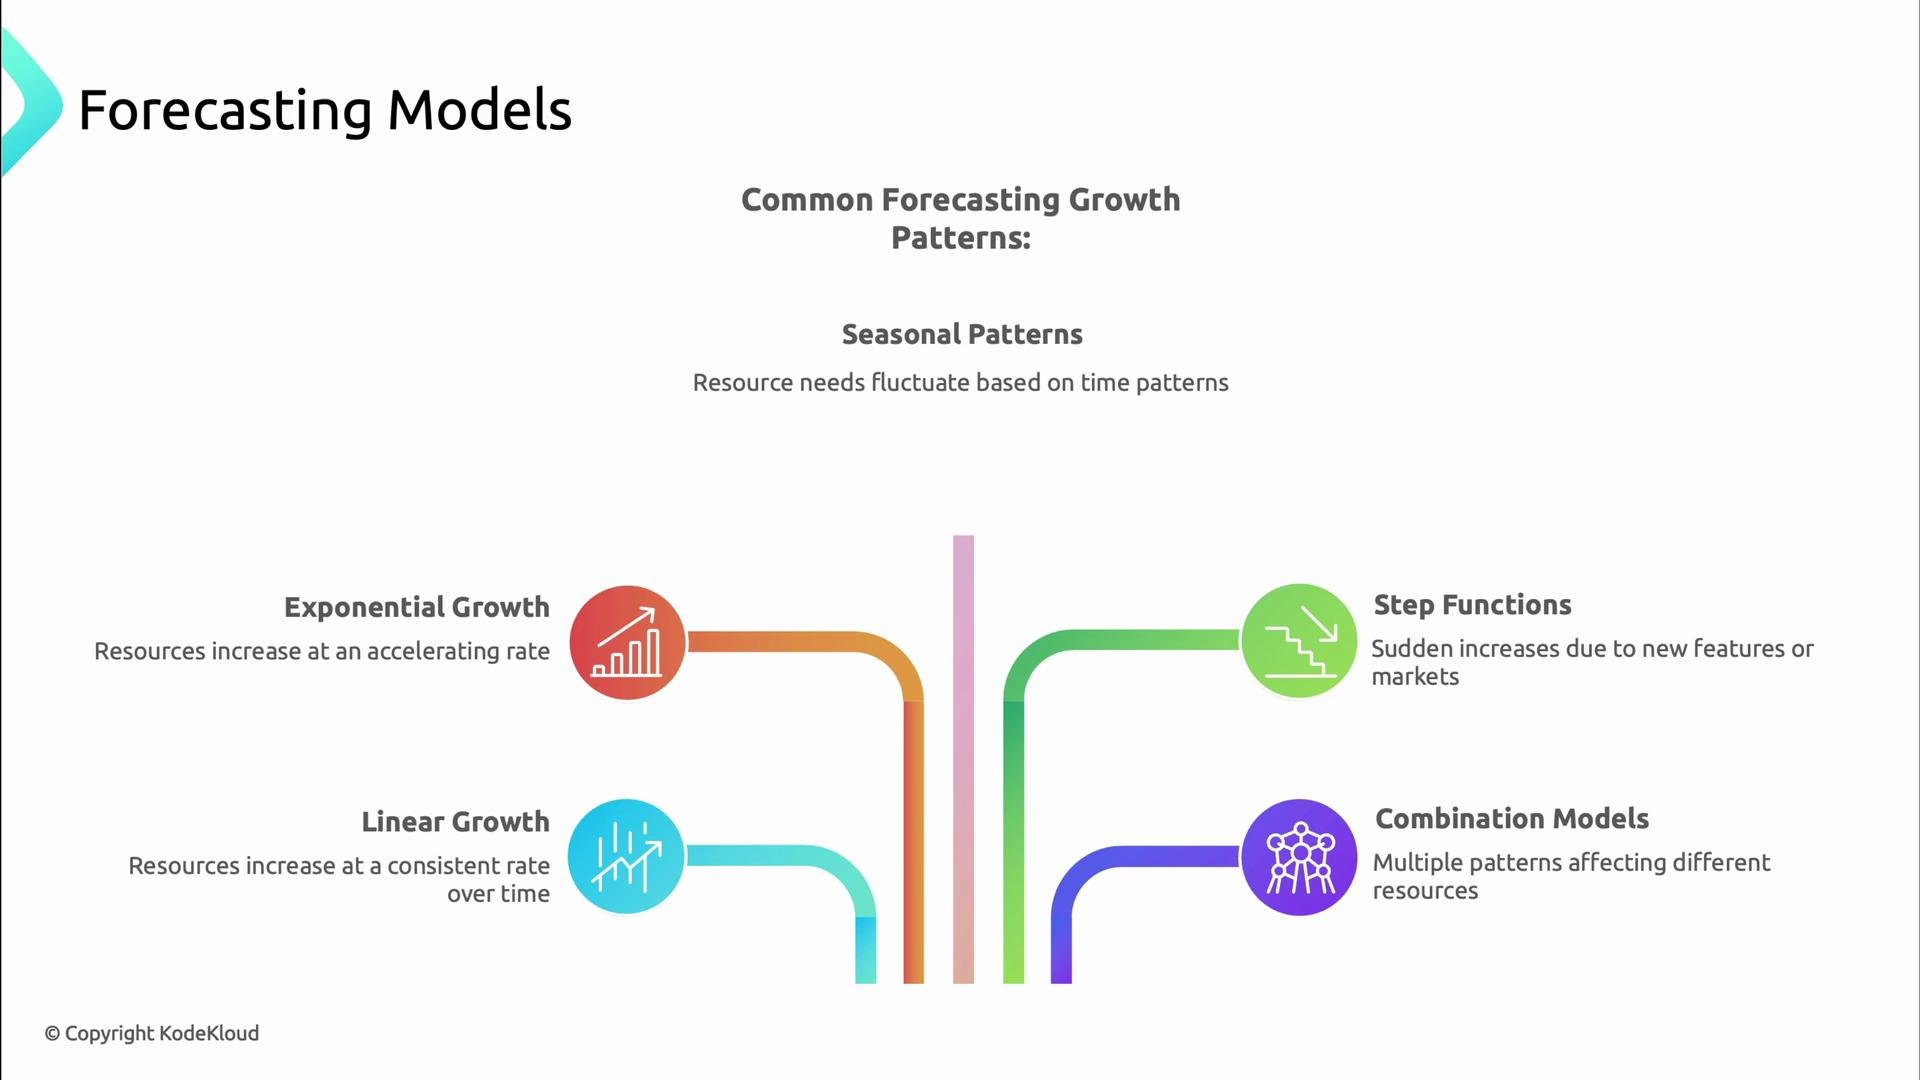
Forecasting uses historical signals and business context to predict future demand. Choose models that match observed behavior:
  • Linear growth — steady increase tied to predictable user growth.
  • Exponential growth — viral adoption or new product launches.
  • Seasonal patterns — daily/weekly/holiday cycles.
  • Step functions — sudden jumps after marketing pushes or launches.
  • Combination models — mixtures of the above patterns.
Match your model to actual patterns for accurate capacity plans.
A slide titled "Forecasting Models" showing common growth patterns—with "Seasonal Patterns" at the top and four illustrated types (Exponential Growth, Linear Growth, Step Functions, Combination Models) arranged below, each with a colored icon and short description of how resources change over time.
Example: database growth over 12 months
# Database size growth over 12 months (in GB)
Jan: 120
Feb: 127
Mar: 134
Apr: 141
May: 148
Jun: 156
Jul: 164
Aug: 173
Sep: 182
Oct: 191
Nov: 210 (Black Friday sale)
Dec: 230 (Holiday season)

Proactive vs reactive

Both proactive and reactive controls are necessary:
  • Proactive: forecast demand, load-test, schedule upgrades, and right-size infrastructure ahead of peaks.
  • Reactive: auto-scale, throttle, queue, or gracefully degrade when unexpected spikes occur.
A presentation slide titled "Proactive vs Reactive Capacity Management" showing a two-column table comparing proactive practices (forecast demand, load testing, design for growth, scheduled upgrades) with reactive ones (respond to real-time changes, auto-scale, graceful degradation, throttle/queue). A footer notes you need both: proactive stays ahead, reactive keeps you running.
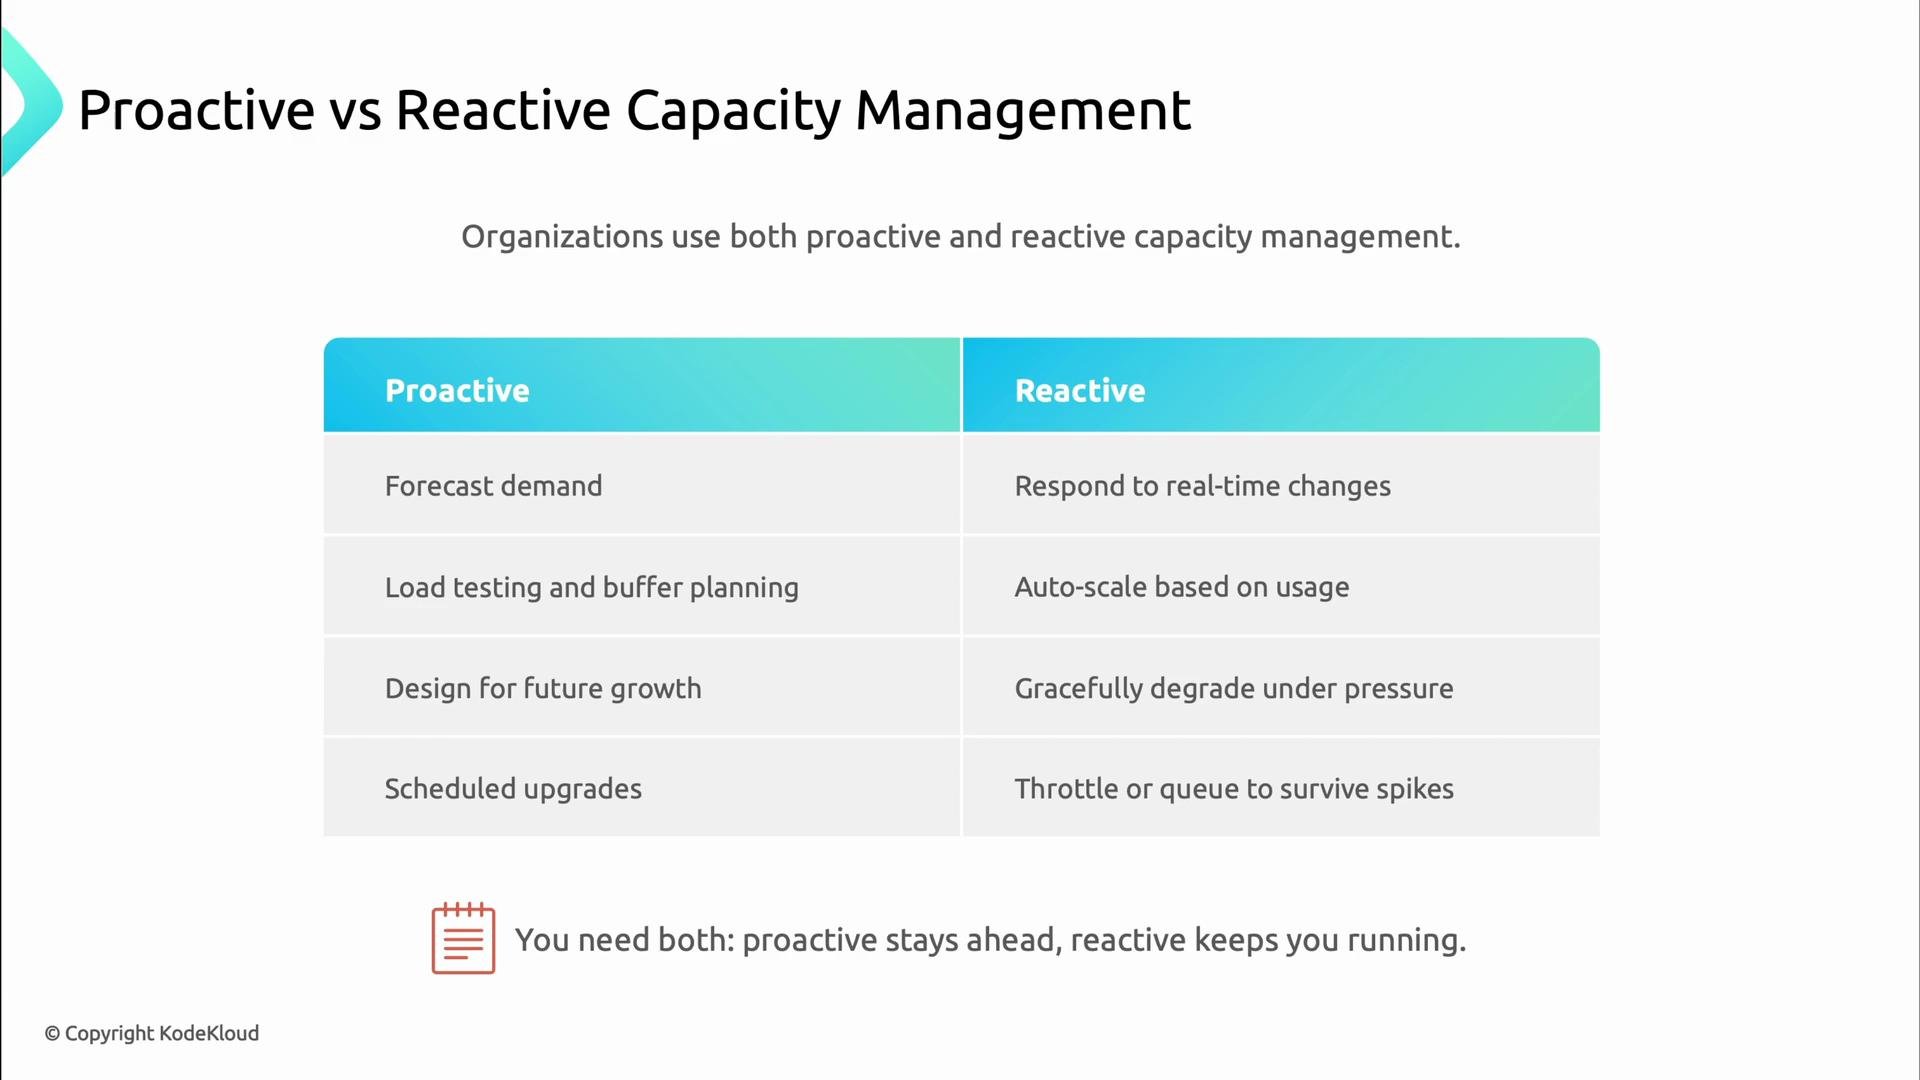
Proactive planning reduces the number of emergency scale-ups you must perform, while reactive mechanisms keep the service available during unpredicted spikes. Both are necessary.

Reactive strategy example: Kubernetes HPA

Kubernetes Horizontal Pod Autoscaler (HPA) is a common reactive tool that scales pods based on CPU, memory, or custom metrics. HPA complements capacity planning by absorbing short-term bursts while longer-term capacity is provisioned.
A presentation slide about capacity planning that highlights a reactive auto-scaling strategy. It shows the Kubernetes Horizontal Pod Autoscaler (HPA) logo with the note that it automatically adds or removes pods based on CPU and memory usage.
Example HPA configuration (scales between 3 and 10 replicas based on average CPU utilization):
apiVersion: autoscaling/v2
kind: HorizontalPodAutoscaler
metadata:
  name: kodekloud-api
spec:
  scaleTargetRef:
    apiVersion: apps/v1
    kind: Deployment
    name: kodekloud-api
  minReplicas: 3
  maxReplicas: 10
  metrics:
    - type: Resource
      resource:
        name: cpu
        target:
          type: Utilization
          averageUtilization: 70

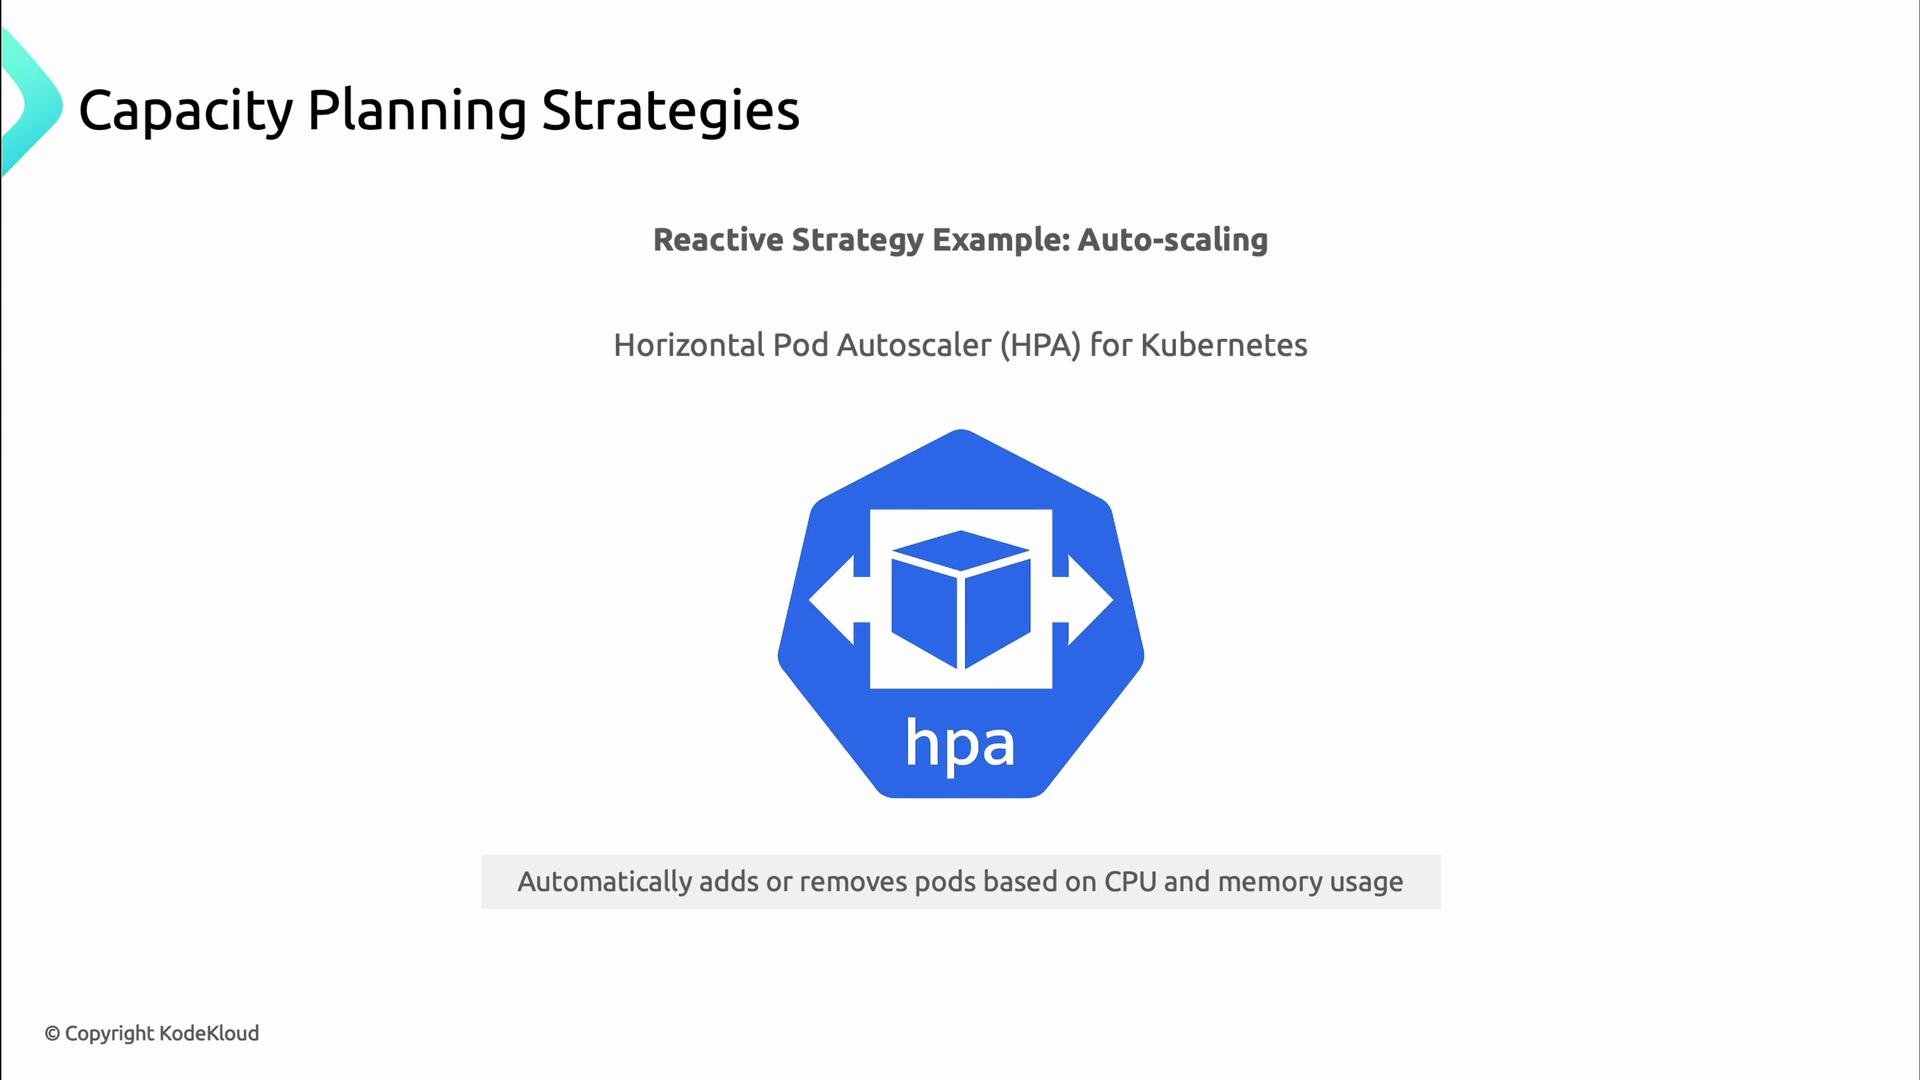
Thresholds and alerts

Translate metrics into actionable alerts with thresholds that give you time to act while minimizing false positives.
A presentation slide titled "Setting Thresholds and Alerts" with a colorful funnel graphic on the left and a list of threshold types on the right. The list shows Utilization Threshold, Growth Rate Threshold, Time-to-Exhaustion, Performance Degradation, and Error Rate, each with a short description and icon.
Common alert types:
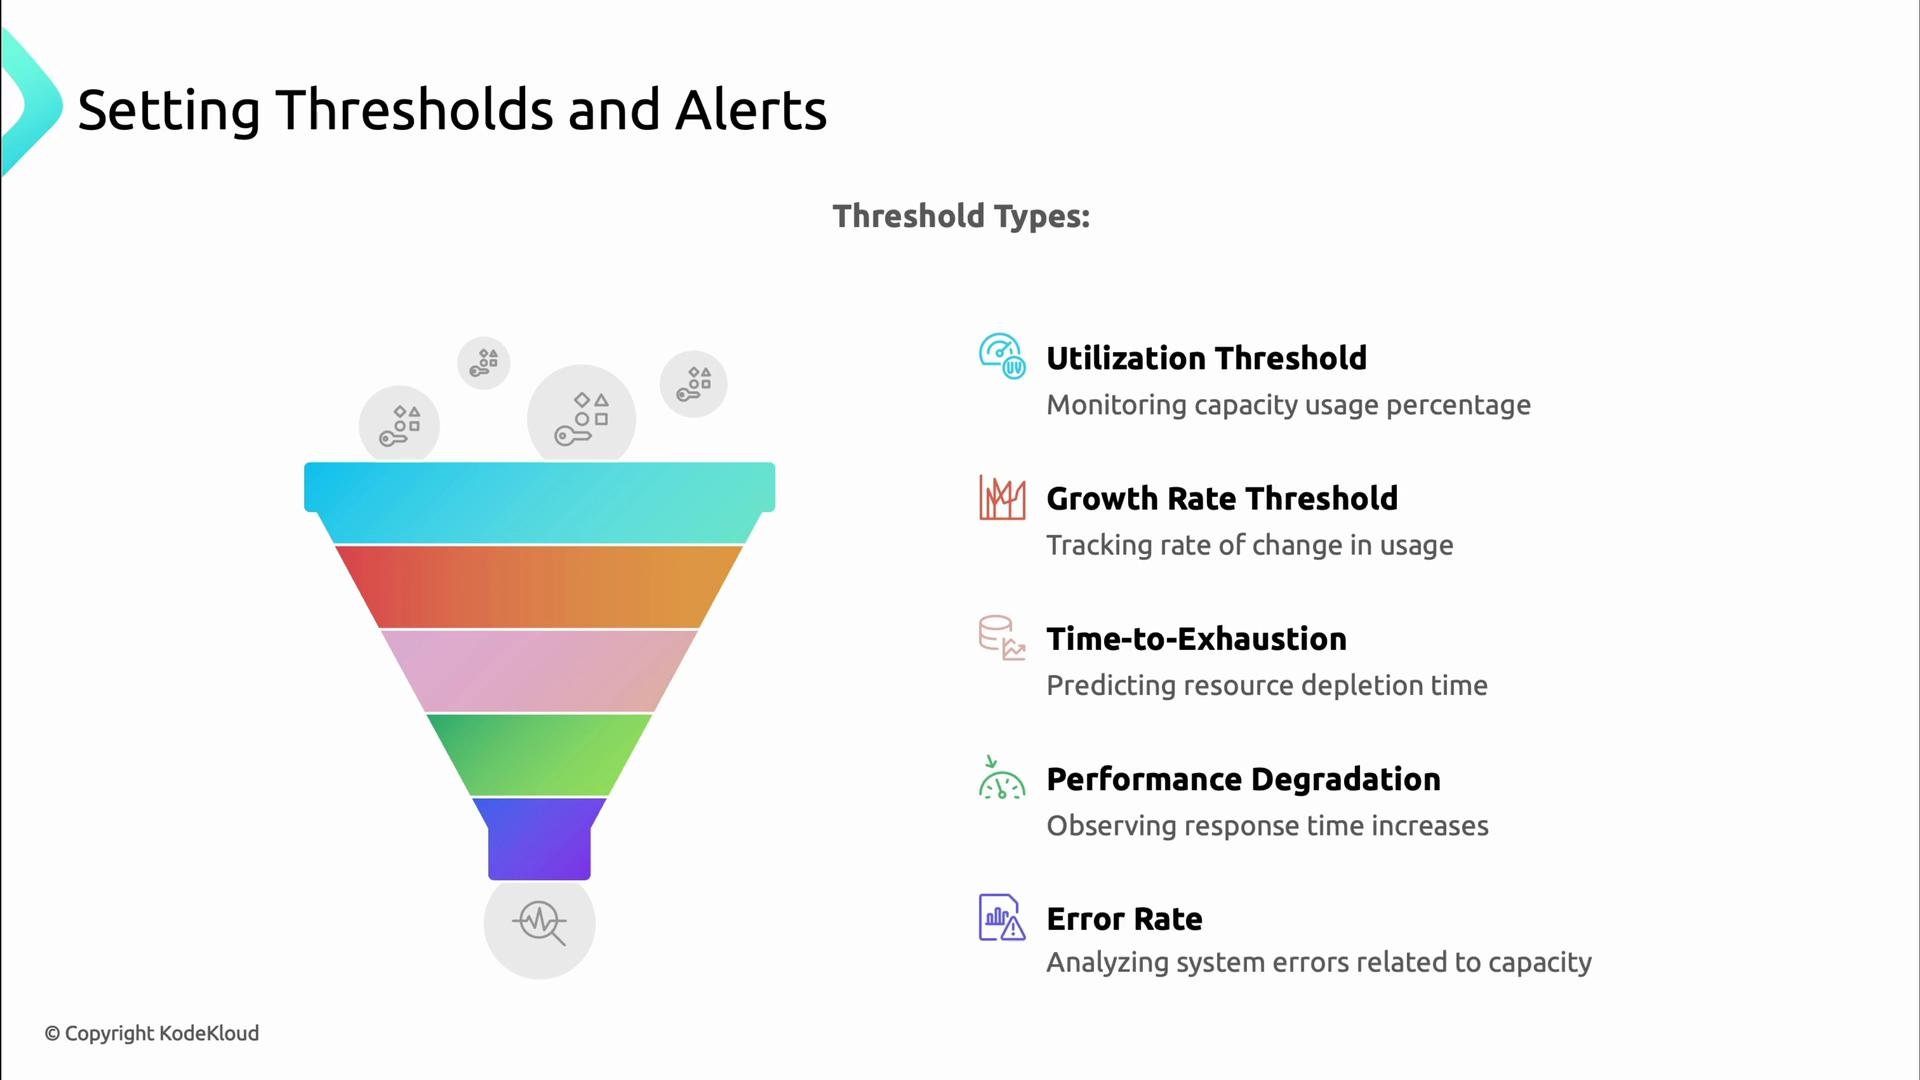
  • Utilization thresholds (CPU %, memory %).
  • Growth rate thresholds (rate of change).
  • Time-to-exhaustion (predict when a resource will be depleted).
  • Performance degradation (p95/p99 latency increases).
  • Error-rate thresholds (5xx spike).
A slide titled "Setting Thresholds and Alerts" showing a resource-monitoring diagram for CPU, Memory, Disk Space, Database Connections, and Request Queue. Each resource lists warning and critical percentage thresholds and a recommended action (e.g., scale out, scale up, add storage, increase pool).
Example thresholds and recommended actions:
ResourceWarningCriticalTypical Action
CPU70%85%Scale out pods or add CPU
Memory80%90%Increase instance size or add nodes
DB connections70%85%Increase pool size, add replicas
Request queue60%80%Add workers or throttle producers
Disk70-80%90%Add storage or offload data

Summary

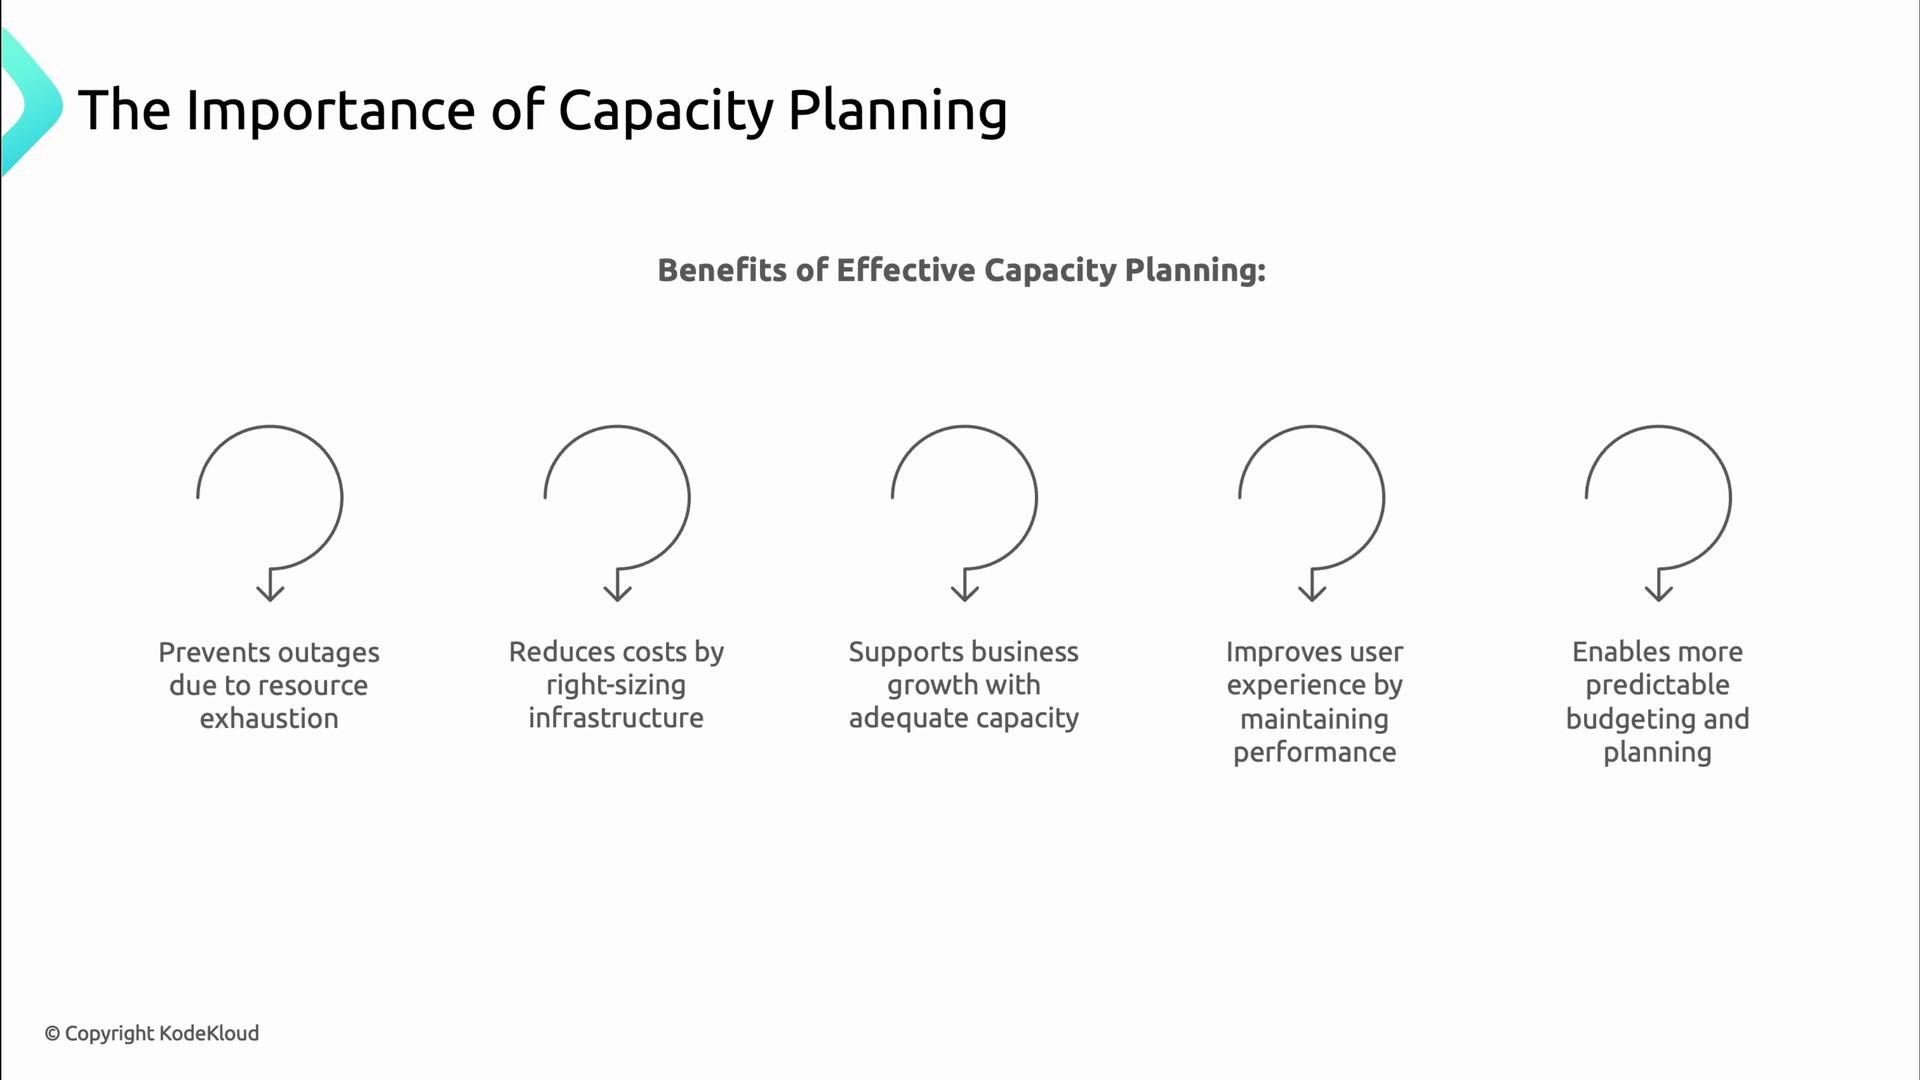
Effective capacity planning combines measurement, forecasting, sensible thresholds, and automation. Build visibility with observability tools, choose forecasting models that reflect your workload, and implement both proactive strategies (planning and testing) and reactive controls (autoscaling and graceful degradation). This approach reduces outages, controls cost, and supports growth while keeping users happy.