

- Monitoring performance: Track runtime behavior and technical health.
- Evaluating effectiveness: Measure business impact and user outcomes.
- Verifying compliance: Confirm security, privacy, and policy requirements remain met.
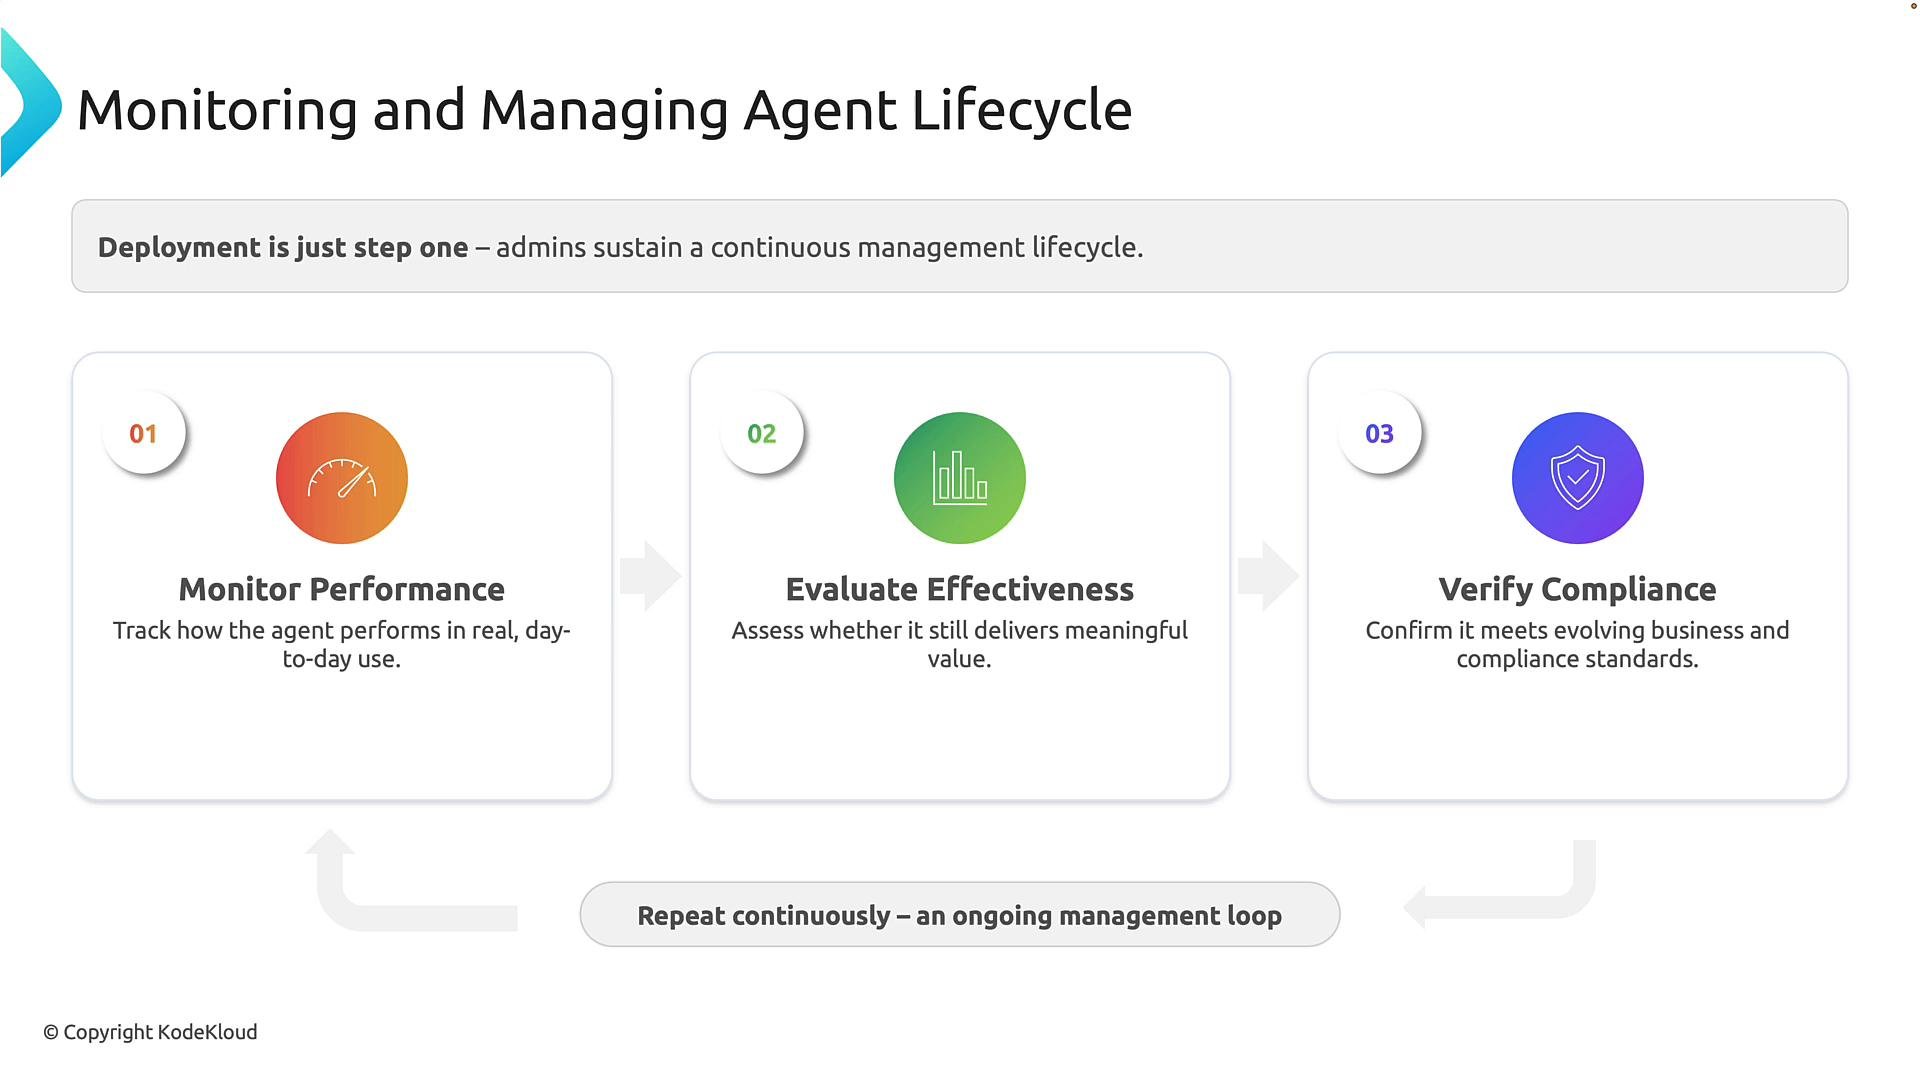
Lifecycle management is continuous: monitor performance, evaluate effectiveness, verify compliance, and repeat the cycle throughout the life of the agent.
1) Monitor performance
After deployment, administrators need observability into how the agent performs in real-world use. Key technical metrics include:- Response latency (time to first response and end-to-end answer time)
- Throughput (requests per minute)
- Answer quality indicators (confidence scores, human ratings, or automated relevance checks)
- Task completion rate (percentage of interactions that achieve the user’s goal)
2) Evaluate effectiveness
Technical performance does not guarantee business value. Track outcomes that indicate whether the agent is meeting its intended goals:- Adoption and engagement (active users, frequency, and session length)
- Operational impact (support ticket reductions, average handling time savings, time saved per task)
- Business KPIs tied to the agent’s objectives (e.g., a 30% reduction in tickets for a help-desk agent)
3) Verify compliance
Policies, regulations, and internal controls evolve. Revalidate the agent after changes such as new data sources, permission model updates, or regulatory updates:- Review access controls and data flow diagrams when new connectors are added.
- Re-run privacy and data retention checks after changes to knowledge stores.
- Reconfirm any auditing and logging requirements are still captured.
Why unmanaged agents create risk
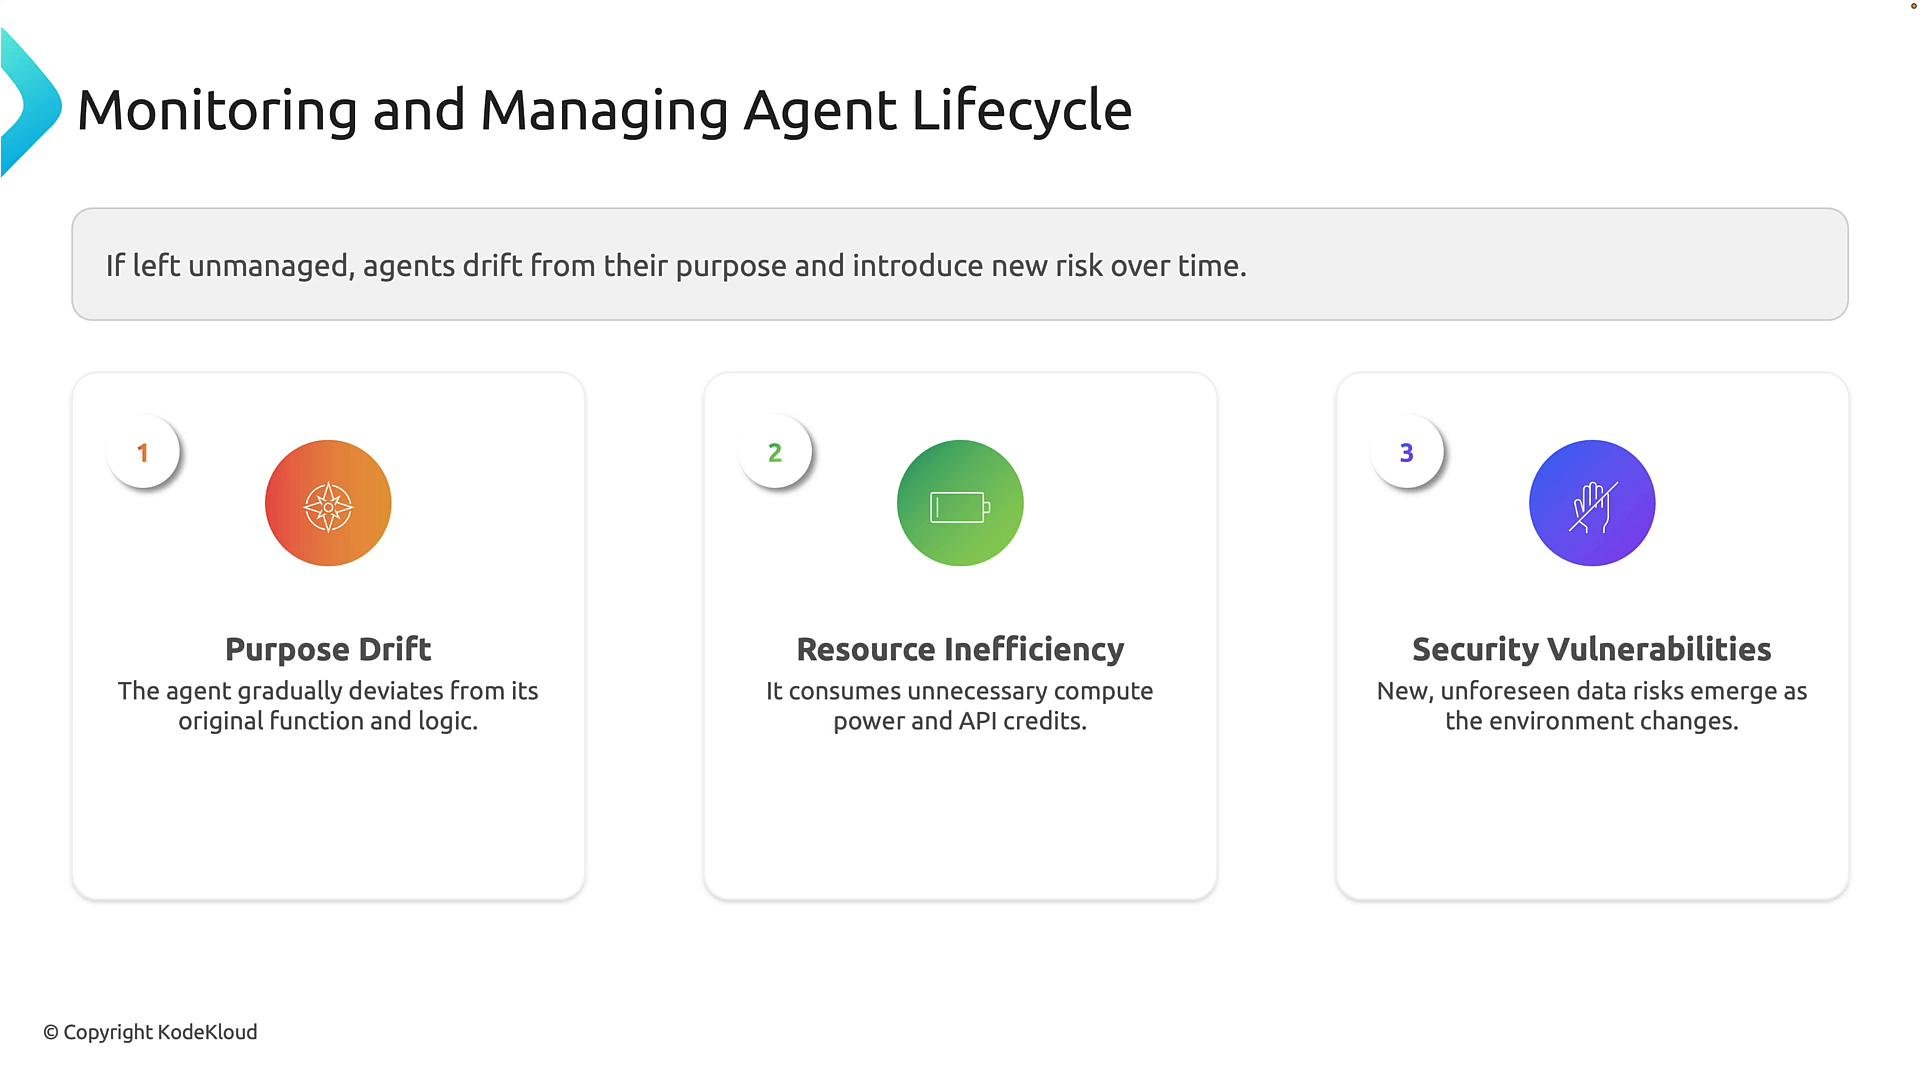
If agents are left unmanaged, they can accumulate problems that reduce ROI and increase exposure. The three primary risks are:- Purpose drift — The agent’s scope can shift as knowledge and instructions change, causing it to return irrelevant or out-of-scope content.
- Resource inefficiency — Agents consume compute, AI credits, and licenses; underused or poorly optimized agents can waste budget.
- Security vulnerabilities — Changes to permissions, integrations, or data sources can create new security or compliance gaps.
Track the right signals
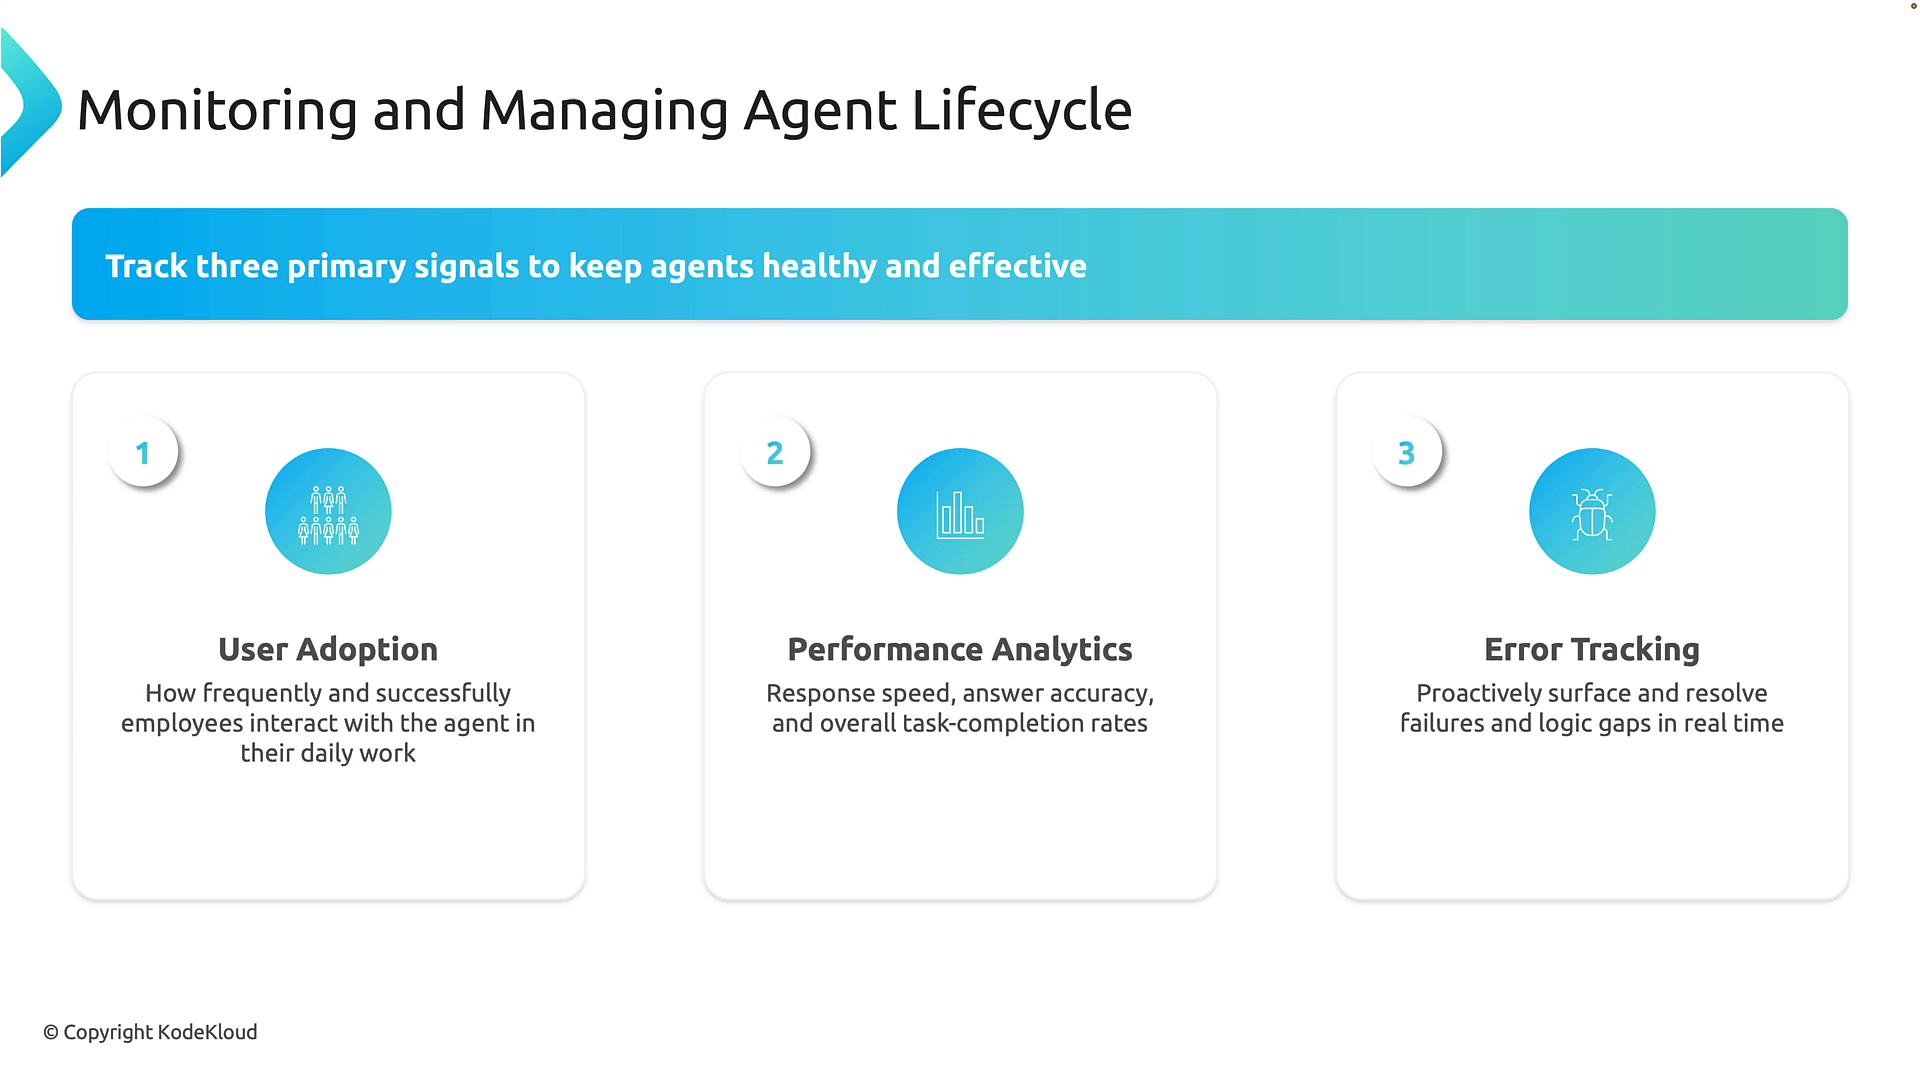
To detect problems early and measure success, monitor a combination of adoption, performance, and error signals. The table below summarizes essential signals, what they measure, sample metrics, and recommended actions.
Collect signals in dashboards and set thresholds/alerts to notify owners when metrics deviate from expected ranges. Correlate signals (e.g., increased latency + growth in users) to identify root causes faster.
Recommended cadence and operating model
- Daily/real-time: Monitor critical alerts (system outages, high error rates, major permission failures).
- Weekly: Review adoption and performance dashboards for trends and quick fixes.
- Monthly/Quarterly: Evaluate business impact, compliance posture, and resource usage. Revalidate goals (e.g., ticket reduction targets) and update documentation.
- After any significant change: Re-run tests and compliance checks when you update knowledge sources, integrations, or business policies.
Links and references
- Azure Monitor
- Application Insights
- Monitoring best practices and observability patterns for production AI systems