In this lesson we explore how administrators can monitor Microsoft 365 Copilot usage and measure adoption across the organization. Effective monitoring supplies objective data so you can make evidence-based decisions about licensing, training, and feature rollout — instead of guessing. Why this matters: without usage data, you may not know whether Copilot licenses are delivering value, which teams benefit most, or where to invest in training and enablement. Usage analytics let you prioritize efforts that increase productivity and control costs. Understand two foundational metrics before diving into trends:
  • Enabled users: everyone assigned a Microsoft 365 Copilot license — the total population who can use Copilot.
  • Active users: the subset of enabled users who actually engaged with Copilot during a defined reporting period.
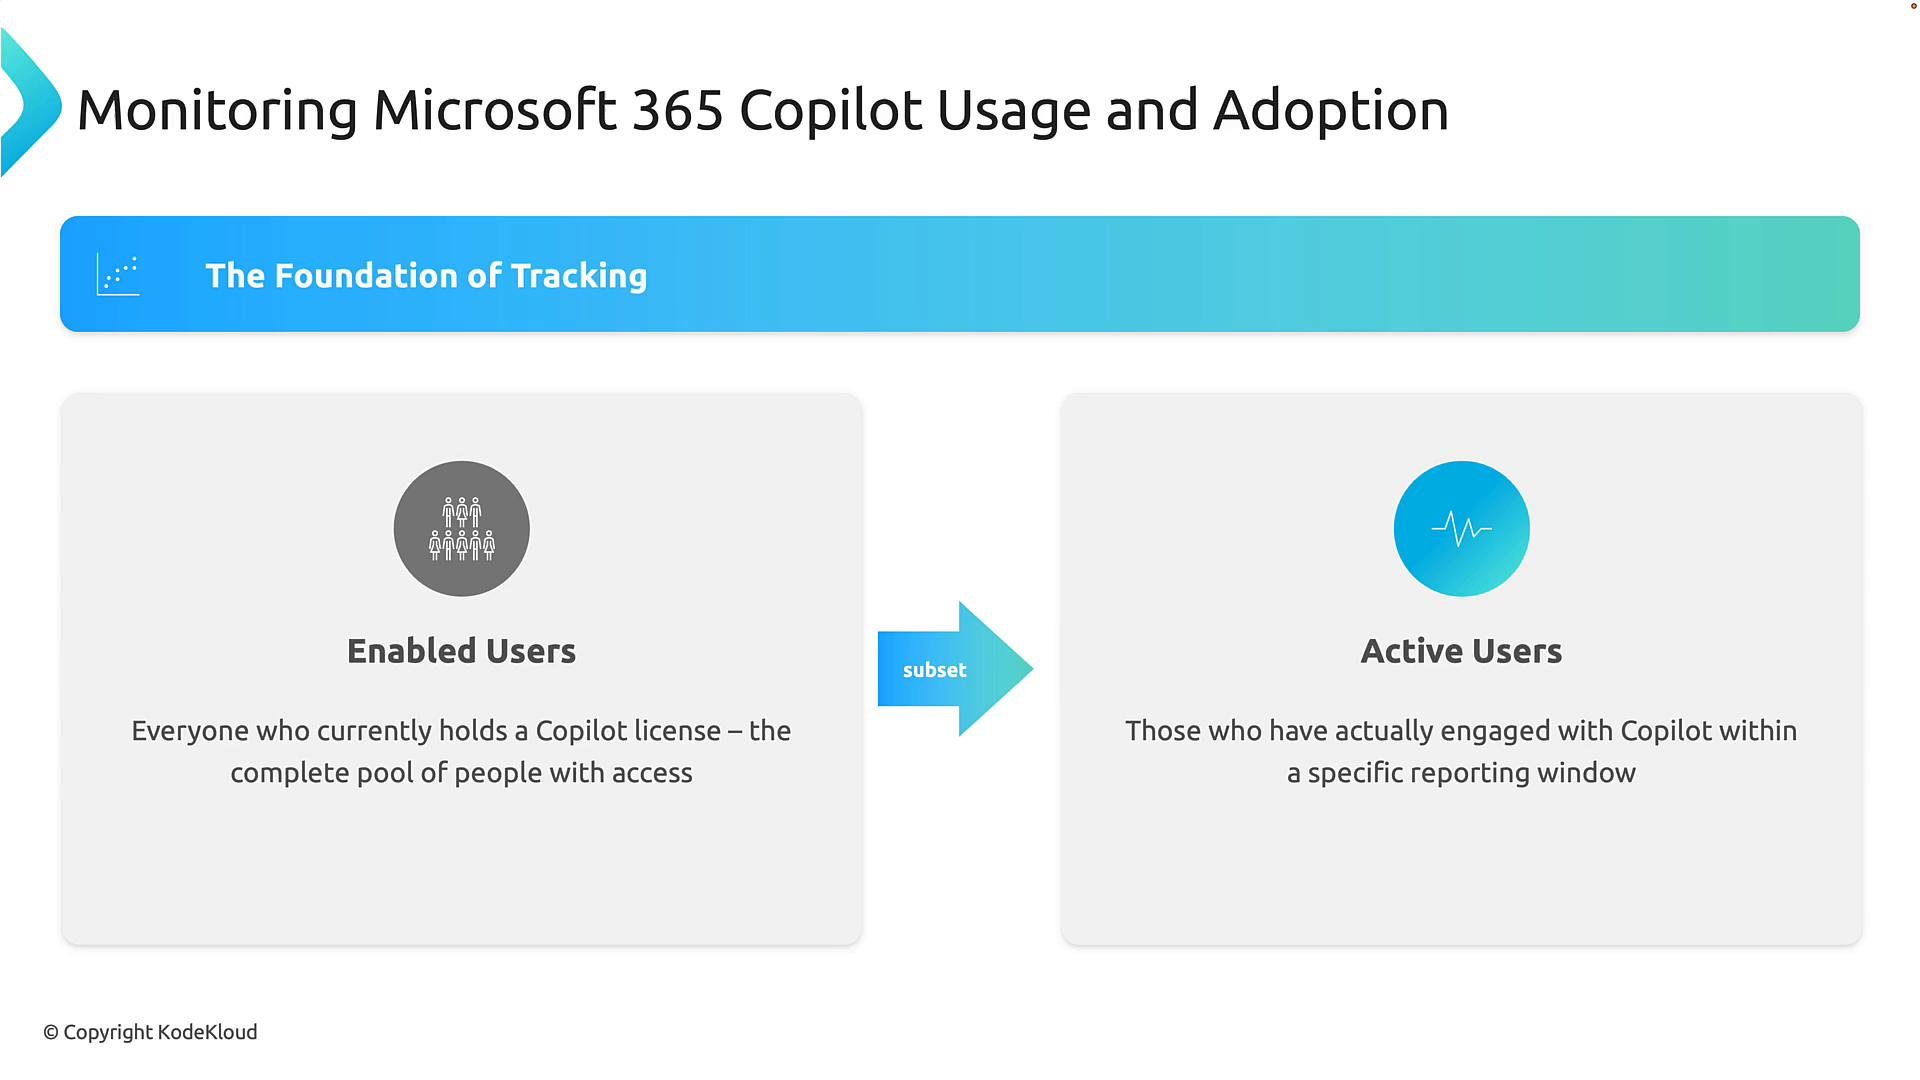
Example: if 1,000 employees have Copilot licenses but only 700 use it in a month, you have 1,000 enabled users and 700 active users. Tracking both metrics reveals adoption rates and opportunities to increase engagement.
A slide titled "Monitoring Microsoft 365 Copilot Usage and Adoption" that shows "The Foundation of Tracking" and two cards: "Enabled Users" (everyone with a Copilot license) and "Active Users" (those who actually engaged with Copilot), connected by a "subset" arrow.

Drill down: who, where, and when

Once you know who has access and who is actively using Copilot, analyze usage patterns more deeply. Effective adoption monitoring goes beyond headcounts — focus on three dimensions to surface actionable insights:
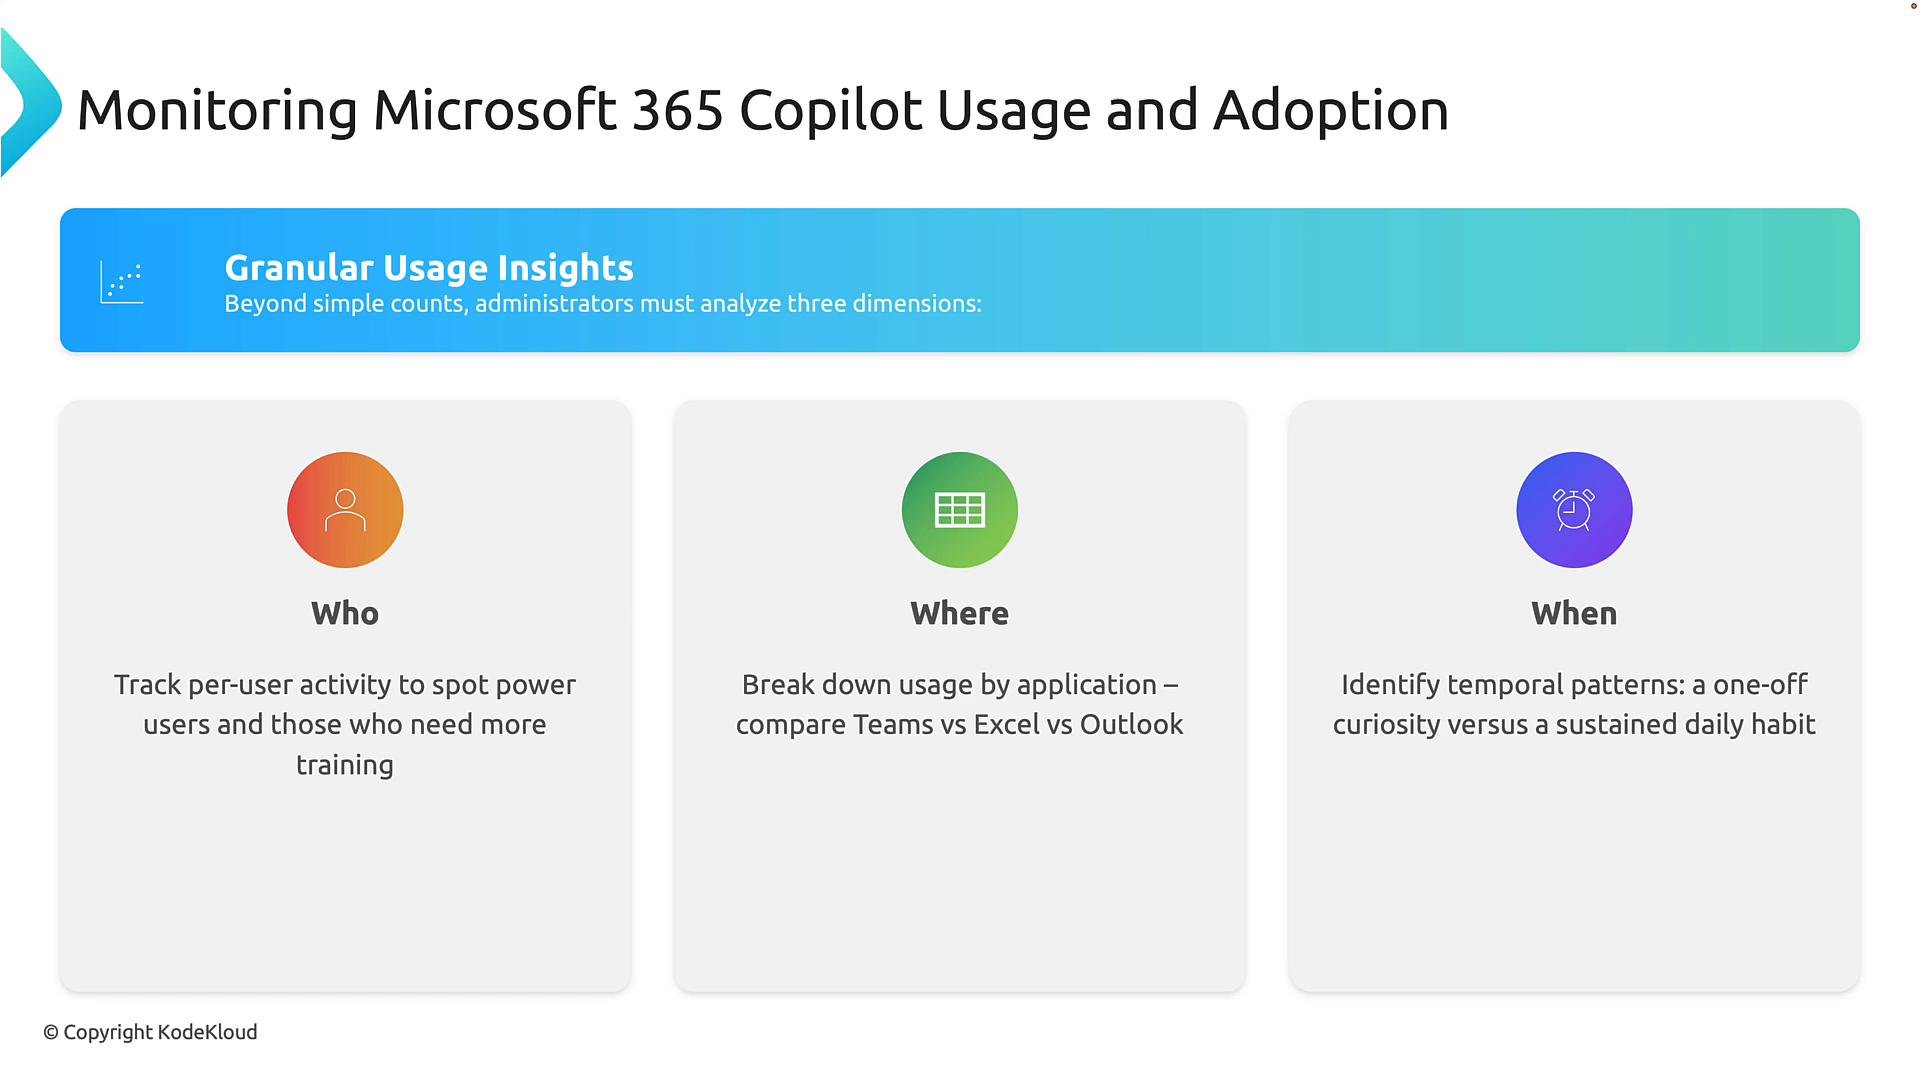
  • Who — Per-user activity: identify power users who get the most value and users who may need additional support or targeted training.
  • Where — Application breakdown: see which Microsoft 365 apps (Teams, Outlook, Word, Excel, etc.) are used with Copilot to understand where AI is driving productivity.
  • When — Temporal patterns: determine whether usage is becoming a daily habit or remains occasional experimentation; identify peak times or seasonal trends.
Use these dimensions together to prioritize adoption programs, expand deployments where value is proven, and design targeted enablement where adoption lags.
A presentation slide titled "Monitoring Microsoft 365 Copilot Usage and Adoption" with a "Granular Usage Insights" banner. Below are three cards labeled "Who," "Where," and "When," summarizing tracking per-user activity, breaking down usage by application, and identifying temporal patterns.

Advanced analytics: measuring business impact

Move beyond adoption counts and quantify how Copilot contributes to outcomes:
  • Feature metrics: measure outputs such as meeting summaries generated, emails condensed, or documents produced with AI assistance to tie usage to productivity gains.
  • Workplace trends: identify departments, teams, or roles that drive the most usage so you can replicate successful adoption patterns across the organization.
  • Reporting tools: turn raw activity data into business-relevant insights with dashboards and exportable reports for leadership.
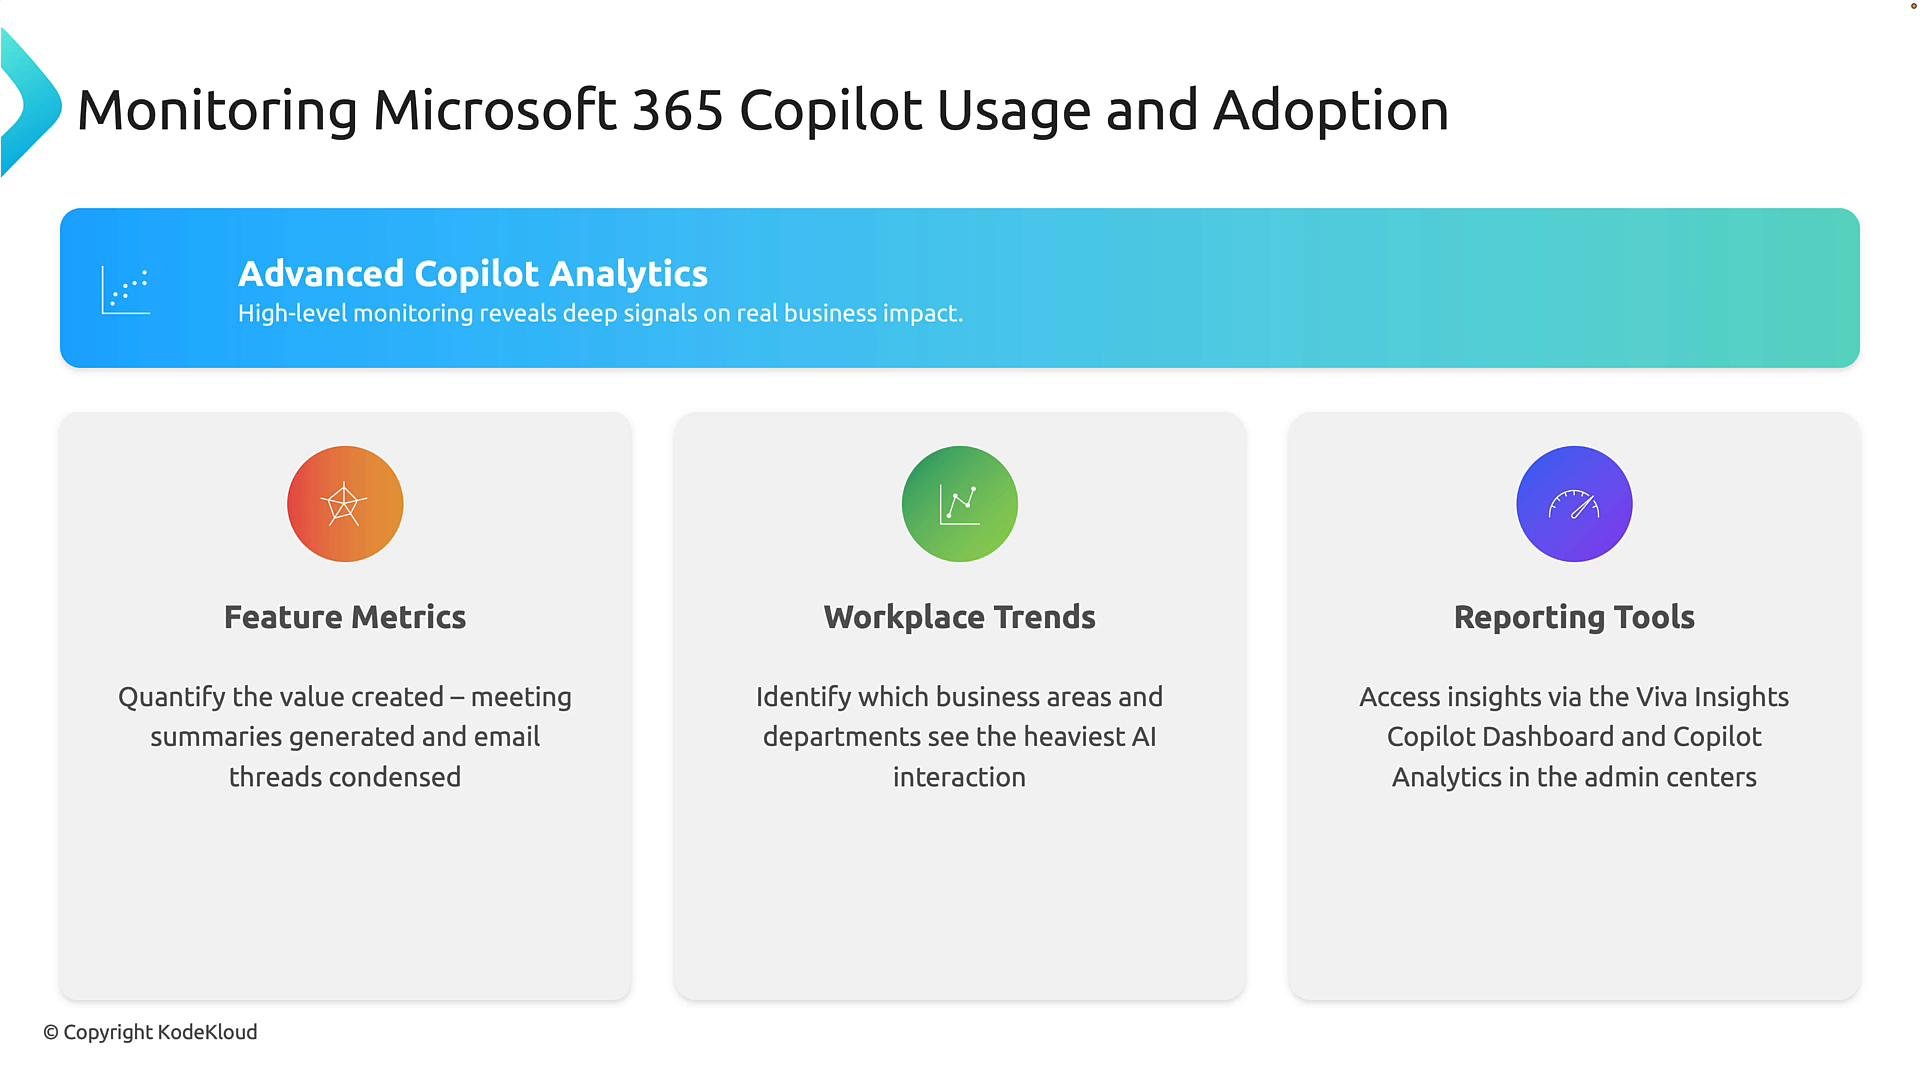
These analytics are surfaced through tools like Viva Insights, the Copilot Dashboard, and Copilot Analytics in the Microsoft admin and reporting portals. Together they let you move from measuring activity to measuring business value.
A presentation slide titled "Monitoring Microsoft 365 Copilot Usage and Adoption" showing a blue banner for "Advanced Copilot Analytics" and three feature cards: Feature Metrics, Workplace Trends, and Reporting Tools. Each card briefly summarizes analytics and reporting capabilities for Copilot adoption.
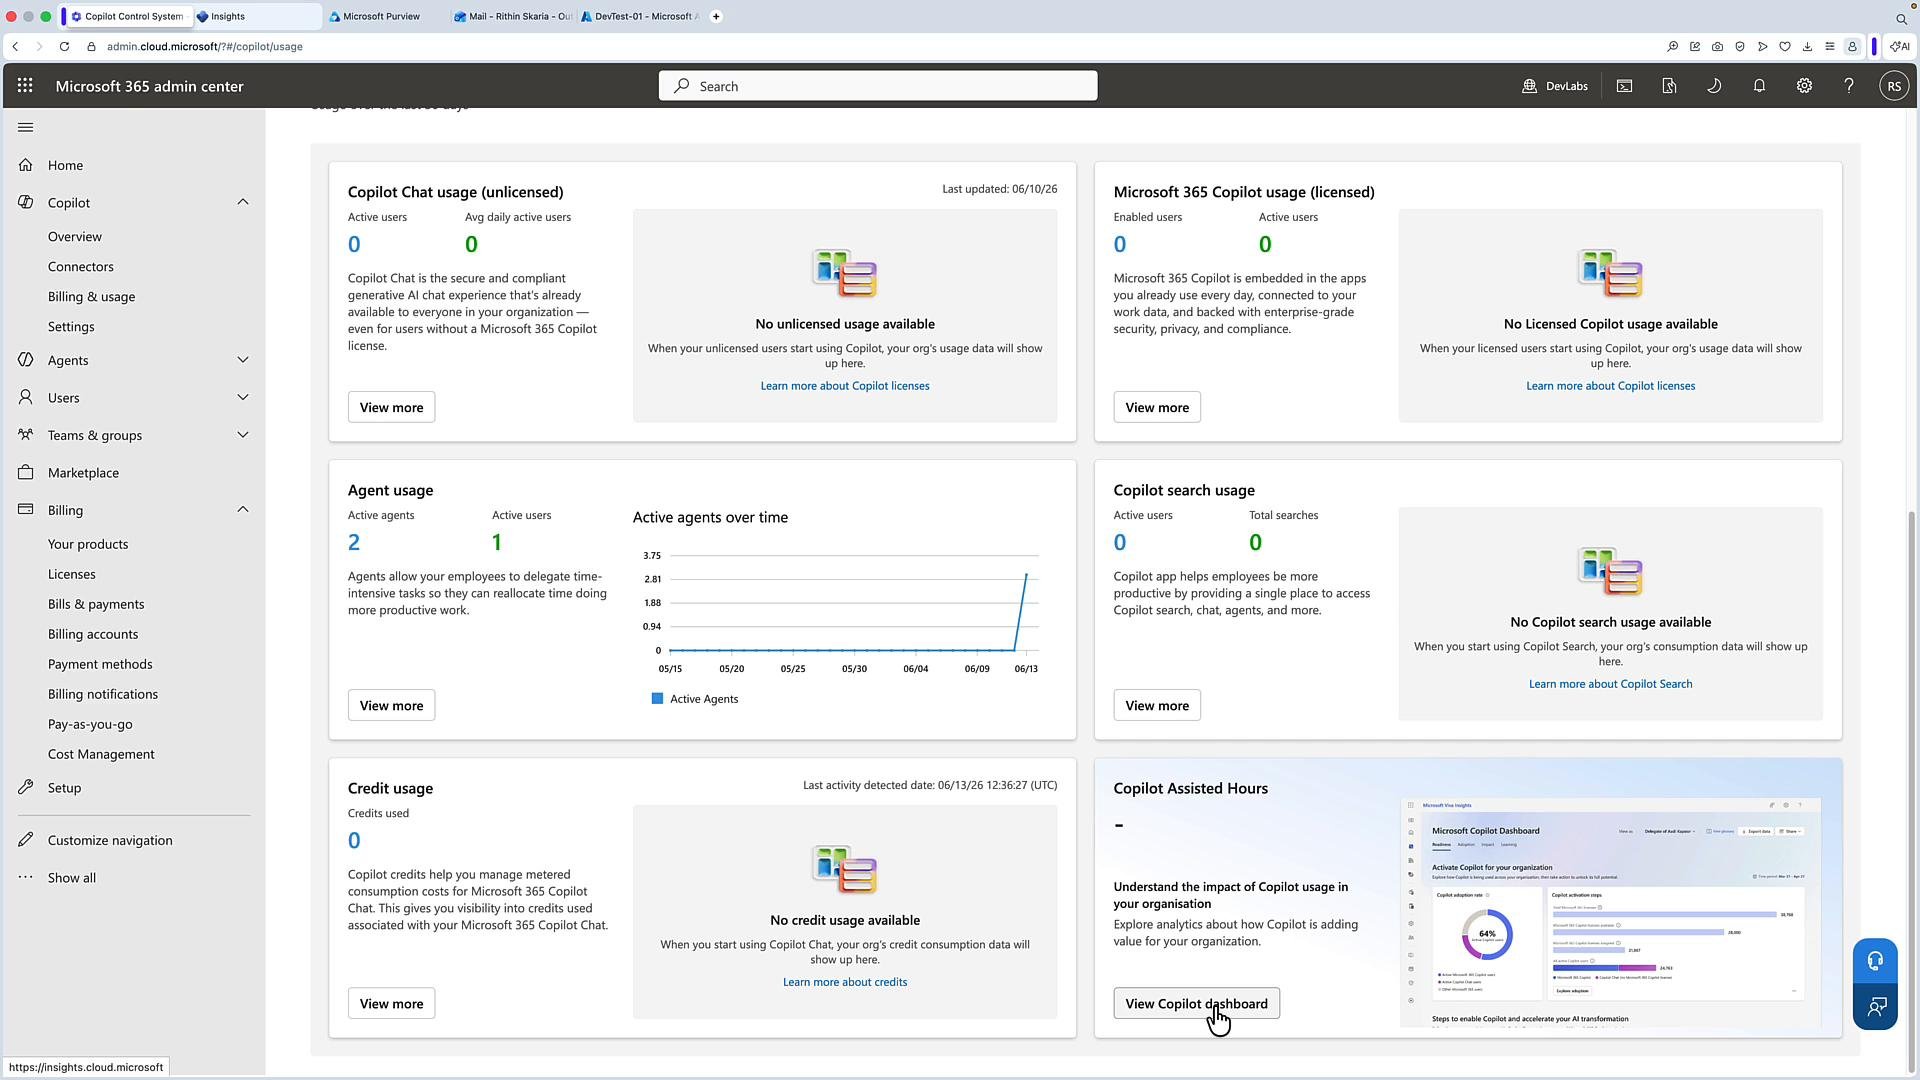
If your tenant lacks per-user Copilot licensing, you will still see basic adoption metrics in the admin center, but per-user and some feature-level analytics may be restricted or unavailable.

Where to find Copilot reports in the Microsoft 365 admin portal

From the Microsoft 365 admin center you can access Copilot usage reports and dashboards. Typical navigation:
  1. Sign into the Microsoft 365 admin center.
  2. Go to Copilot overview.
  3. Open Copilot Analytics > Usage.
The Usage view provides an adoption summary with metrics such as:
  • number of active users
  • active Copilot Chat users
  • Microsoft 365 users not using Copilot
  • licensed vs. unlicensed user counts
  • agent usage and search usage
  • credit consumption (where applicable)
If your tenant includes the Copilot Dashboard, it will provide richer visualizations and trend analysis. Viva Insights can also surface Copilot consumption within its reporting experiences, giving multiple perspectives on adoption.
A screenshot of the Microsoft 365 admin center displaying the Copilot usage dashboard with tiles for Copilot Chat (unlicensed), Microsoft 365 Copilot (licensed), agent usage, search usage, and credit usage. Most panels show zero or "no usage available" and there's a small active-agents-over-time chart.

Common Copilot usage metrics (summary table)

Best practices for adoption and cost control

  • Start with pilot groups to validate value and build internal champions.
  • Use adoption analytics to prioritize training for teams or roles with low engagement.
  • Review license assignments regularly: reassign or reduce licenses where enabled users remain inactive.
  • Combine quantitative reports with qualitative feedback (surveys, interviews) to understand blockers.
  • Monitor credit consumption and set alerts or policies if your tenant exposes metered usage.
Monitoring usage and adoption is essential to maximizing the return on your Microsoft 365 Copilot investment. Use the foundational metrics (enabled vs. active users), the who/where/when dimensions, and the admin analytics tools to build evidence-based adoption plans and manage licensing cost-effectively.

Watch Video