In this article, we walk through a practical lab solution for managing Kubernetes services. We cover listing services, inspecting service details, reviewing deployments, and exposing a web application using a NodePort service. This guide is ideal for Kubernetes administrators and developers looking to understand service management in-depth.

Listing Kubernetes Services

To determine how many services exist on the system, run the following commands:
You can also use the shorthand:
The output is similar to:
This output confirms that only one service exists—the default Kubernetes service. You can verify this with both commands:
The default service is automatically created by Kubernetes and represents the API server.

Checking the Service Type

From the output, you can observe that the service type is ClusterIP:
Later, we will explore the role of the API server in more detail. For now, think of this service like any other Kubernetes service you create.

Determining the Target Port

Next, we determine the target port configured on the Kubernetes service by using the kubectl describe command:
This output shows that the service receives traffic on port 443 and forwards it to the target port 6443.

Examining Service Labels

Review the labels configured on the Kubernetes service by examining its description. You will see two labels:
  • component: apiserver
  • provider: kubernetes
These labels confirm that this service is associated with the Kubernetes API server. For more detailed insights, especially in preparation for the Certified Kubernetes Application Developer (CKAD) exam, further examination of the API server is recommended.

Inspecting Service Endpoints

Endpoints represent the Pod IPs where the service directs traffic. To inspect them, run:
The output confirms there is one endpoint: 10.53.180.9:6443.

Understanding Endpoints

Endpoints are dynamically determined based on the labels and selectors defined in a service specification. When a service is created, it monitors Pods that match its specified selector. If there is a misconfiguration, the service could unintentionally attach extra endpoints, or conversely, none at all if labels are mismatched. In our example, the service directs traffic to a single endpoint.

Exploring Deployments

Next, let’s examine the deployments in the default namespace.

Counting Deployments

List the deployments with:
The output shows that there is one deployment deployed.

Checking the Container Image

To verify the container image used within the deployment, inspect the deployment details:
The container image used is kodekloud/simple-webapp:red.

Accessing the Web Application UI

Attempting to access the web application UI may result in a “bad gateway” error. This occurs because there is no service defined to expose the web application.
Without a proper service configuration, your web application will remain inaccessible externally.
To resolve this, you need to create a new service using a service definition file.

Creating a Service for the Web Application

Below is a template for a service definition:
For reference, the Kubernetes documentation offers sample YAML definitions. An example is:
For our web application, update the service definition with the following parameters:
  • Name: webapp-service
  • Type: NodePort
  • Port: 8080
  • TargetPort: 8080
  • NodePort: 30080
  • Selector: name: simple-webapp
The complete YAML definition is:
After saving this definition (for example, as service-definition-1.yaml), verify the file content:
Open the file with your preferred editor:
Create the service with:
Now, you can access the web application using the newly created service. In future lessons, we will also explore imperative commands to create services. For example, try the following commands:

Visualizing Service Endpoints

For a better understanding of how services direct traffic to Pods, consider the following hand-drawn diagram. It illustrates a service directing traffic to three distinct Pods labeled “app: FE” and “app: FG”:
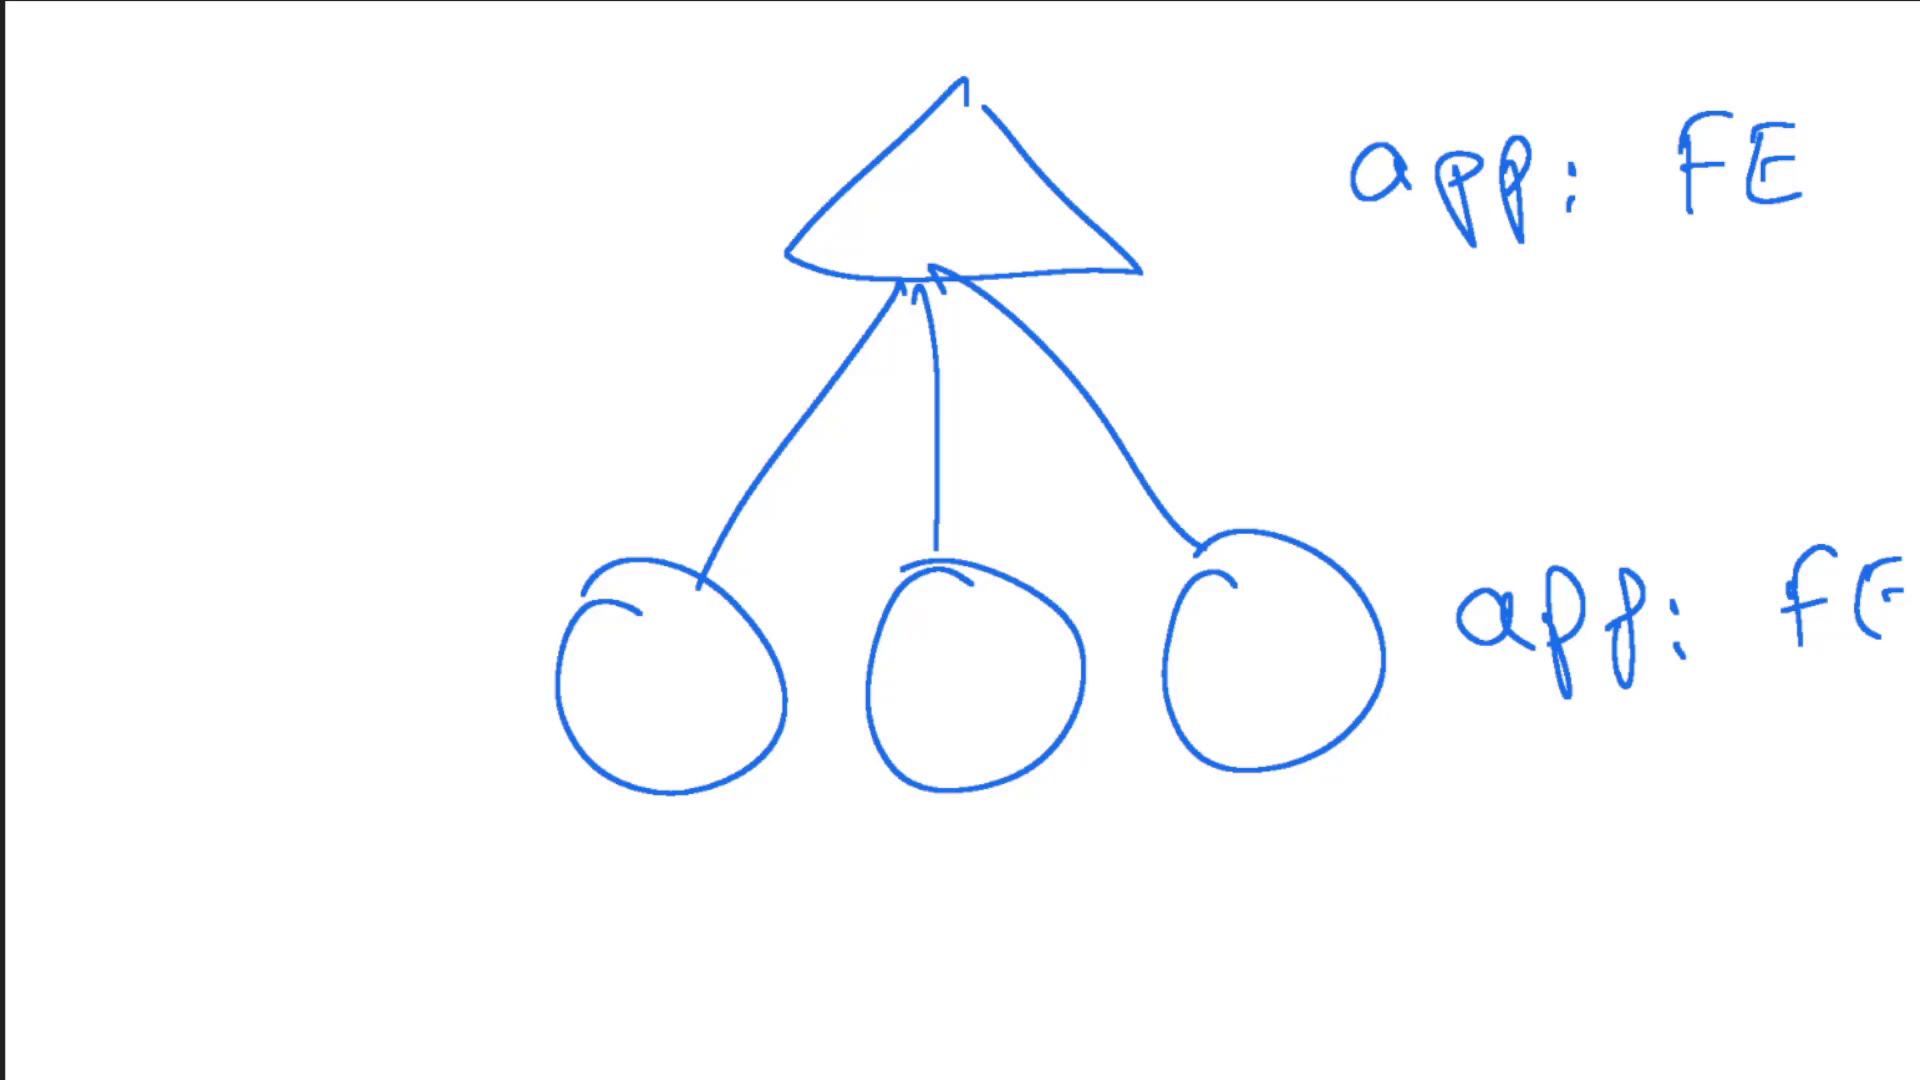
A hand-drawn diagram with a triangle connected to three circles, labeled "app: FE" and "app: FG" on the side.
This visual representation reinforces how the service uses endpoints to direct incoming traffic to the correct Pods. That concludes this lab. By following these steps, you now know how to list services, inspect service configurations and endpoints, review deployments, and expose a web application via a NodePort service in Kubernetes.

Watch Video