

Original Unit Testing Stage
For reference, here is the original unit testing stage from your Jenkinsfile:npm run coverage in a new stage.
Pipeline Behavior with Code Coverage Failure
After committing your changes, a new pipeline (e.g. build #17) is triggered where the code coverage stage might fail if the coverage percentage is below the global threshold (e.g. 79% instead of 90%). The following image shows a Jenkins pipeline interface for the “solar-system” project with a failed code coverage step: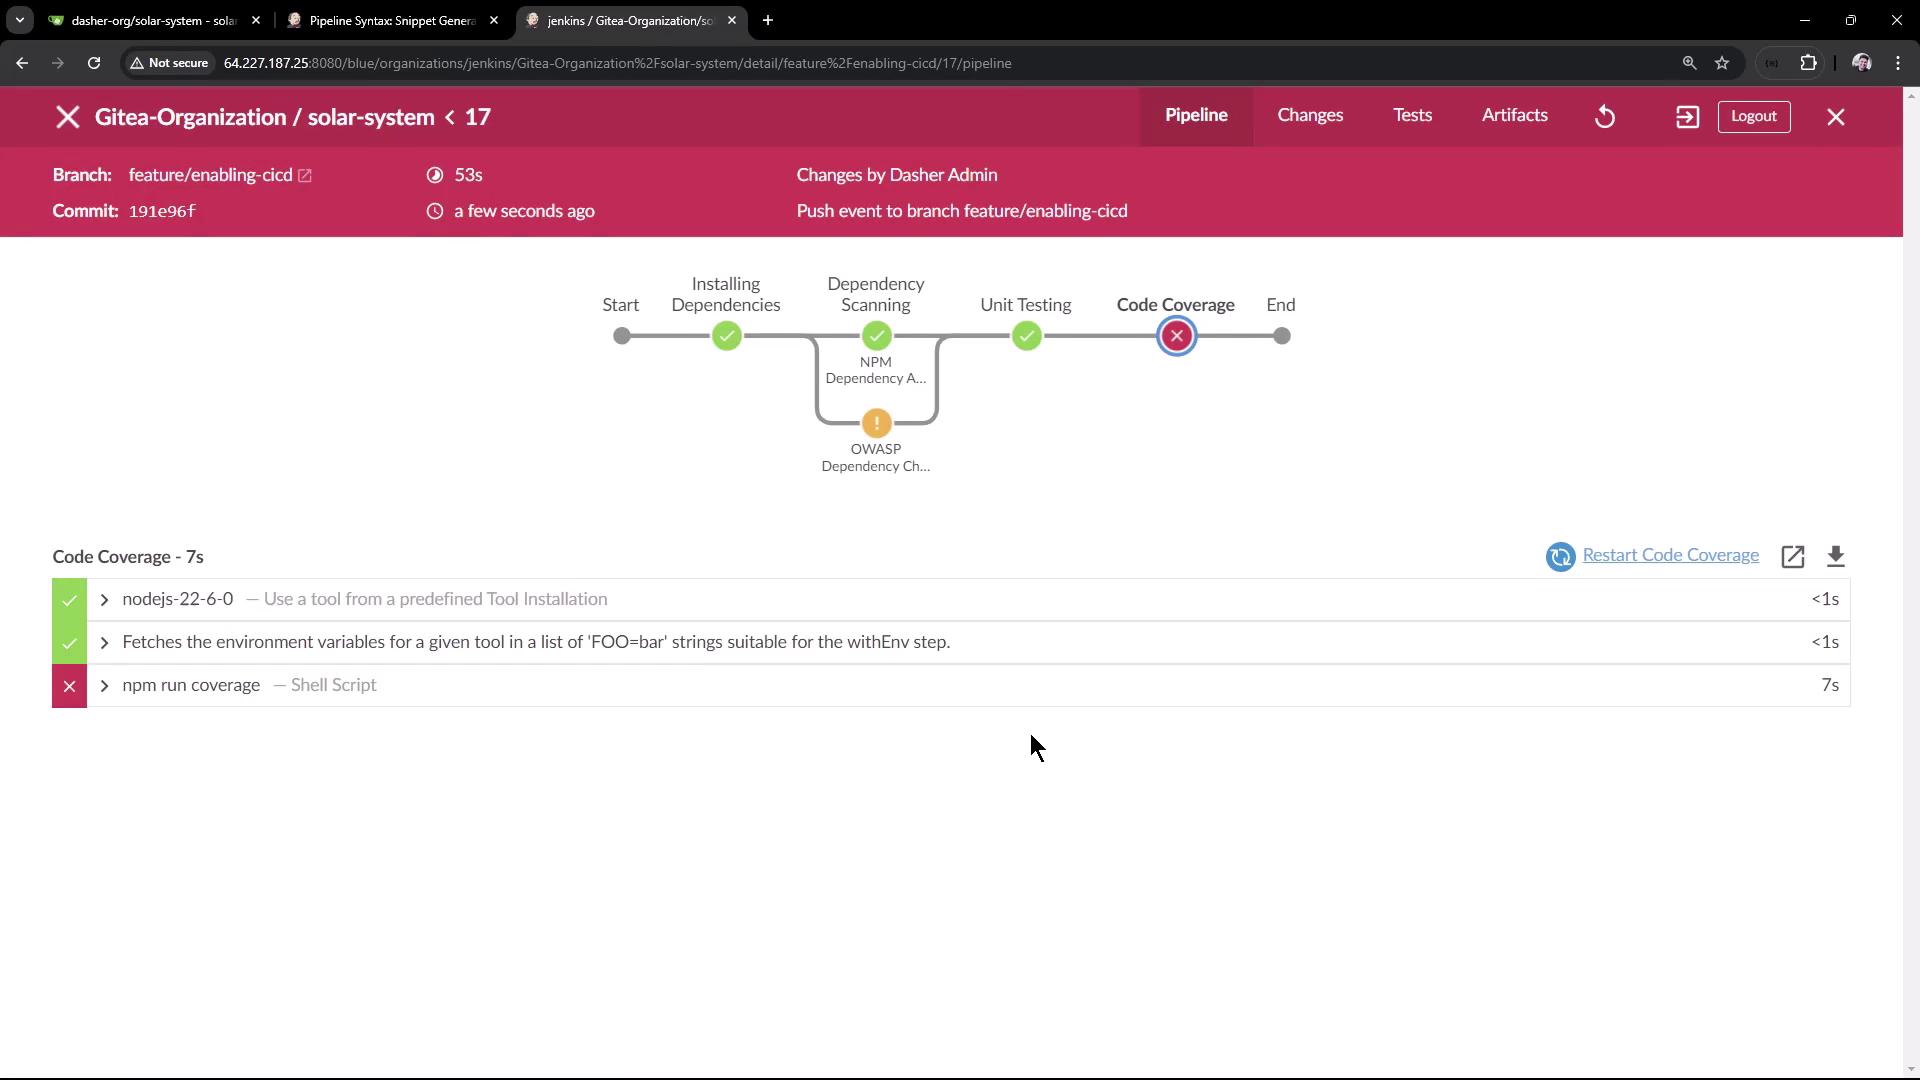
catchError step.
Using catchError to Handle Failures
ThecatchError step can catch exceptions and allow you to specify a custom message, as well as setting the build status to success while marking the specific stage as unstable. Here is a basic snippet demonstrating how to use catchError:
catchError within a node block:
In the
catchError block, you have the option to customize the error message and control both the build and stage results.Updated Code Coverage Stage in Jenkinsfile
Below is the updated “Code Coverage” stage, where the code coverage command is wrapped within acatchError block. This configuration marks the stage as unstable while allowing the build to succeed. Additionally, an HTML report is published after running the coverage command.
npm run coverage, the log output shows a failure due to low coverage:
Even though the
npm run coverage command outputs an error message for failing the coverage threshold, the catchError block ensures that the build proceeds and the stage is marked as unstable.Dashboard and HTML Coverage Report
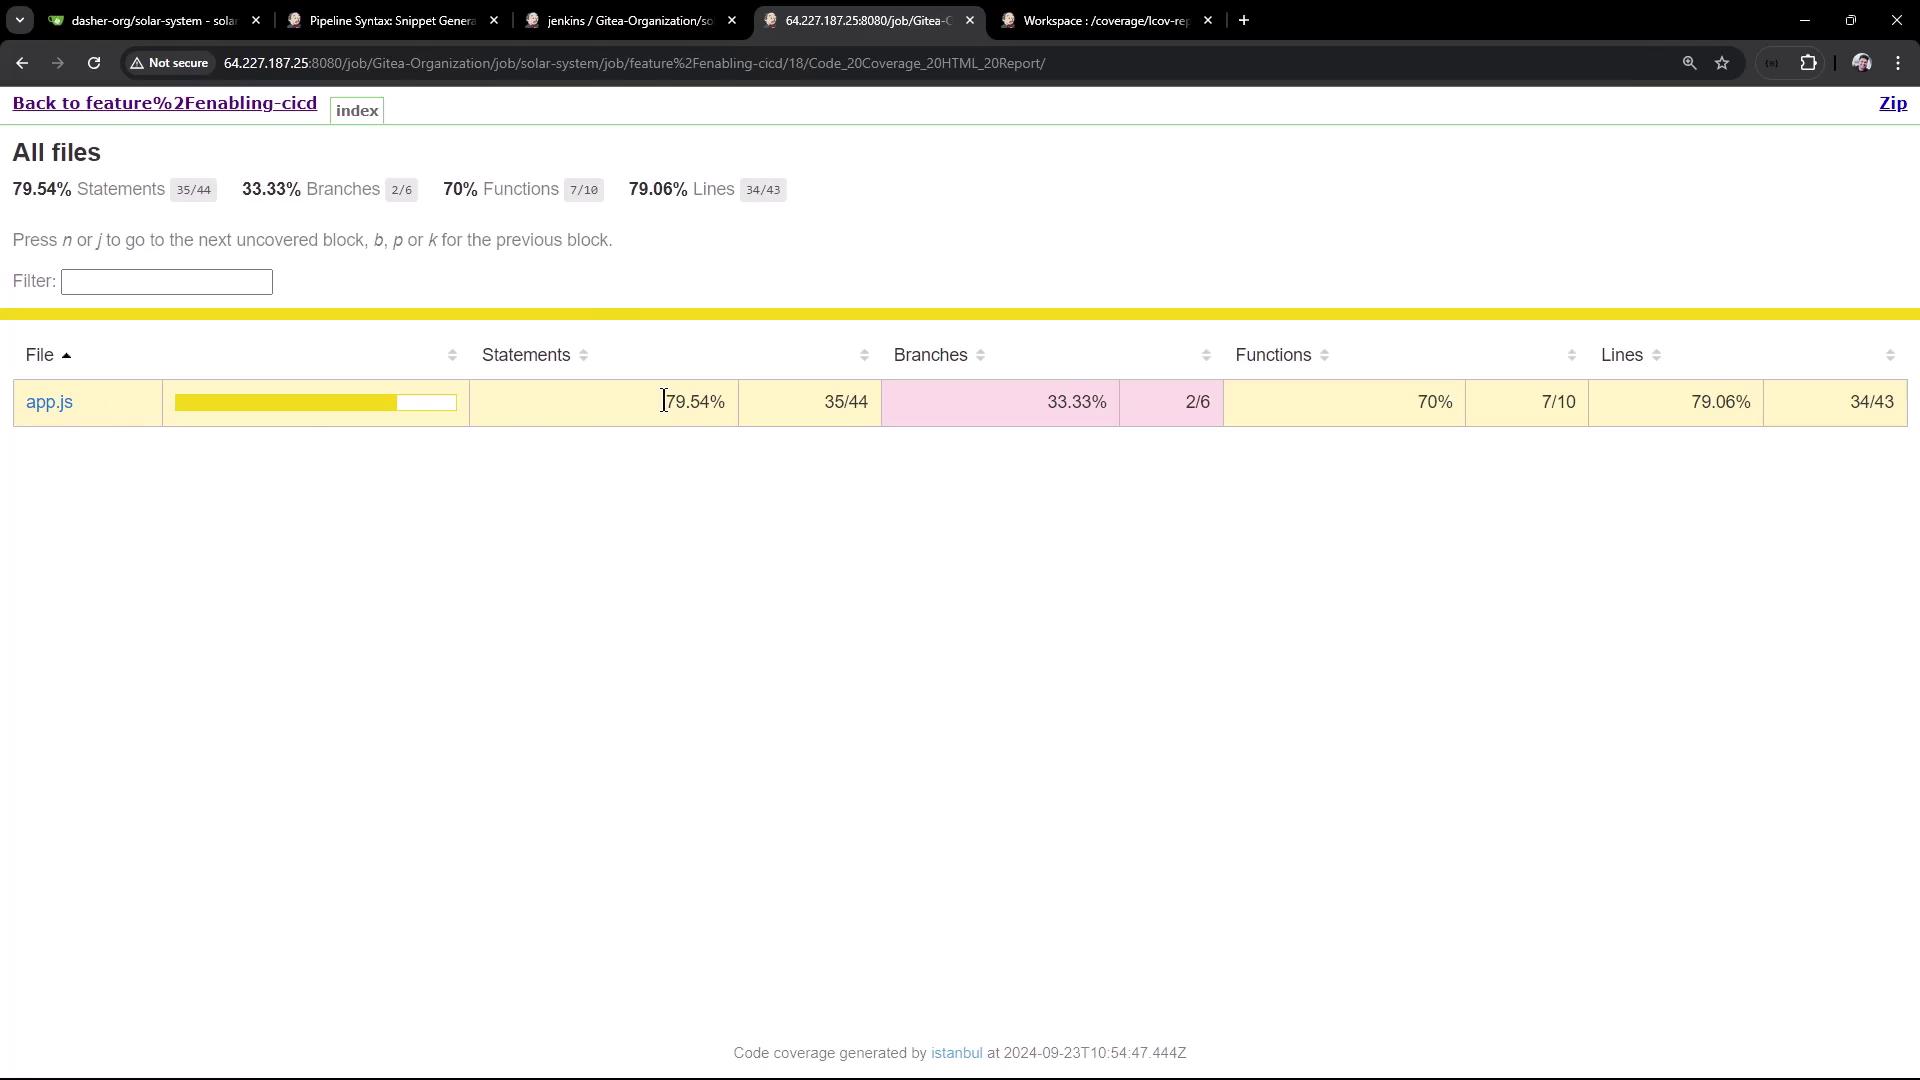
After the changes, a new build is triggered. The dashboard now displays the build status accordingly. For example, the dashboard below shows the list of recent builds for the “solar-system” project, including each build’s status, run number, commit ID, branch, message, duration, and completion time:
Conclusion
By configuring the pipeline to use thecatchError step, you ensure that code coverage errors do not block the overall build process. The stage is marked as unstable, and crucial reports, such as the HTML coverage report, remain available for further analysis. This approach not only minimizes build disruptions but also provides detailed insights into code quality and testing coverage.
For more on Jenkins pipelines and CI/CD best practices, check out the following resources:
Thank you for reading this guide on configuring code coverage with error handling in Jenkins pipelines.