Introduction to Java Melody
Java Melody is a dedicated monitoring solution that tracks performance and resource usage in Java applications. By capturing real-time statistics based on user interactions, it provides valuable insights into application operations. Since Jenkins is built on Java, Java Melody is an excellent tool for keeping an eye on its performance and resource utilization.Configuring Monitoring in Jenkins
To integrate Java Melody with Jenkins, install the Monitoring plugin. After installation and a controller restart, Jenkins monitoring becomes available. For advanced configurations, refer to the Monitoring Plugin documentation.
Accessing the Monitoring Dashboard
After installing the Monitoring plugin:- Navigate to “Manage Jenkins” within the Jenkins interface.
- Scroll down to locate the options for “Monitoring of Jenkins Instance” and “Monitoring of Jenkins Agents.”
Monitoring the Jenkins Controller
On your main Jenkins controller (Jenkins Controller 1), you can access essential performance metrics such as used memory, CPU allocation, active HTTP sessions, and more.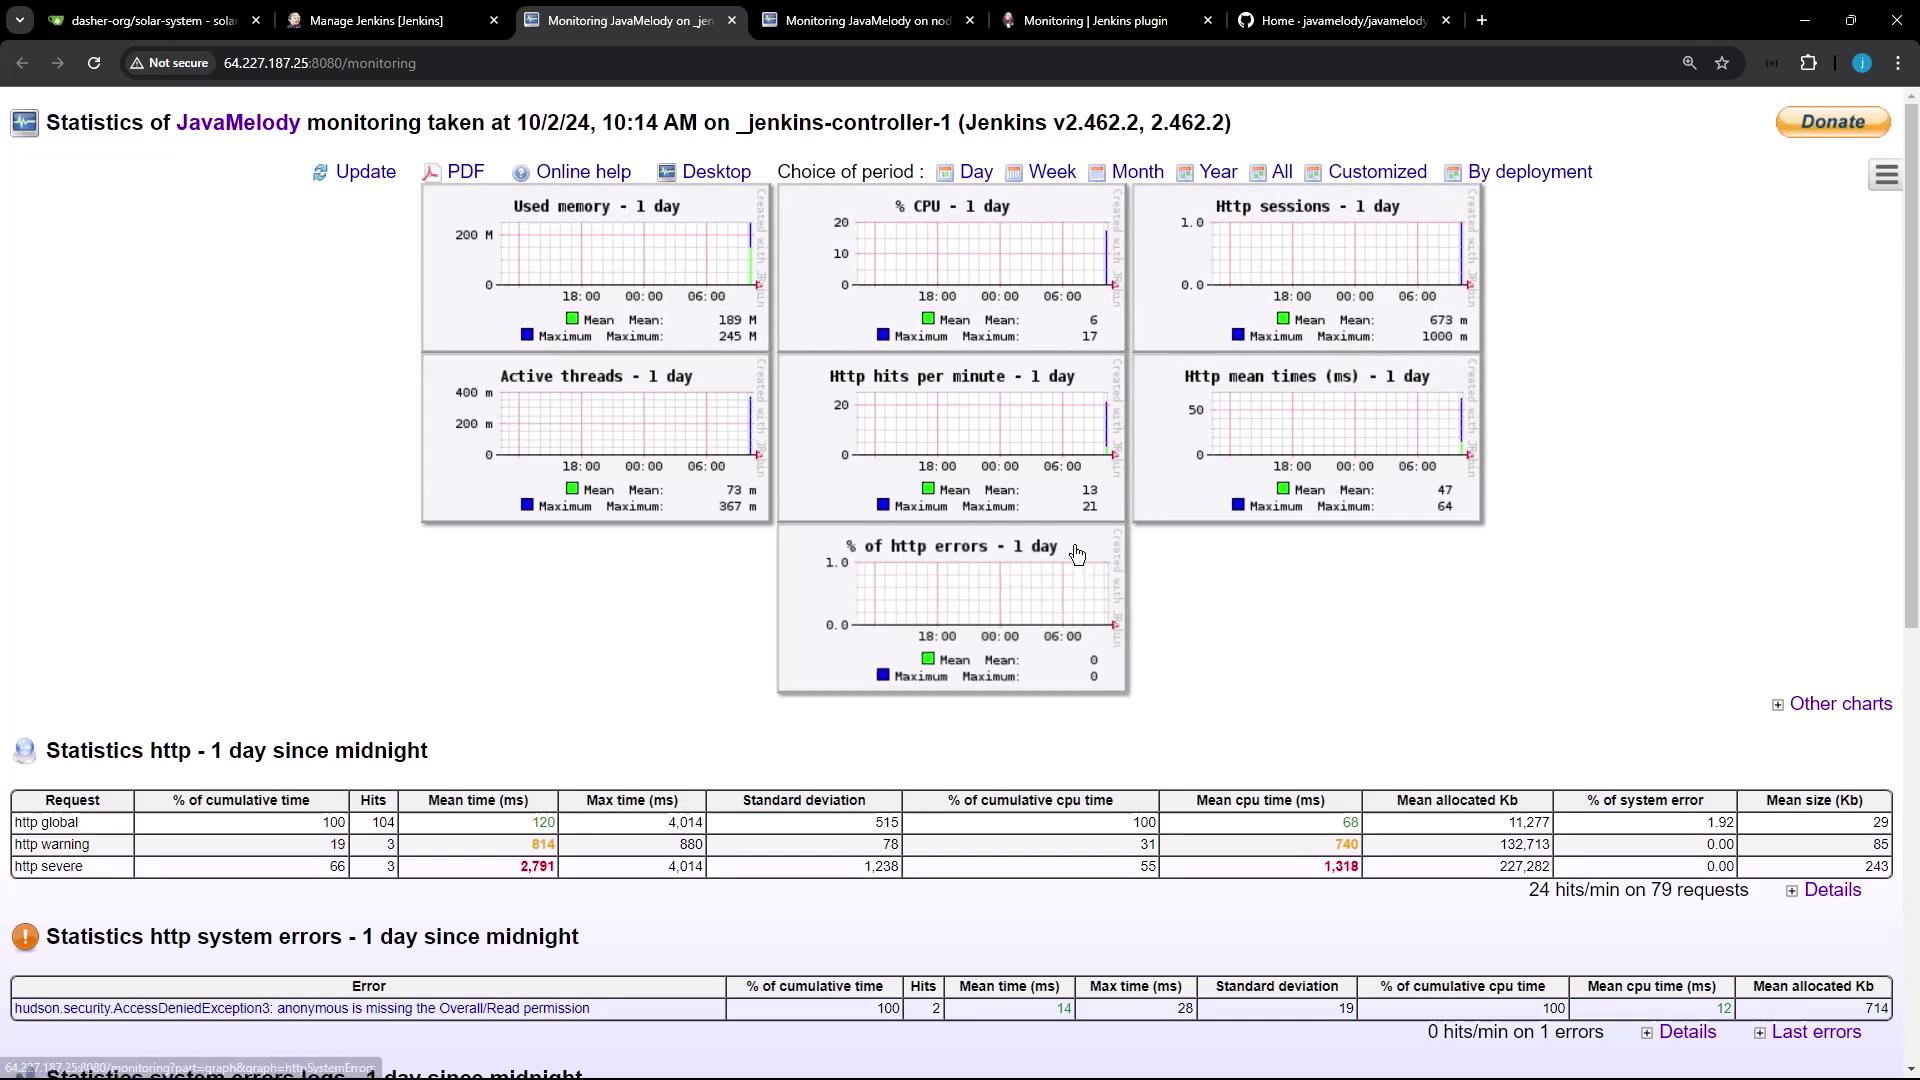
Monitoring Jenkins Nodes
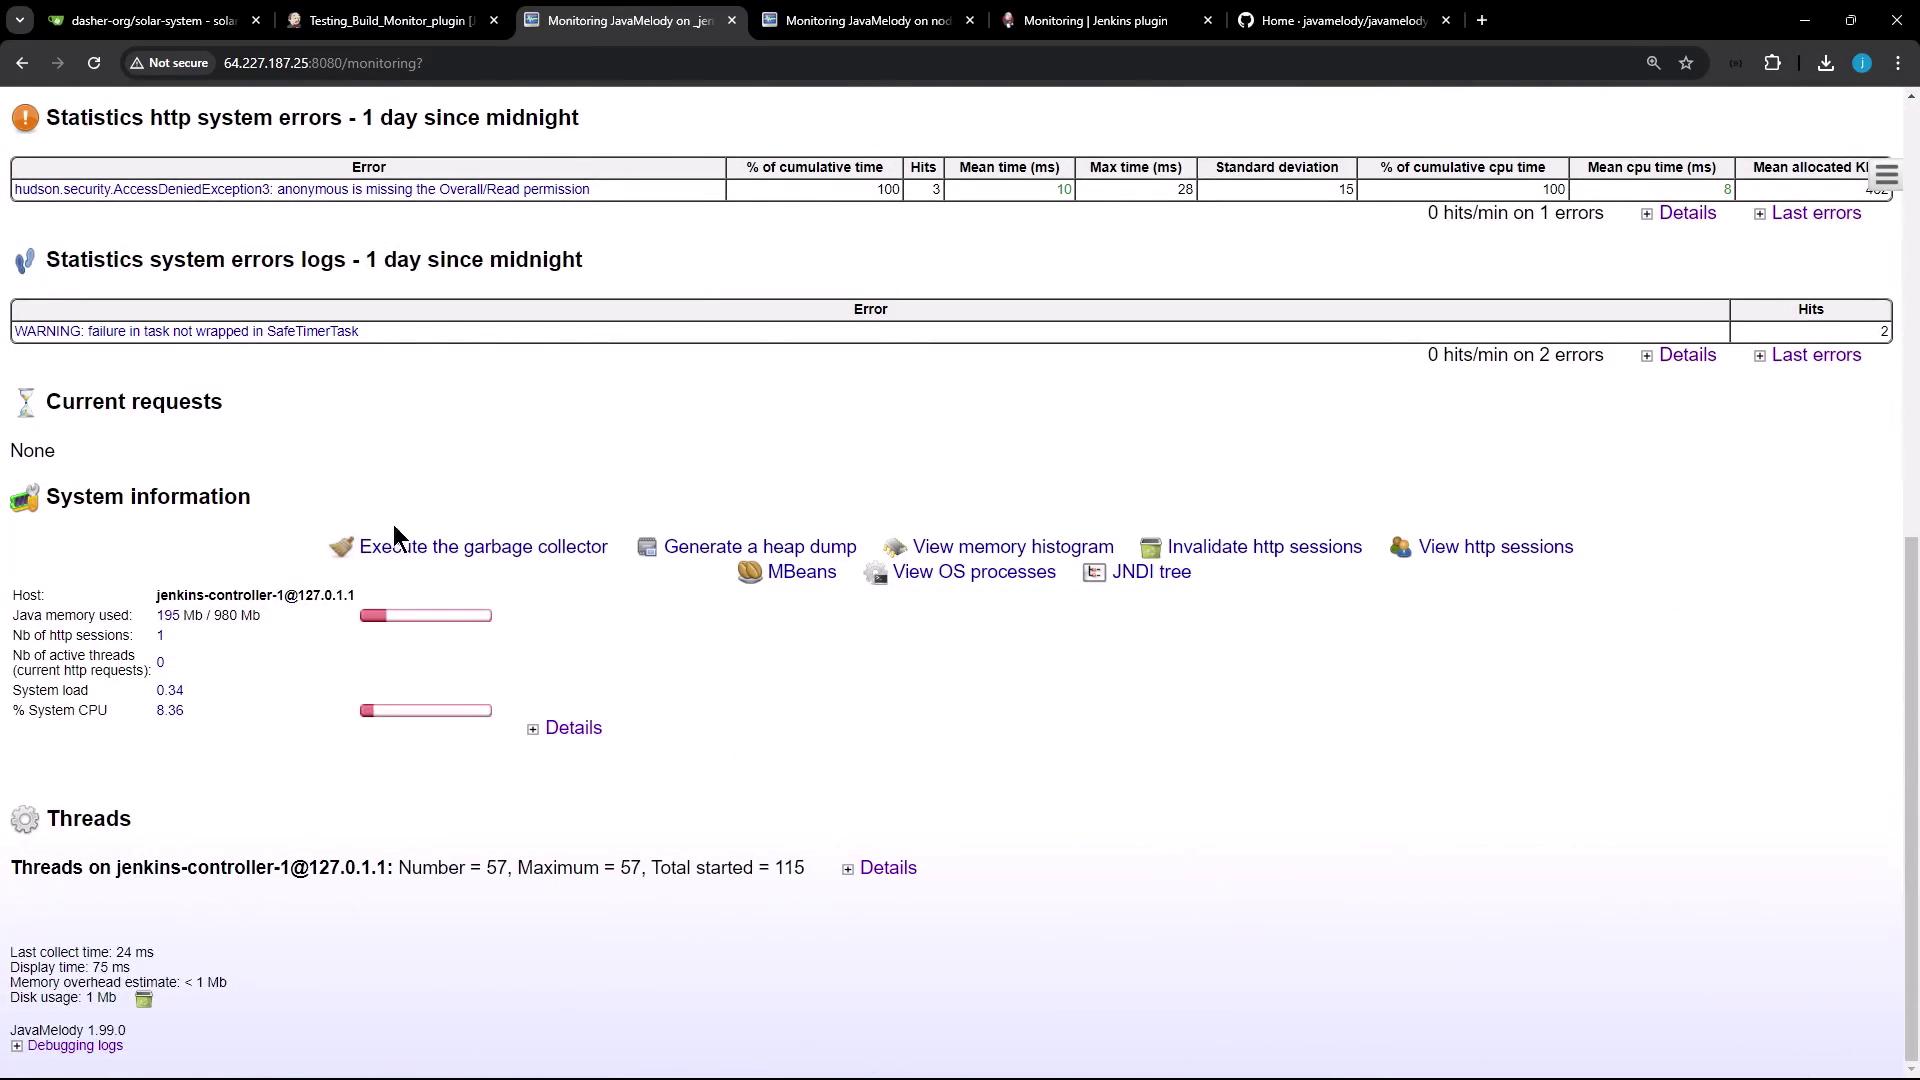
In addition to the main controller, Jenkins nodes can also be monitored. In single-node environments, the dashboard may present limited data; however, it still offers essential functionalities such as:- Executing the garbage collector
- Generating heap dumps
- Viewing the memory histogram
- Inspecting active HTTP sessions (complete with details like country, browser, and user)

For single-node setups, while the available monitoring information might be limited compared to multi-node environments, the essential details for system health and performance are still readily accessible.
Monitoring Build Jobs
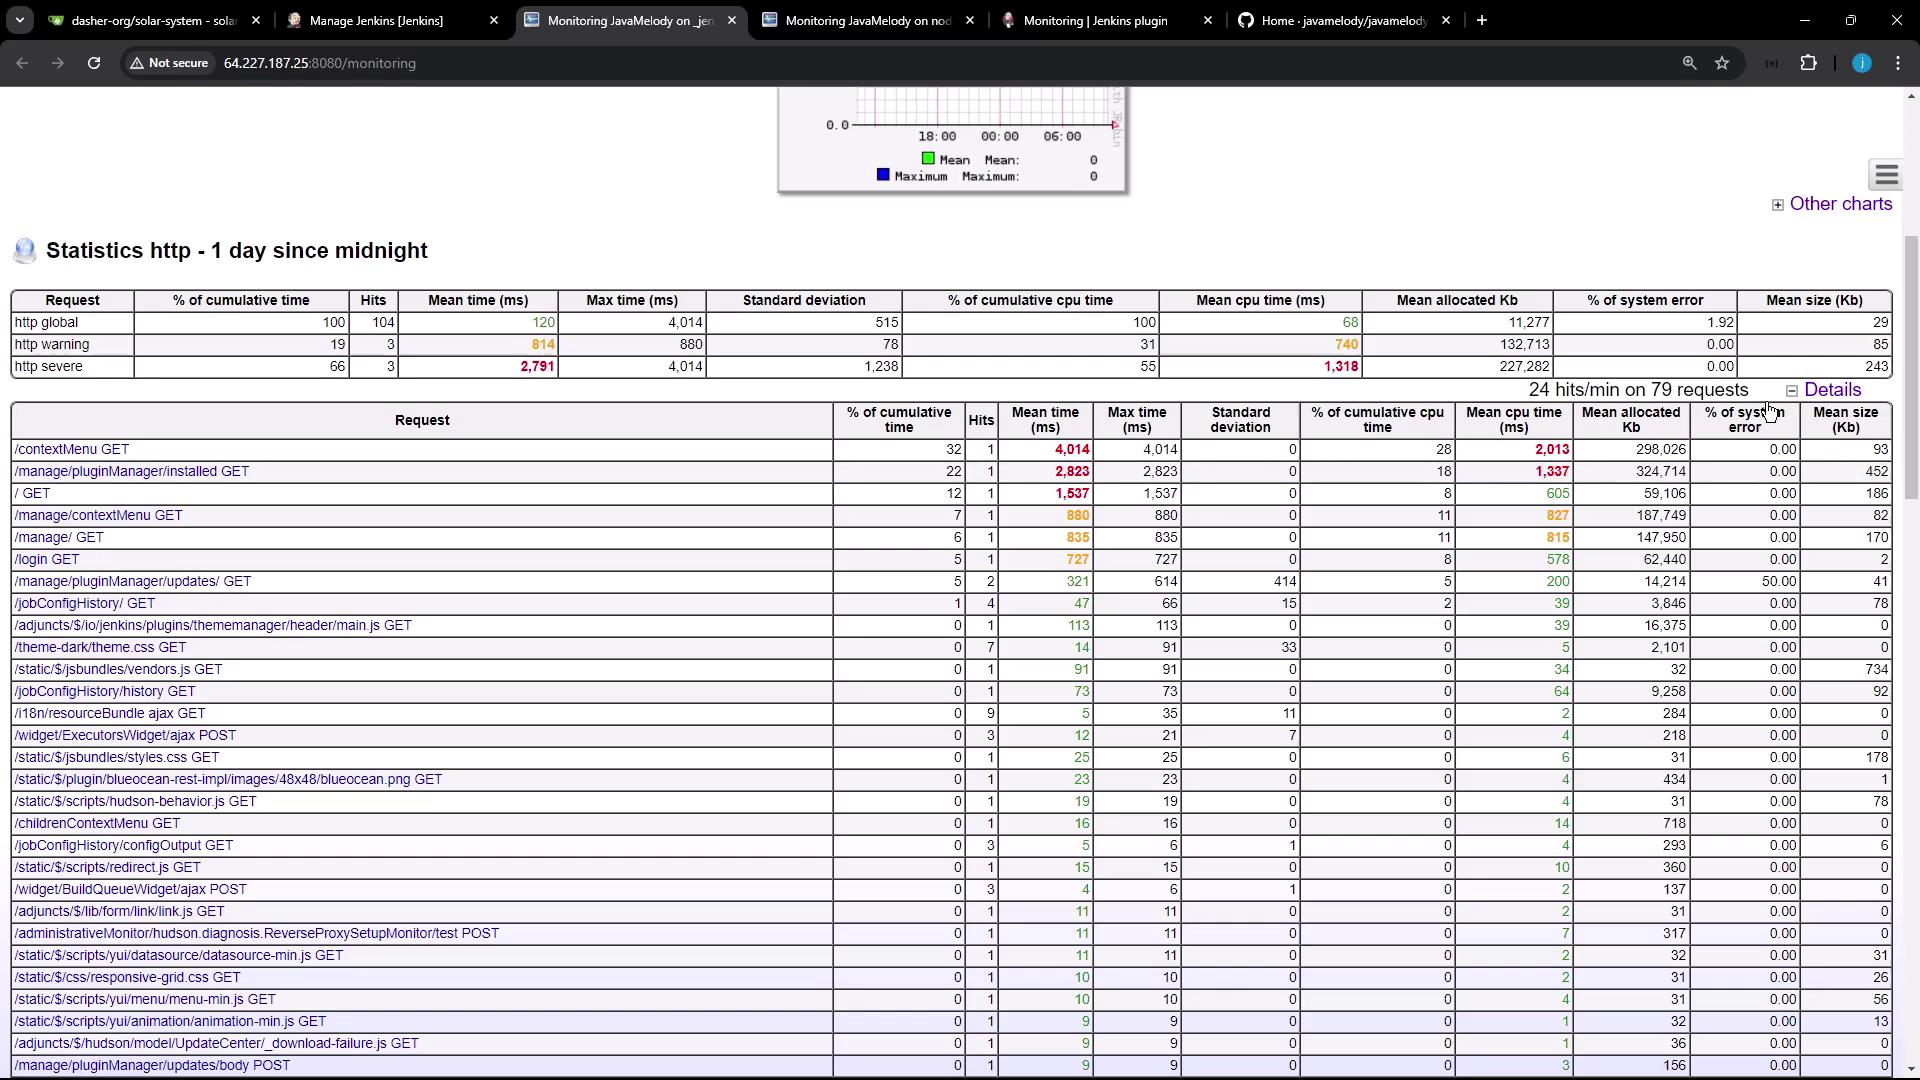
To view real-time monitoring data, trigger a Jenkins job such as the “test build monitoring plugin” job. For example, a stage in the job can introduce a 60-second delay, during which the dashboard refreshes to display live updates.