This article covers performing Static Application Security Testing using SonarQube, including project setup, integration with Jenkins, and handling code coverage reports.
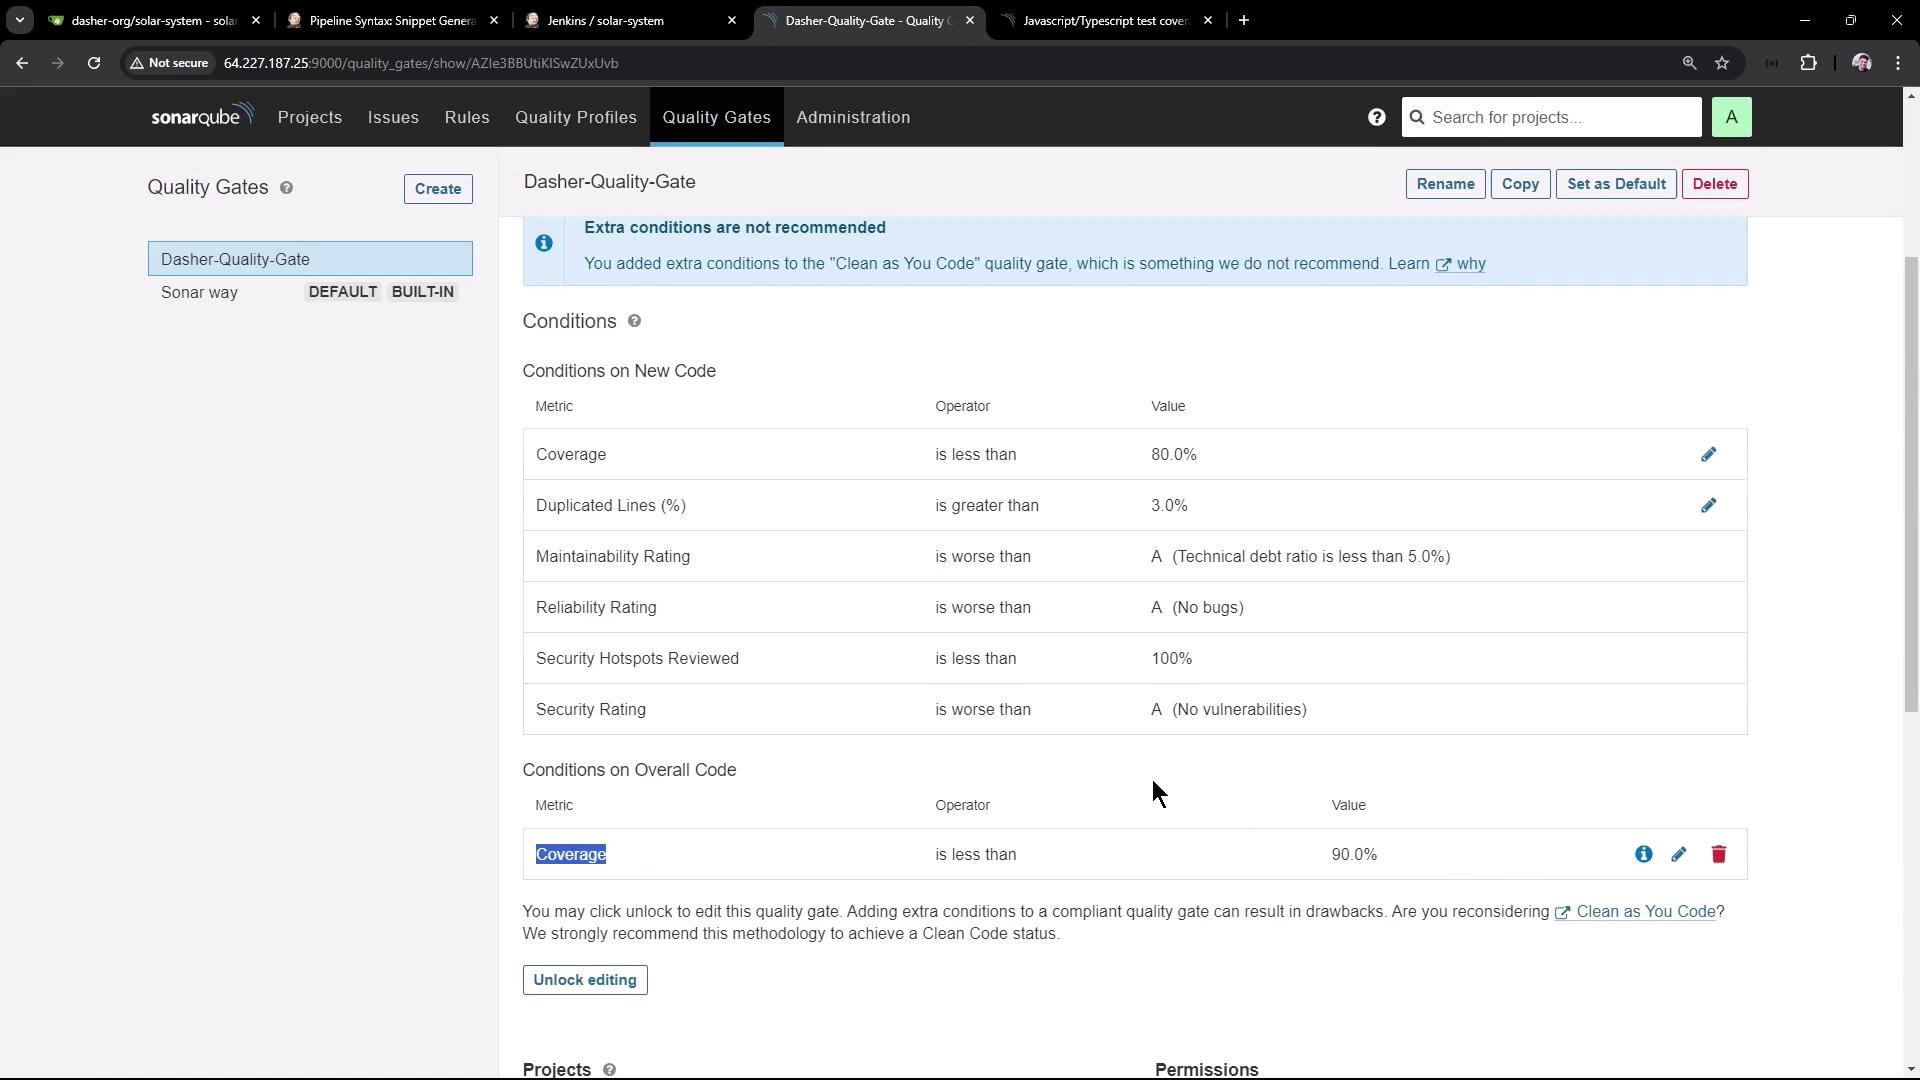
In this lesson, we perform Static Application Security Testing (SAST) using SonarQube. The SonarQube instance is already set up on a virtual machine and is accessible via port 9000. Initially, the SonarQube interface shows that there are no projects, and the default “Dasher” quality gate is active. This quality gate enforces conditions such as requiring at least 90% code coverage—any project falling below this threshold will fail.
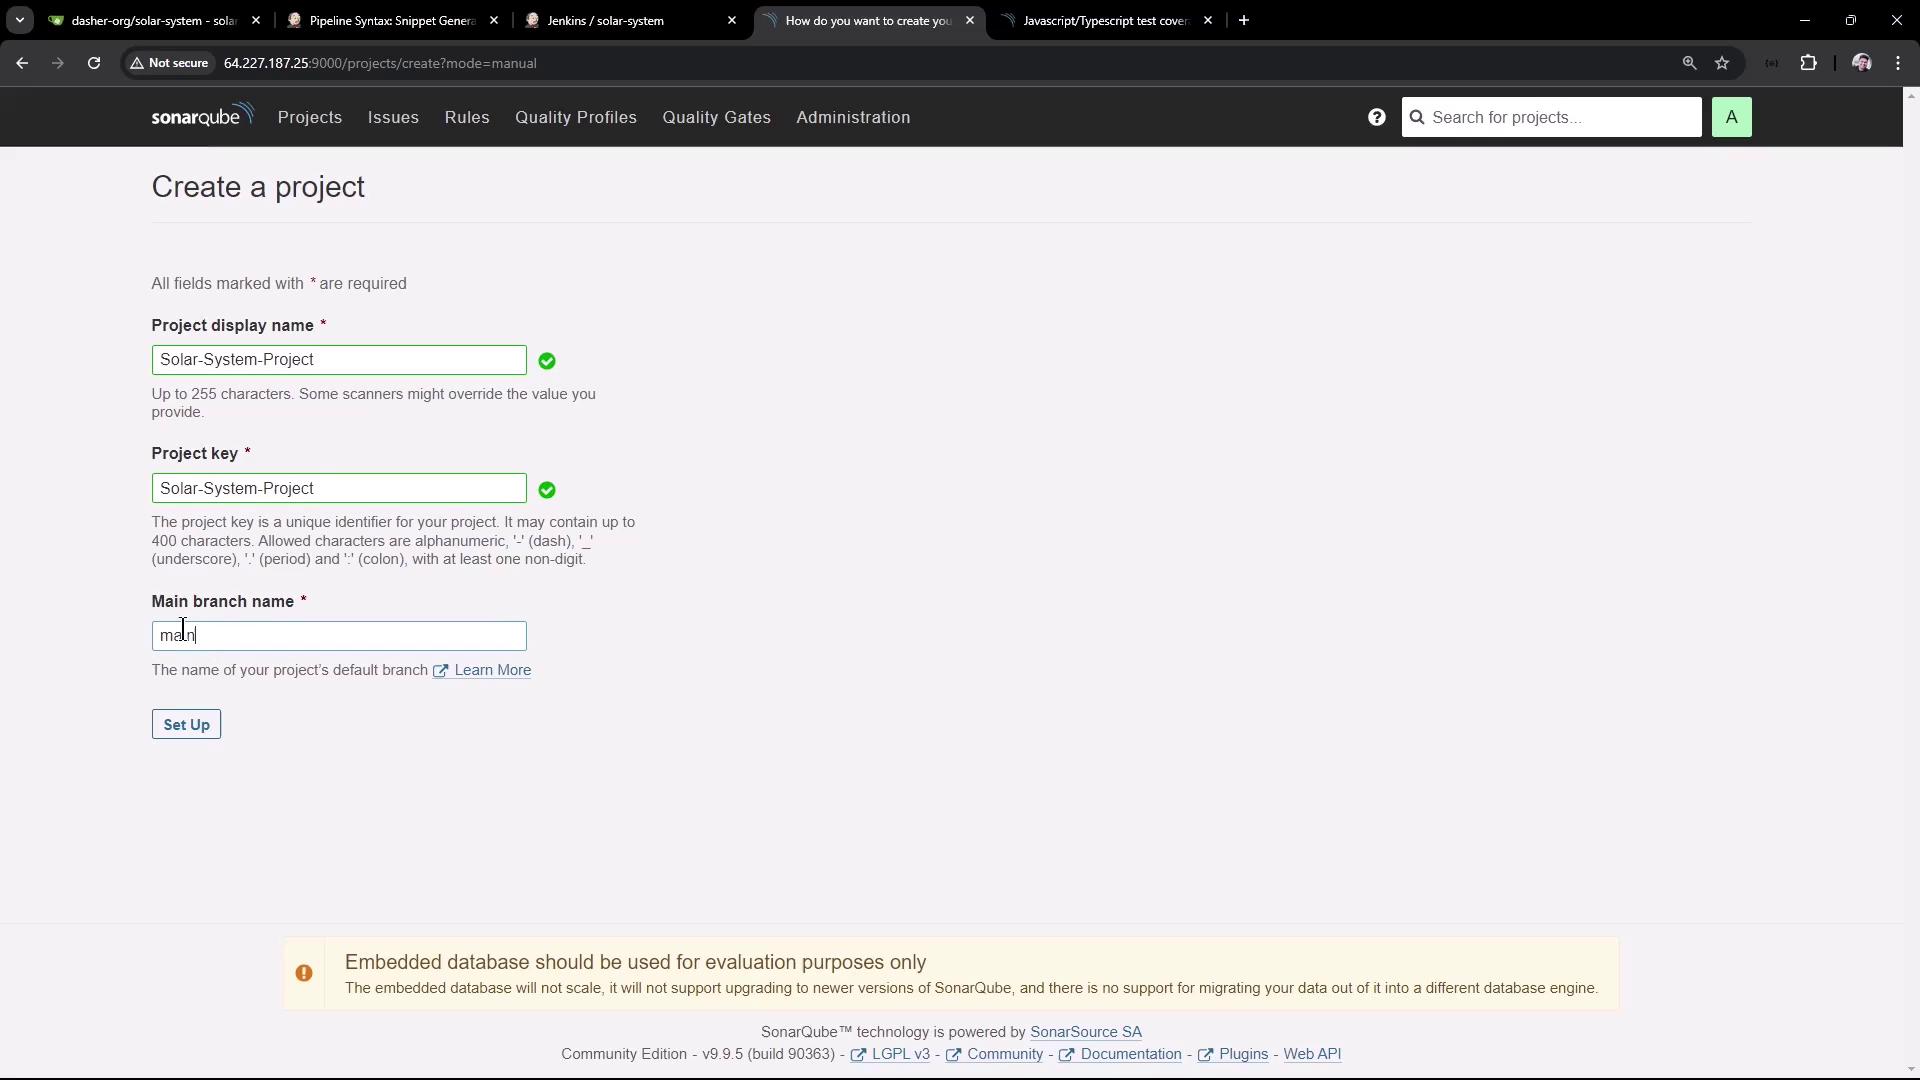
We begin by manually creating a new project. For this demonstration, the project is named “Solar System Project” with the main branch named “main.” Although integration with various CI/CD tools is available, we will use a local setup for this demo.
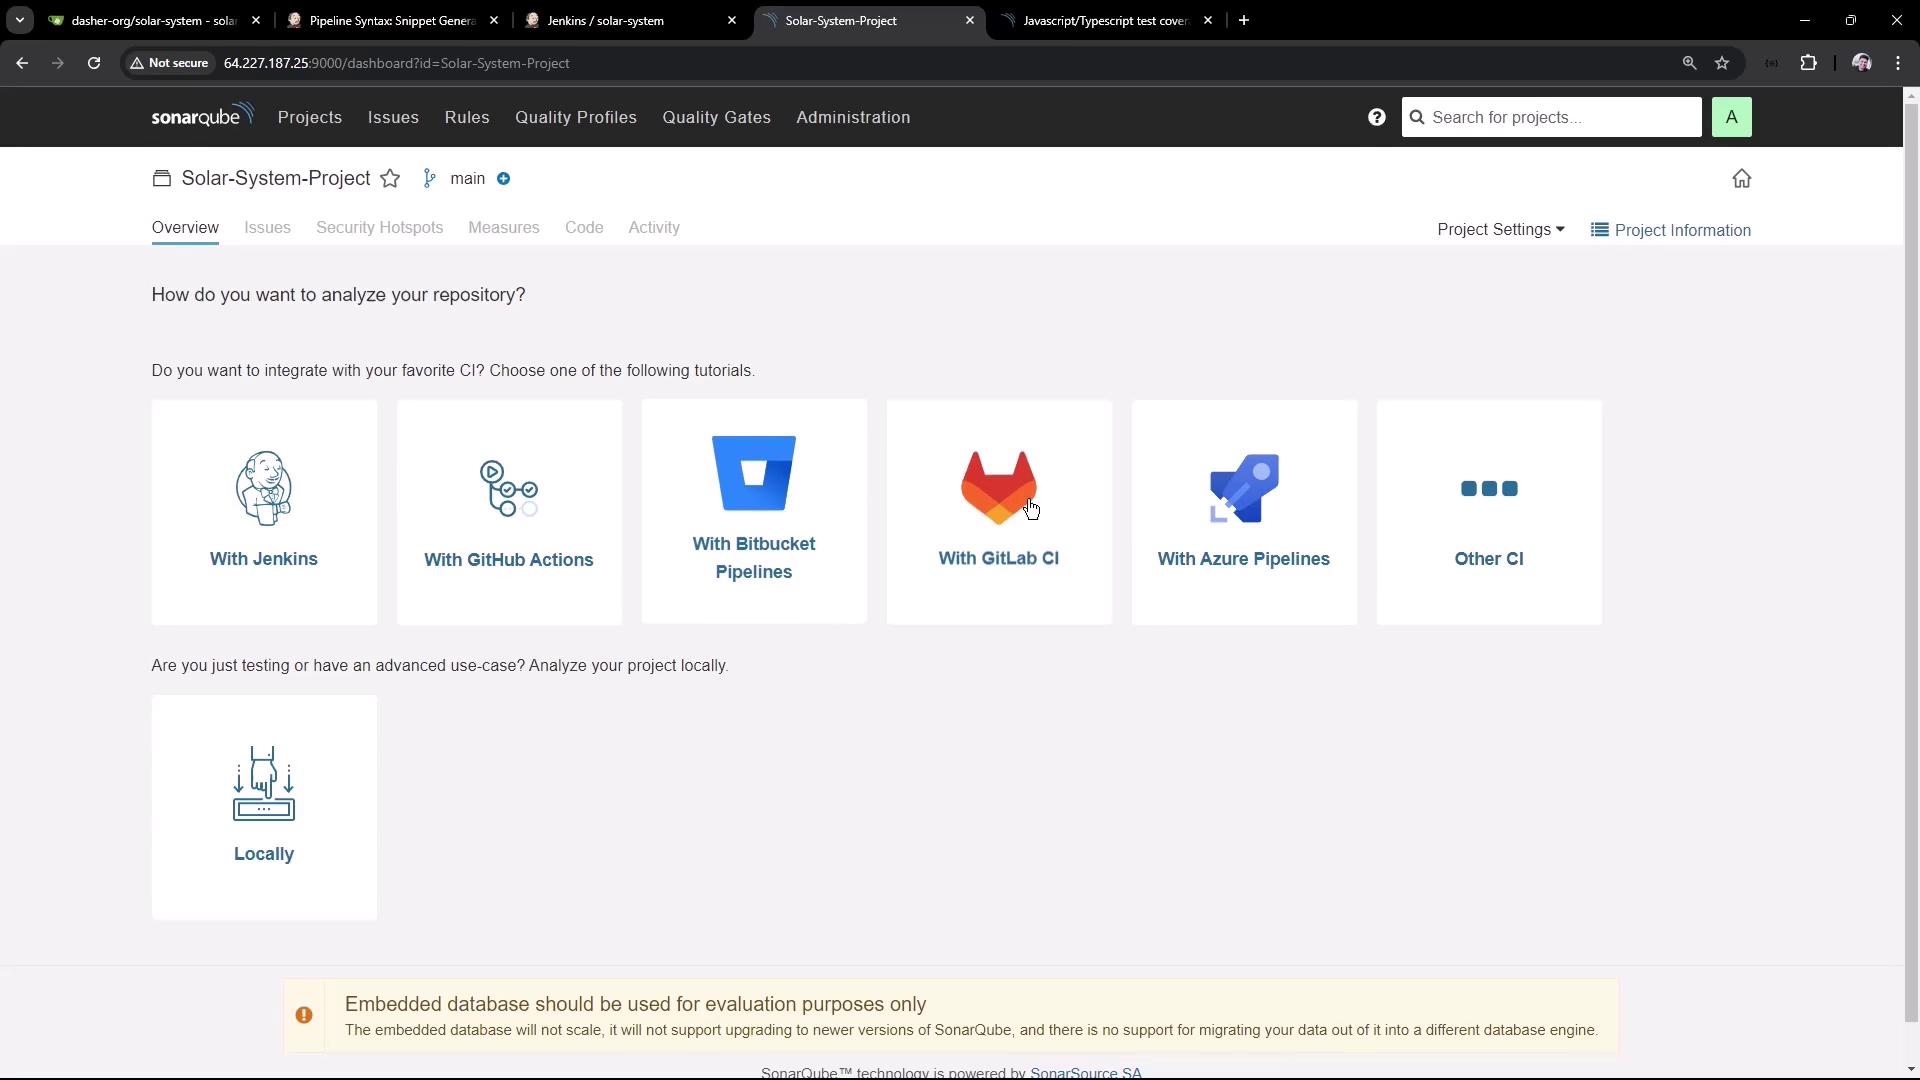
After entering the project details, SonarQube offers several integration options for popular CI tools.
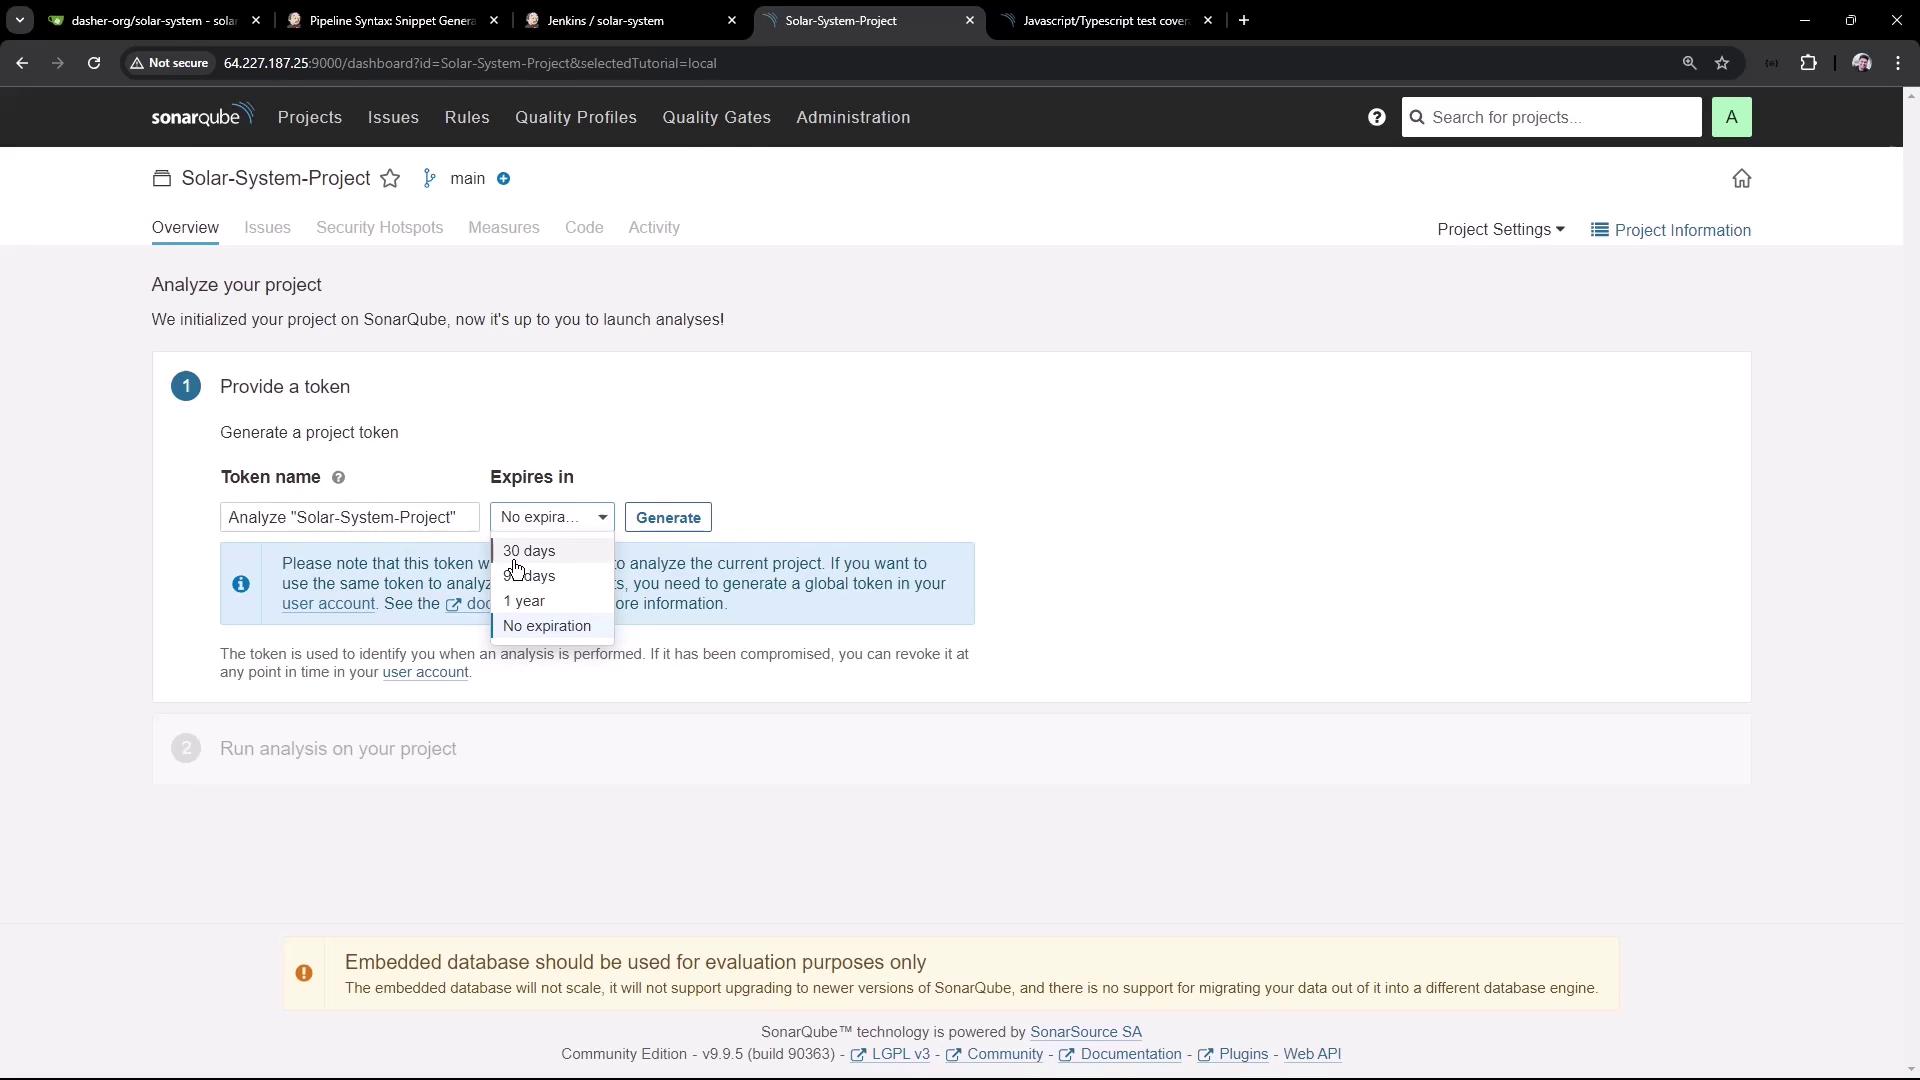
For this demo, we use a local setup. SonarQube generates an authentication token for project analysis. Although the token in our demonstration is set to never expire, it is advisable to configure a short expiration period in production environments. This token is required for uploading analysis results.
After detecting that our project type is Node.js, SonarQube provides a command similar to the following for a Node.js project running on Linux:
You can run this command directly on your Linux machine or use it within your Jenkins pipeline. In our Jenkinsfile, we incorporate a new stage to perform SAST analysis.Below is an example snippet of the SonarQube CLI command as integrated within a Jenkins pipeline:
To integrate SonarQube analysis into the Jenkins pipeline, we add a new stage named “SAST - SonarQube” after the Code Coverage stage. Below is a simplified section of the Jenkinsfile with all stages included:
environment { MONGO_URI = "mongodb+srv://supercluster.d83jj.mongodb.net/superData" MONGO_DB_CREDS = credentials('mongo-db-credentials') MONGO_USERNAME = credentials('mongo-db-username') MONGO_PASSWORD = credentials('mongo-db-password')}options { // Other options can be placed here}stages { stage('Installing Dependencies') { // Steps to install dependencies } stage('Dependency Scanning') { // Steps for dependency scanning } stage('Unit Testing') { // Steps for unit testing } stage('Code Coverage') { // Steps for code coverage calculation } stage('SAST - SonarQube') { steps { sh ''' sonar-scanner \ -Dsonar.projectKey=Solar-System-Project \ -Dsonar.sources=app.js \ -Dsonar.host.url=http://64.227.187.25:9000 \ -Dsonar.login=sqp_54484dbbe3a5b3b3088c734cf5e4c3beba3fd6 ''' } }}post { // Post-build actions can be specified here}
The above command uses the SonarScanner CLI to analyze the specified source code (in this case, app.js). Once the analysis is complete, the results are uploaded to SonarQube with the provided token and project key.
Ensure that the SonarScanner CLI is installed on your virtual machine or available in your Jenkins tools.
Installing and Configuring SonarQube Scanner in Jenkins
If SonarScanner is not installed, follow these steps:
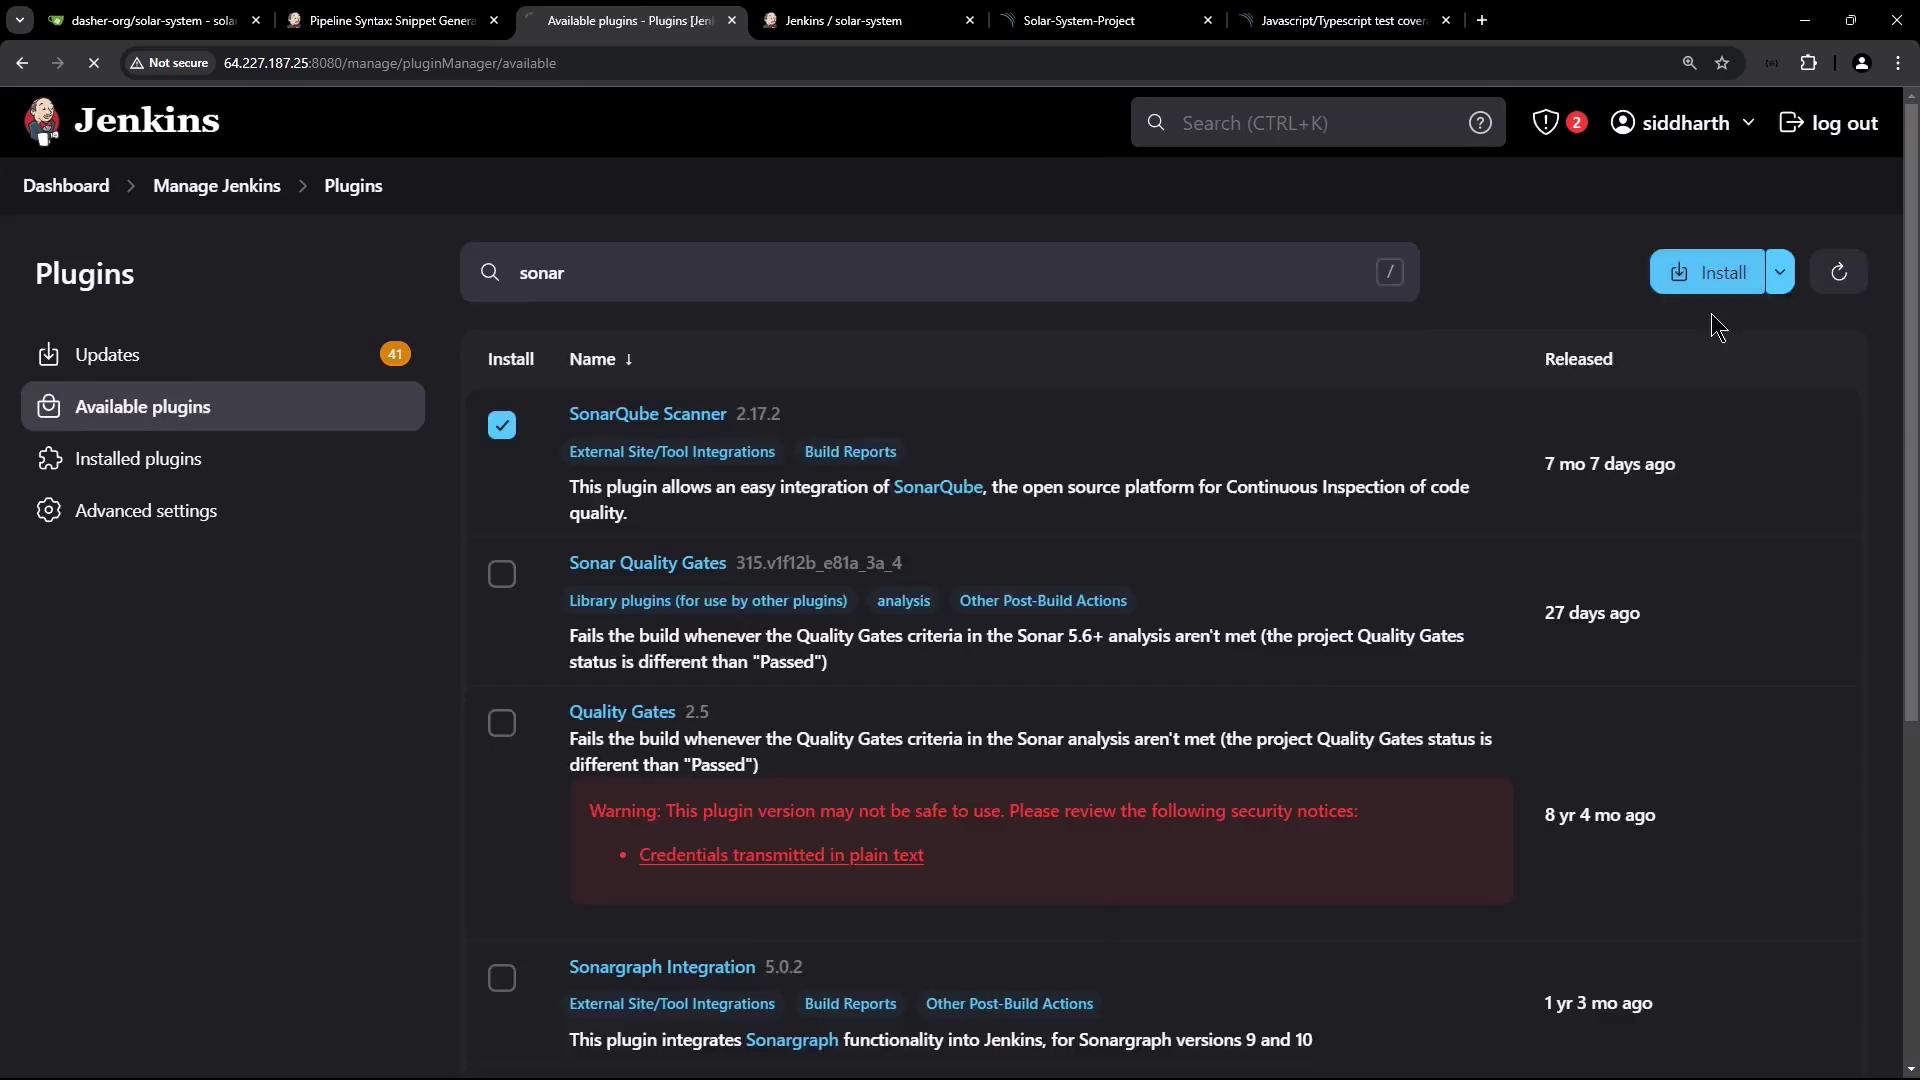
Open the Jenkins Plugin Manager and search for “SonarQube Scanner.”
Install the plugin and restart Jenkins.
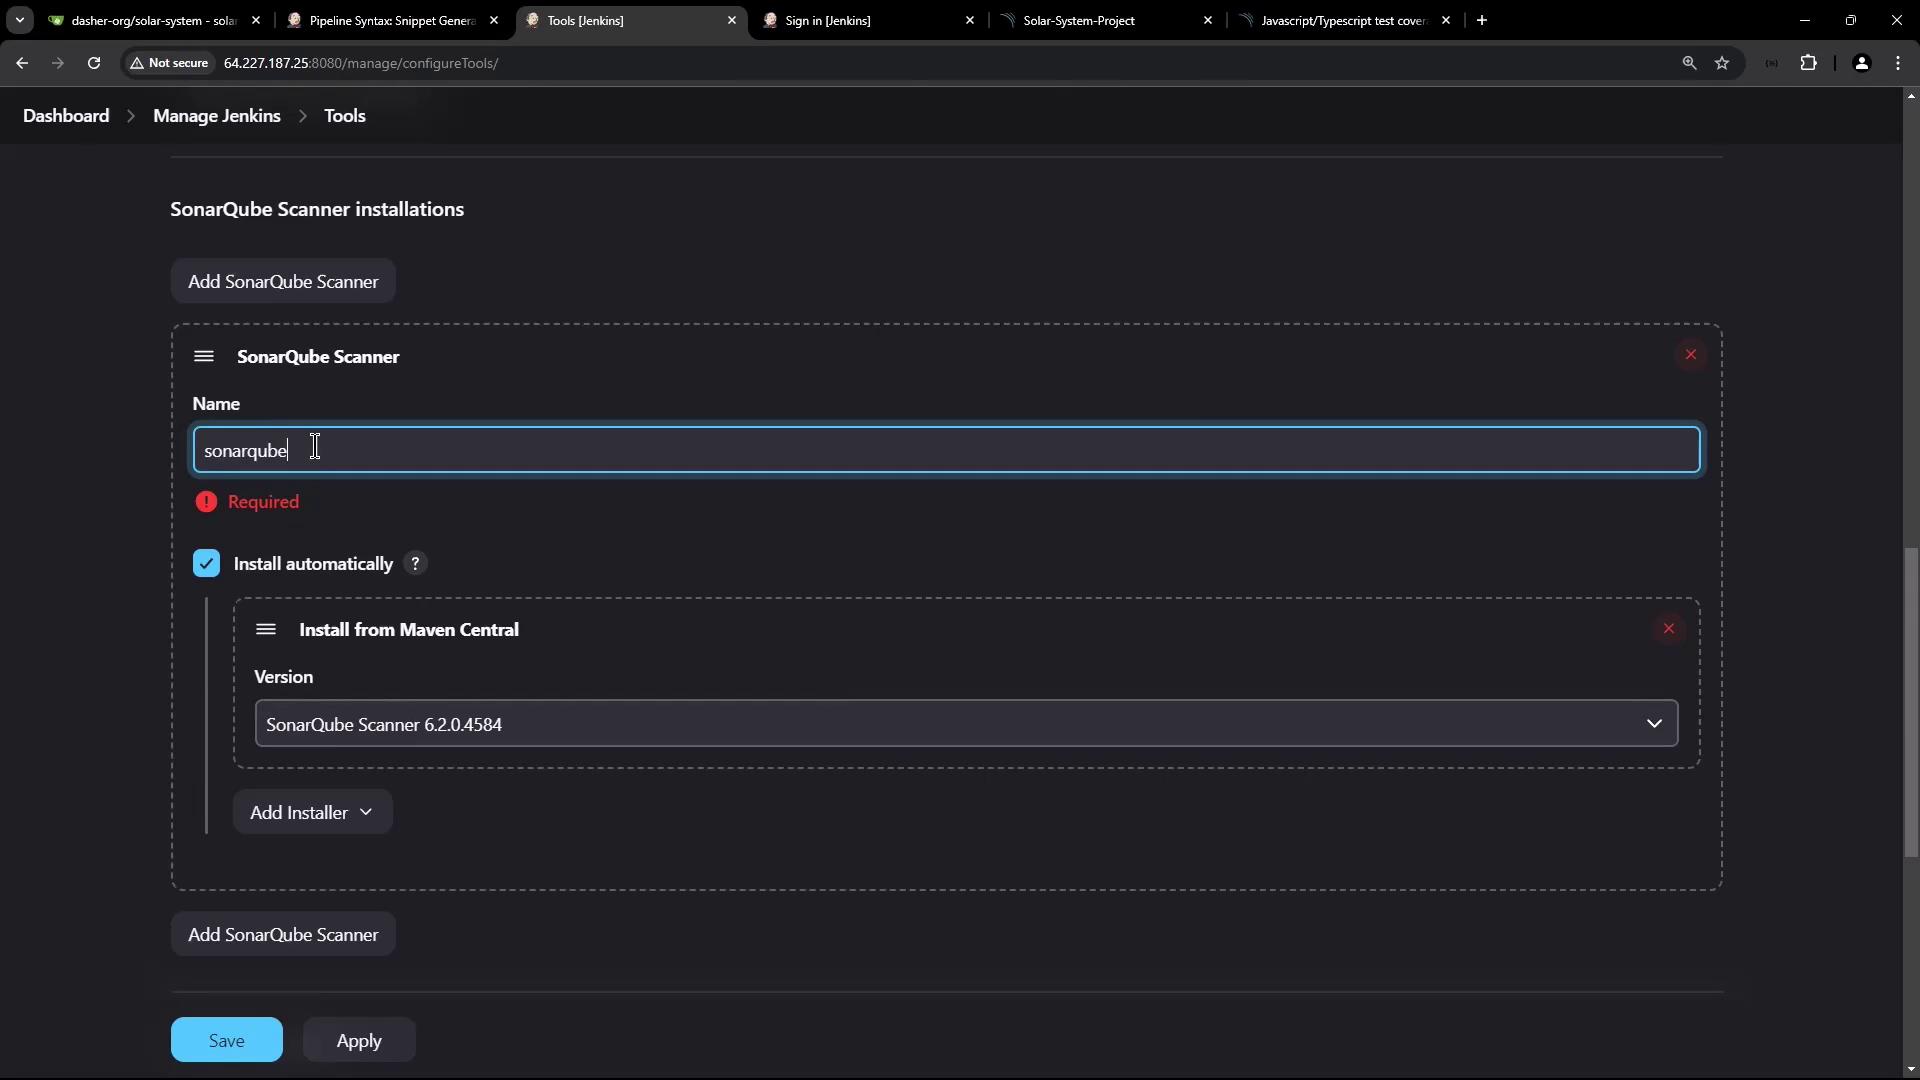
Configure the scanner through “Manage Jenkins” > “Global Tool Configuration” by adding a new SonarQube Scanner installation. For this demo, we use version 6.1.0.
After installation, update your Jenkinsfile to reference the tool using an environment variable, for example:
This stage echoes the path of the SonarScanner tool for debugging and then runs the analysis using the full CLI path. Once committed, the pipeline will trigger a new build and upload the analysis result to SonarQube.During the build, logs similar to the snippet below will confirm the successful analysis:
echo $SONAR_SCANNER_HOME$SONAR_SCANNER_HOME/bin/sonar-scanner -Dsonar.projectKey=Solar-System-Project -Dsonar.sources=app.js -Dsonar.host.url=http://64.227.187.25:9000 -Dsonar.login=sqp_54484dbbe3a5b3b......17:51:48.784 INFO ANALYSIS SUCCESSFUL, you can access the results at: http://64.227.187.25:9000/dashboard?id=Solar-System-Project
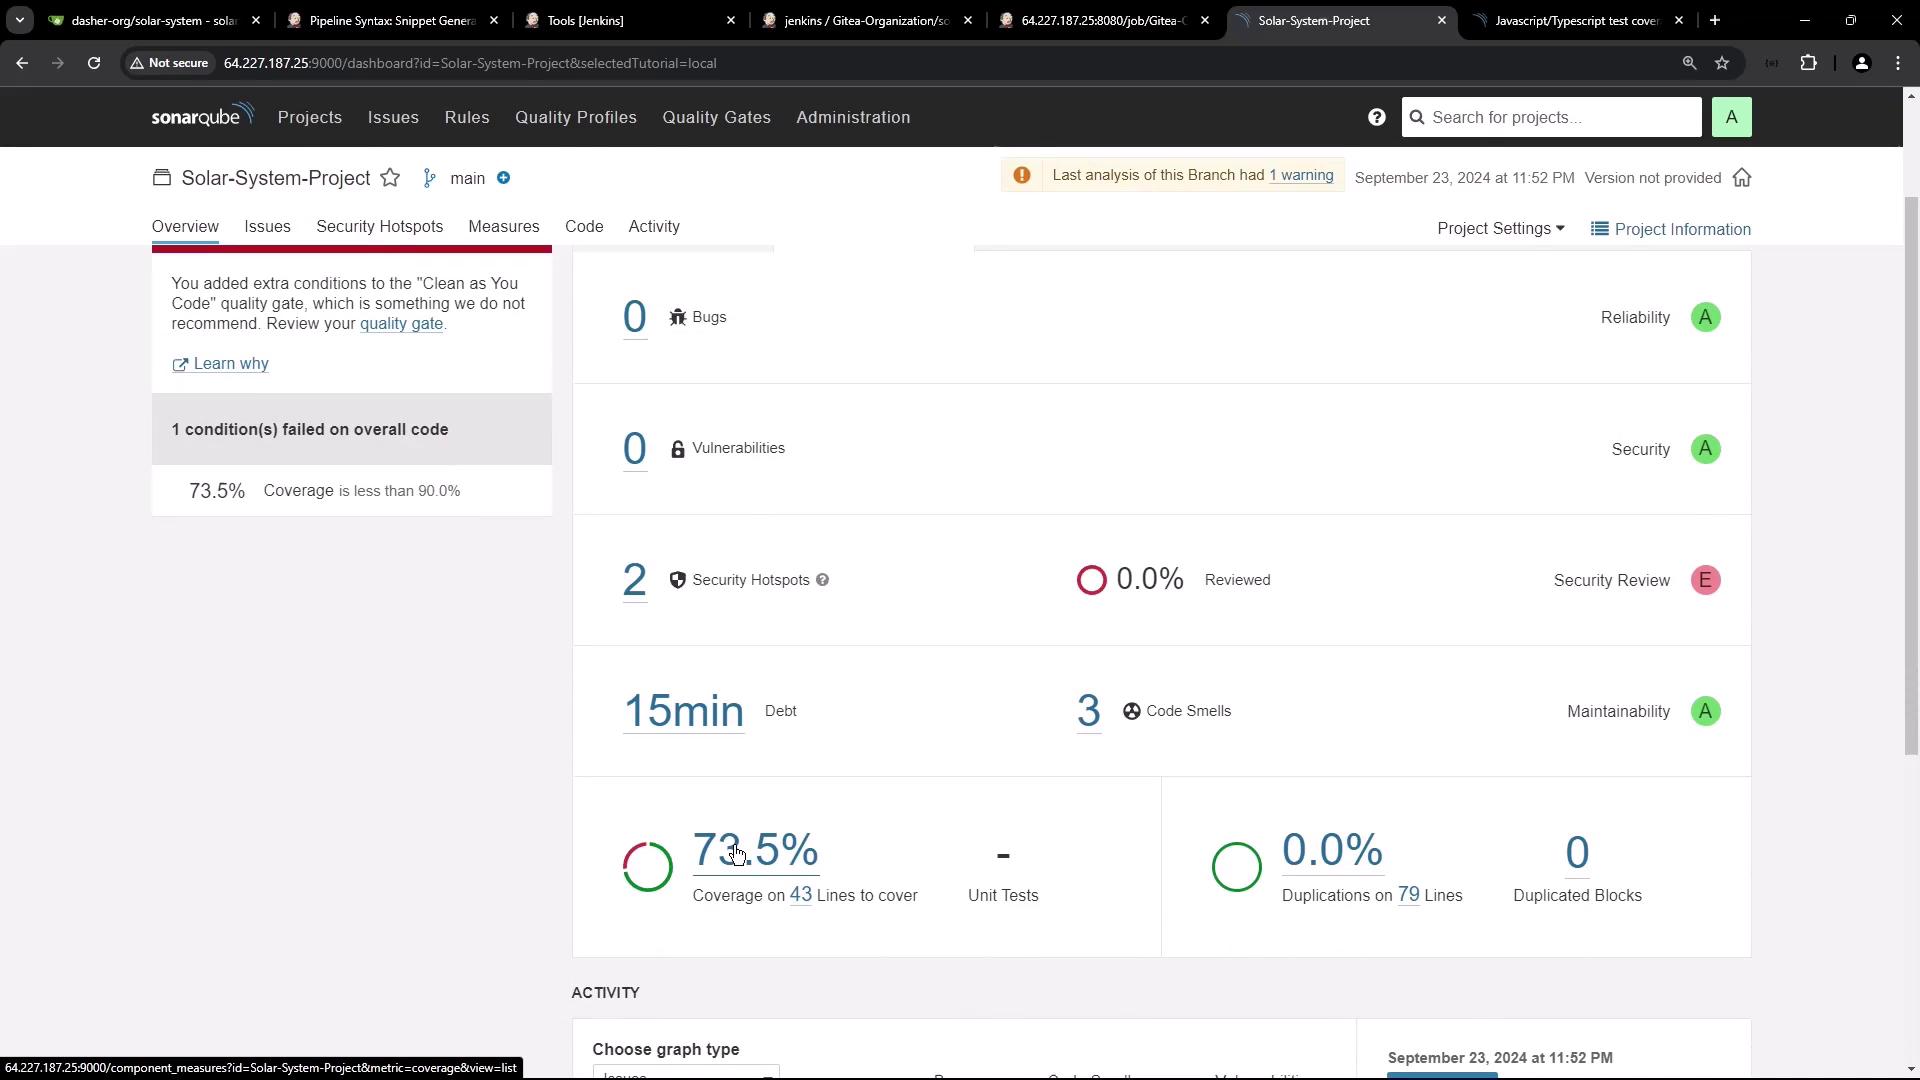
After a successful build, refresh the SonarQube dashboard for the “Solar System Project” to view the code status, which includes security hotspots, code smells, and code coverage metrics.
Currently, the project shows 0% coverage because the coverage report was not passed to SonarQube. Before SAST analysis, the Jenkins pipeline generated a coverage report of approximately 79% for the app.js file. However, SonarQube does not process this report unless you explicitly specify its location.
For Node.js projects, SonarQube requires the coverage report to be specified using the sonar.javascript.lcov.reportPaths parameter. After running your coverage command (typically via npm scripts), the report is generated in the coverage directory using a command such as:
+ npm run coverage> Solar System@6.7.6 coverage> nyc --reporter cobertura --reporter lcov --reporter text --timeout 10000 --exit mocha app-test.jsServer successfully running on port - 3000
To provide full details on configuring a Node.js project with SonarQube, refer to the SonarQube documentation. Add the following property to your scanner command:
Ensure that the file coverage/lcov.info exists in your workspace as it contains the code coverage data required by SonarQube.Update the Jenkinsfile stage for SonarQube analysis to include the coverage report path:
After committing and pushing these changes, trigger a new pipeline build. With the updated configuration, the SonarQube dashboard will display the updated code coverage (for example, an update from 0% to 73%).
Although the coverage meets the reported percentage, it still remains below the required 90% threshold, causing the quality gate to fail. However, note that the Jenkins pipeline stage for SonarQube is marked as successful because it only checks whether the analysis was uploaded—and does not validate the quality gate status.
In a future demonstration, we will explore how to retrieve the quality gate status from SonarQube to ensure that the Jenkins pipeline can fail the build if the quality gate conditions are not met.
That’s all for now. Thank you for following along.