

Metrics
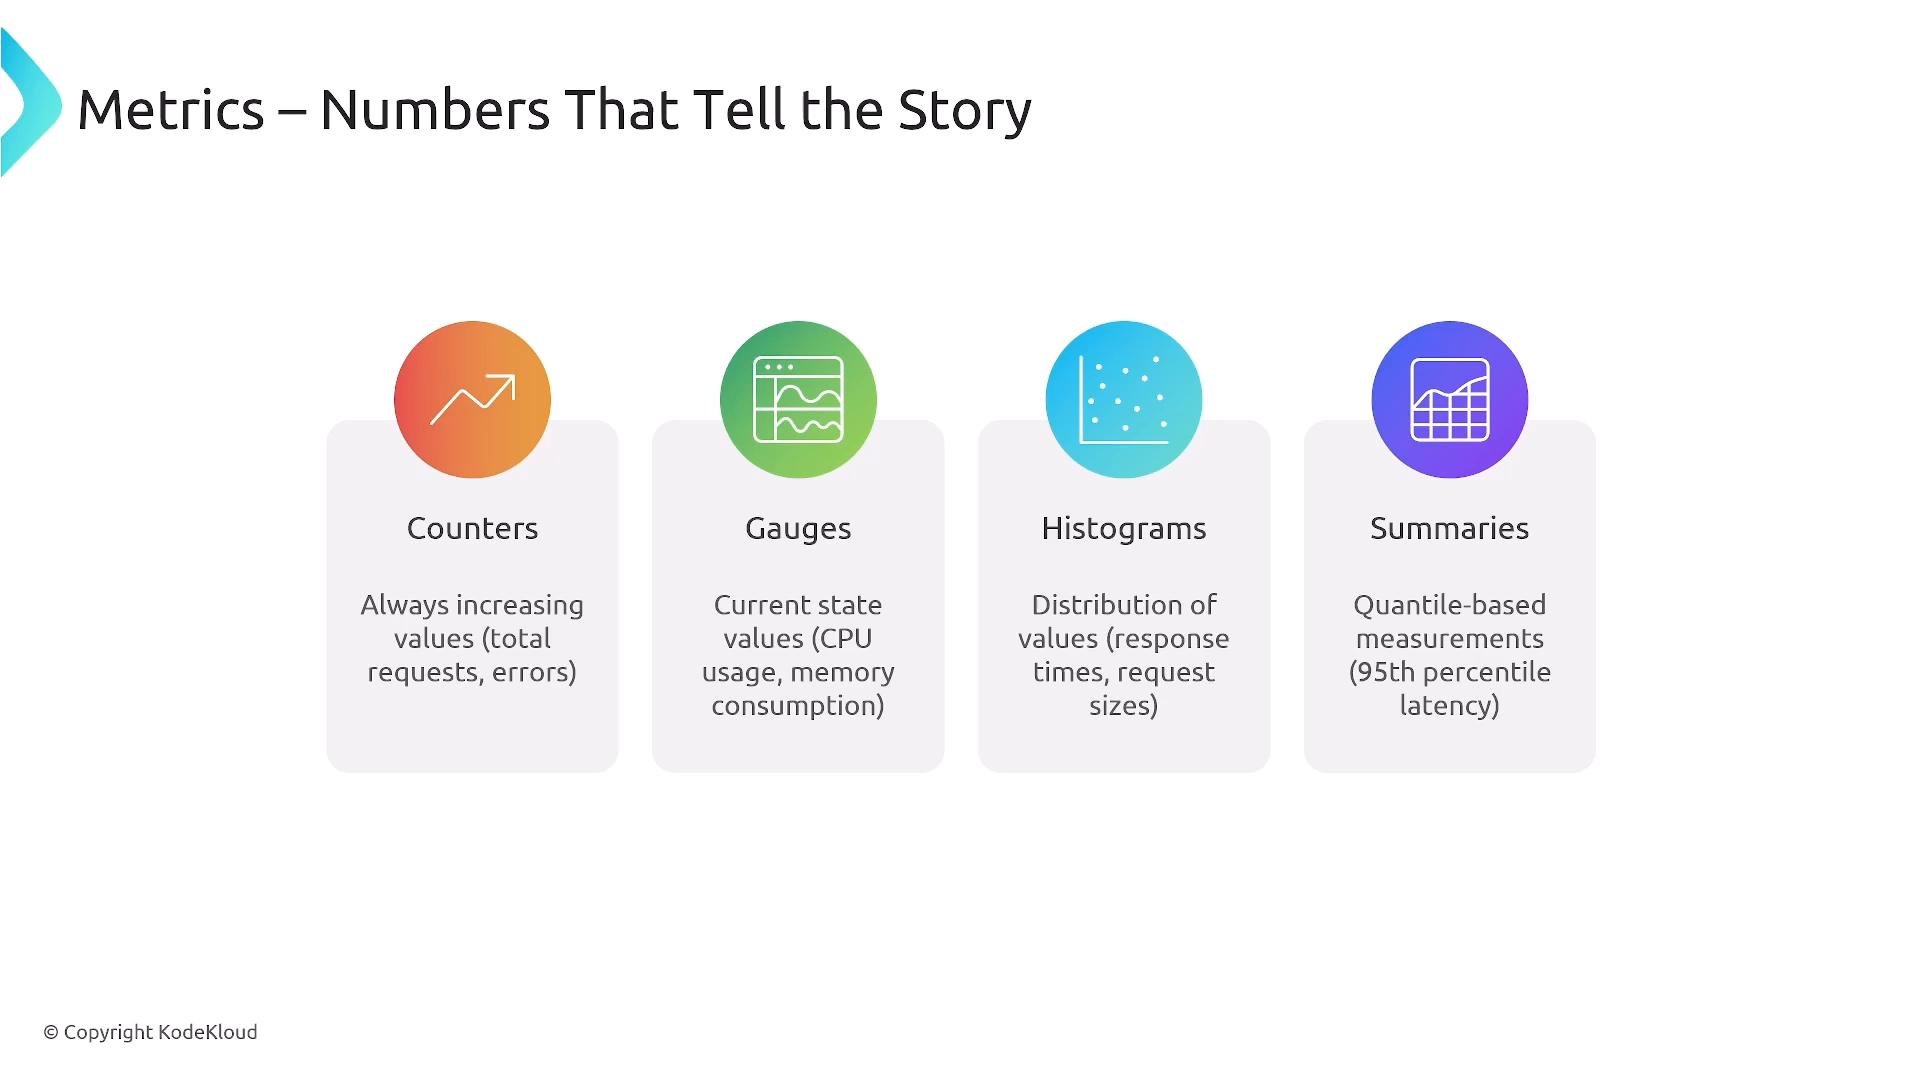
Metrics are numeric signals used for trend analysis, alerting, and dashboards. They are compact, high-cardinality-friendly summaries that drive alerting and SLO measurement. Types of metrics:- Counters — monotonically increasing values (e.g., total requests).
- Gauges — instantaneous values that can go up and down (e.g., memory usage).
- Histograms — bucketed distributions (excellent for latency distribution and aggregation).
- Summaries — local quantiles (percentile calculation per instance; not trivially aggregatable across instances).
Example metric names and common naming patterns:
- Prometheus scrapes metrics via a pull model from instrumented endpoints.
- PromQL is the Prometheus query language for building alerts and dashboards.
- Integration options include Pushgateway (for short-lived jobs — use cautiously), and exporting via the OpenTelemetry Collector.
- Adopt label-based, multi-dimensional metrics (include
environment,team,zone, etc.) to provide context for querying and aggregation.
Logs
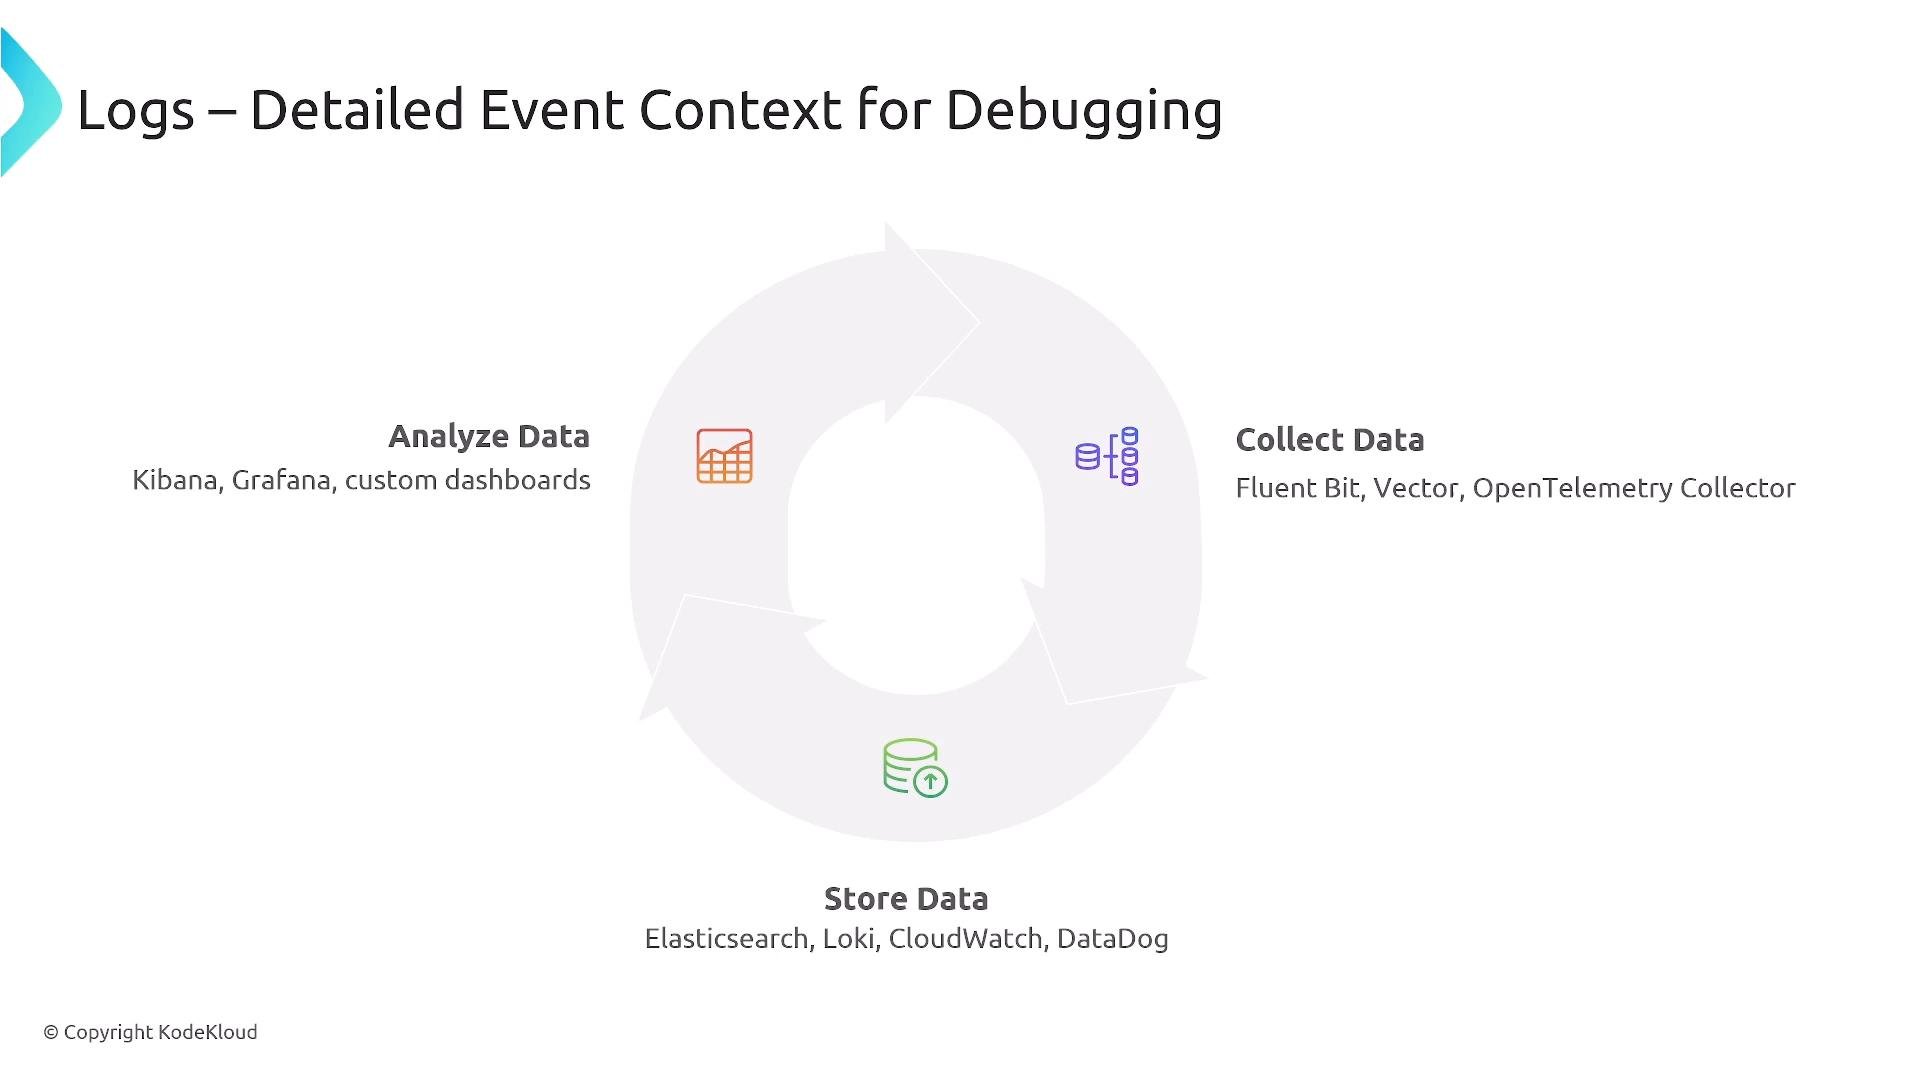
Logs record time-stamped events and rich context useful for debugging and forensic analysis. Structured logs (JSON or key/value) are preferred because they are queryable and easy to correlate with traces and metrics. Common fields to include in structured logs:timestamp,level(INFO/WARN/ERROR),service,trace_id,span_id,message- error details, user or tenant IDs, and application-specific metadata
Structured logging that includes
trace_id and span_id lets you jump from a log event into a distributed trace for faster root-cause isolation.
Distributed Tracing
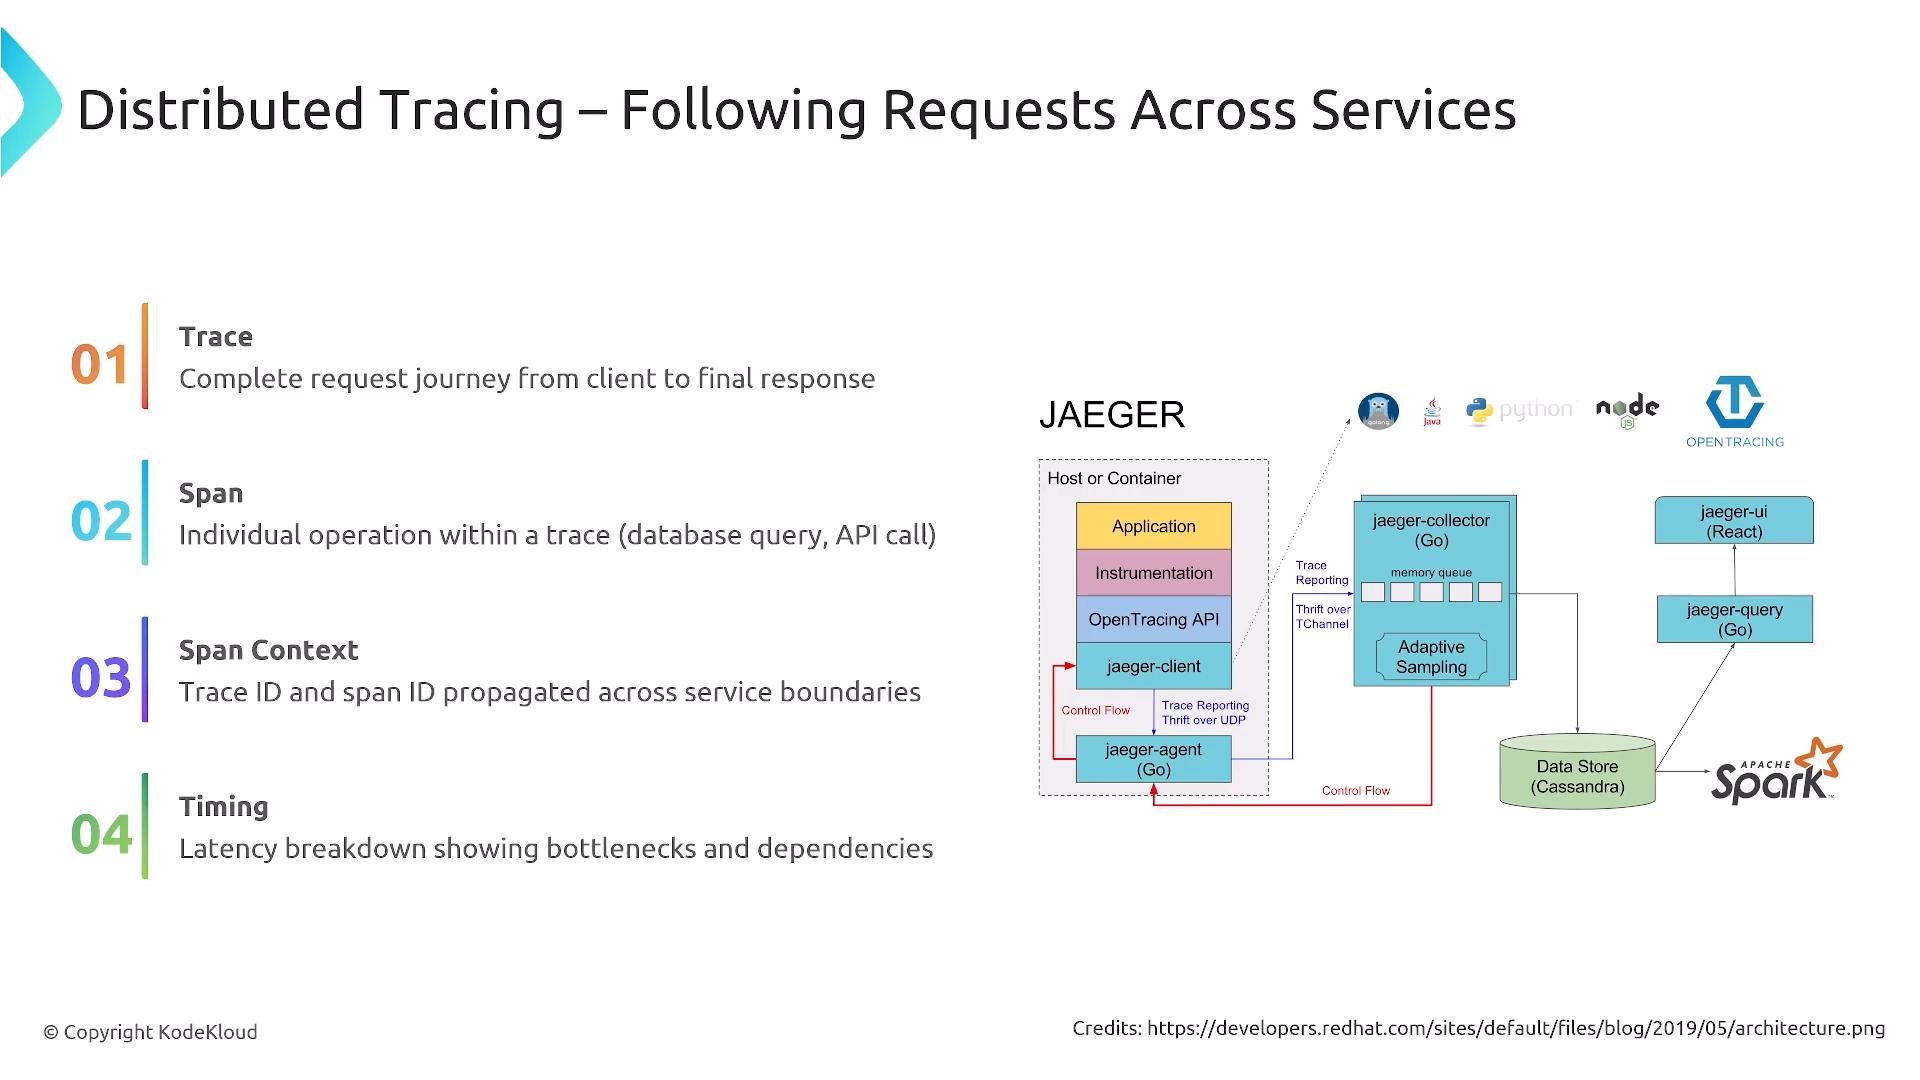
Distributed tracing captures end-to-end request journeys across services. A trace is composed of spans; each span records an operation, timing, and span context (trace_id, span_id, parent relationship). Tracing helps identify latency hotspots, dependencies, and serialization of work. Typical tracing architecture:- Instrumentation libraries (language SDKs)
- Local agents/collectors (Jaeger agent, OpenTelemetry Collector)
- Back-end trace storage and query/UI (Jaeger, Tempo, commercial tracing services)
Events
Events are structured, business-context signals that can annotate telemetry and tie technical signals to business activities (sales, feature toggles, capacity changes). They help correlate user behavior and business outcomes with system telemetry. Example business event (YAML):Alerts
Alerts notify operators when telemetry indicates conditions that require attention. Effective alerts are actionable and include context such as runbooks, links to dashboards, and a representative trace or log sample.Noisy alerts reduce operational effectiveness. Tune thresholds, use multi-signal triggers, and include contextual information (runbooks, traces, dashboards) to keep alerts actionable.
- Prefer multi-signal alerts (e.g., metric threshold + error-rate increase).
- Use dynamic thresholds or anomaly detection where appropriate.
- Include remediation steps and responsible on-call team.
SLIs, SLOs, and SLAs
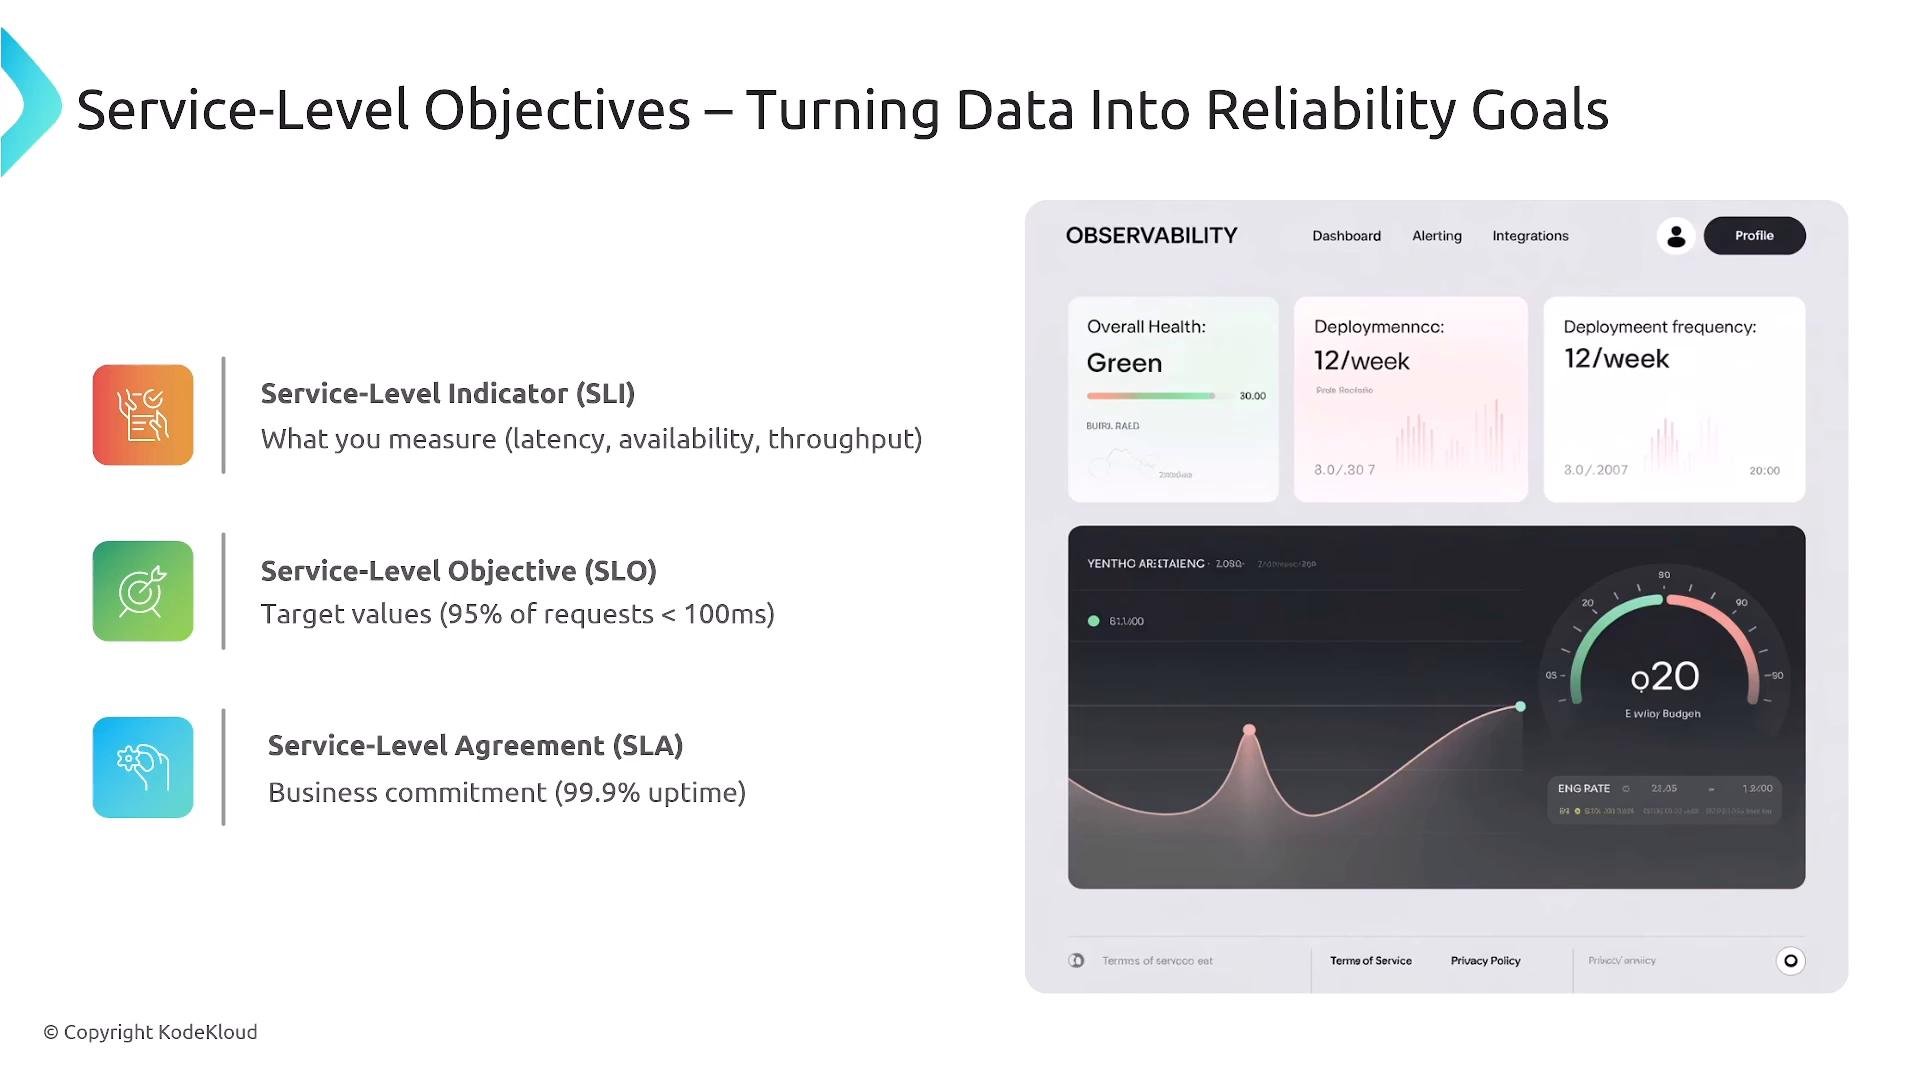
- SLI (Service Level Indicator): a measured metric (e.g.,
successful_requests / total_requests). - SLO (Service Level Objective): the target for an SLI (e.g., 99.5% availability over 30 days).
- SLA (Service Level Agreement): contractual commitments that may map to SLOs and include penalties for breaches.
OpenTelemetry and unified pipelines
OpenTelemetry (OTel) is the vendor-neutral standard for collecting metrics, logs, and traces. It supports auto-instrumentation and provides the OpenTelemetry Collector — a single pipeline for ingesting, processing, enriching, and exporting telemetry to multiple back ends (Prometheus, Jaeger/Tempo, Loki, commercial SaaS).OpenTelemetry provides a vendor-neutral way to collect and route metrics, logs, and traces. The OTel Collector centralizes ingestion, processing, and export to Prometheus, Jaeger/Tempo, Loki, or commercial backends.
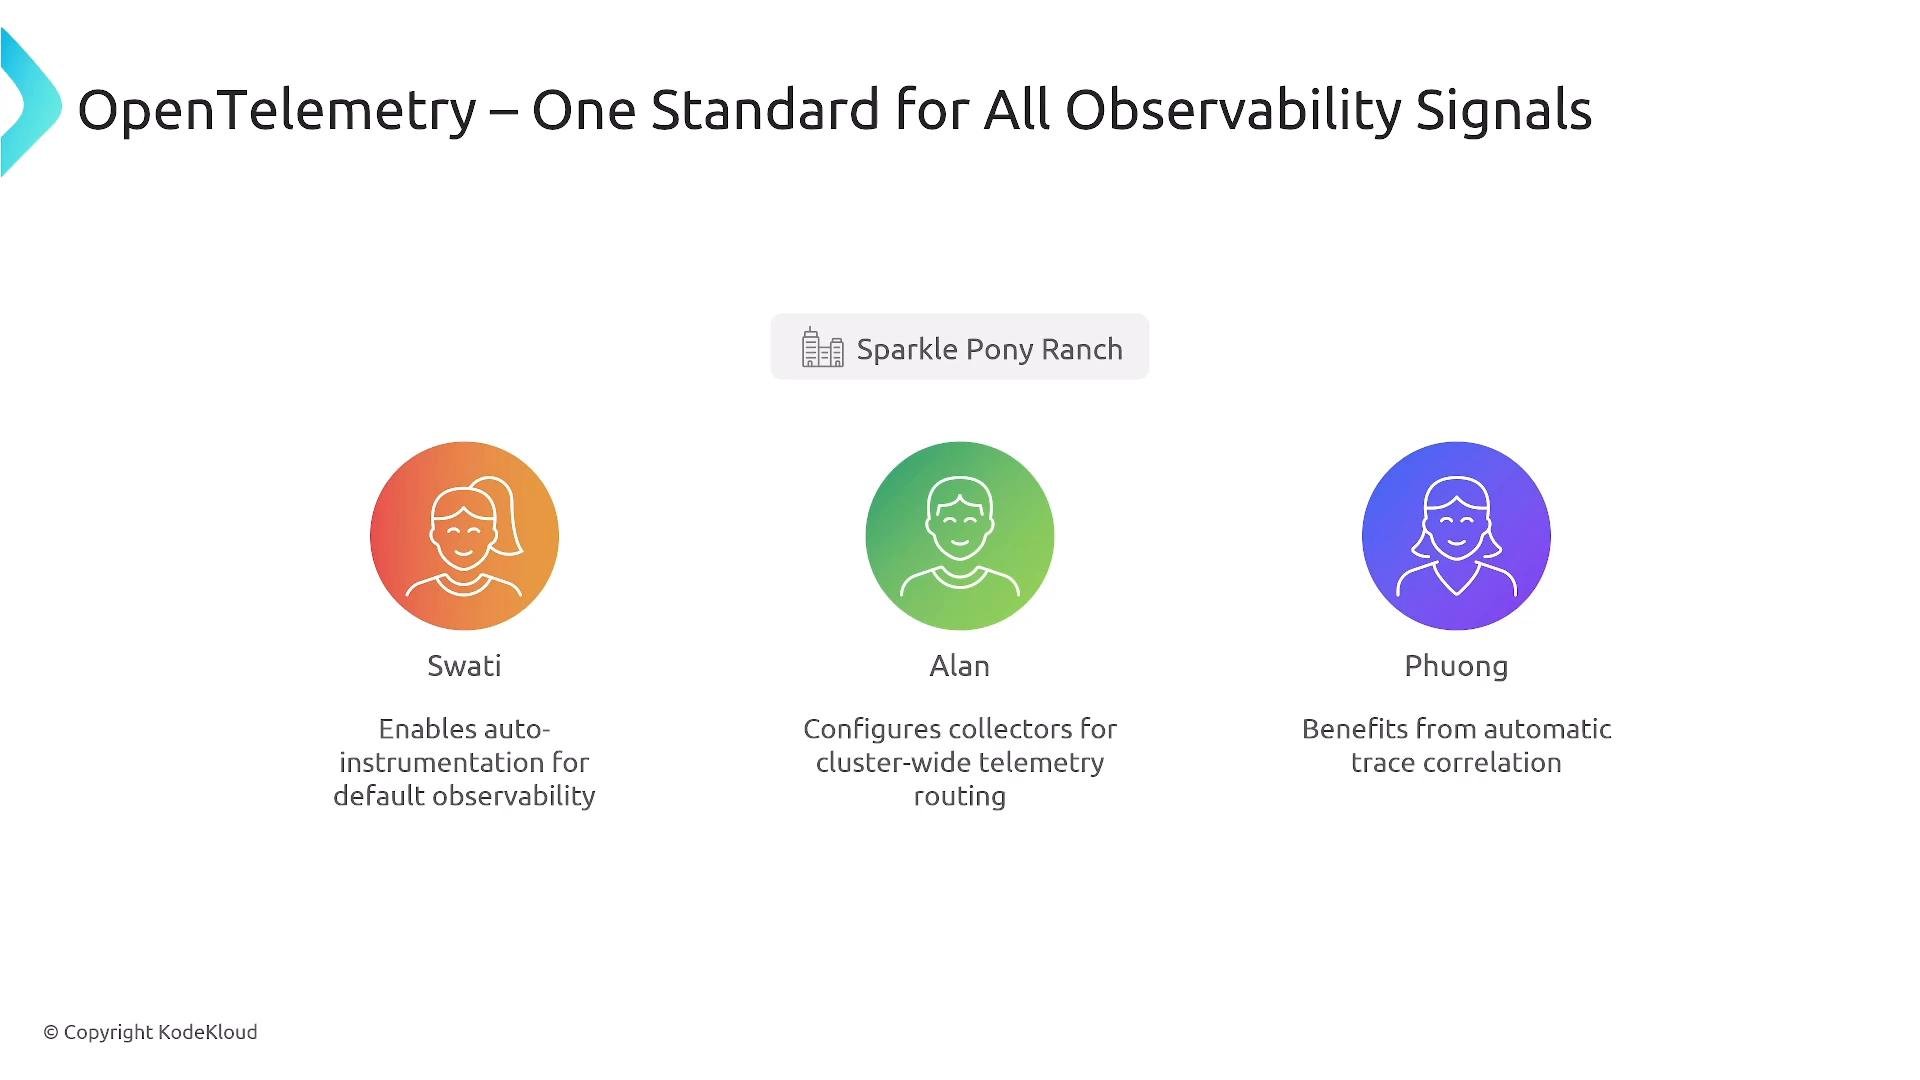
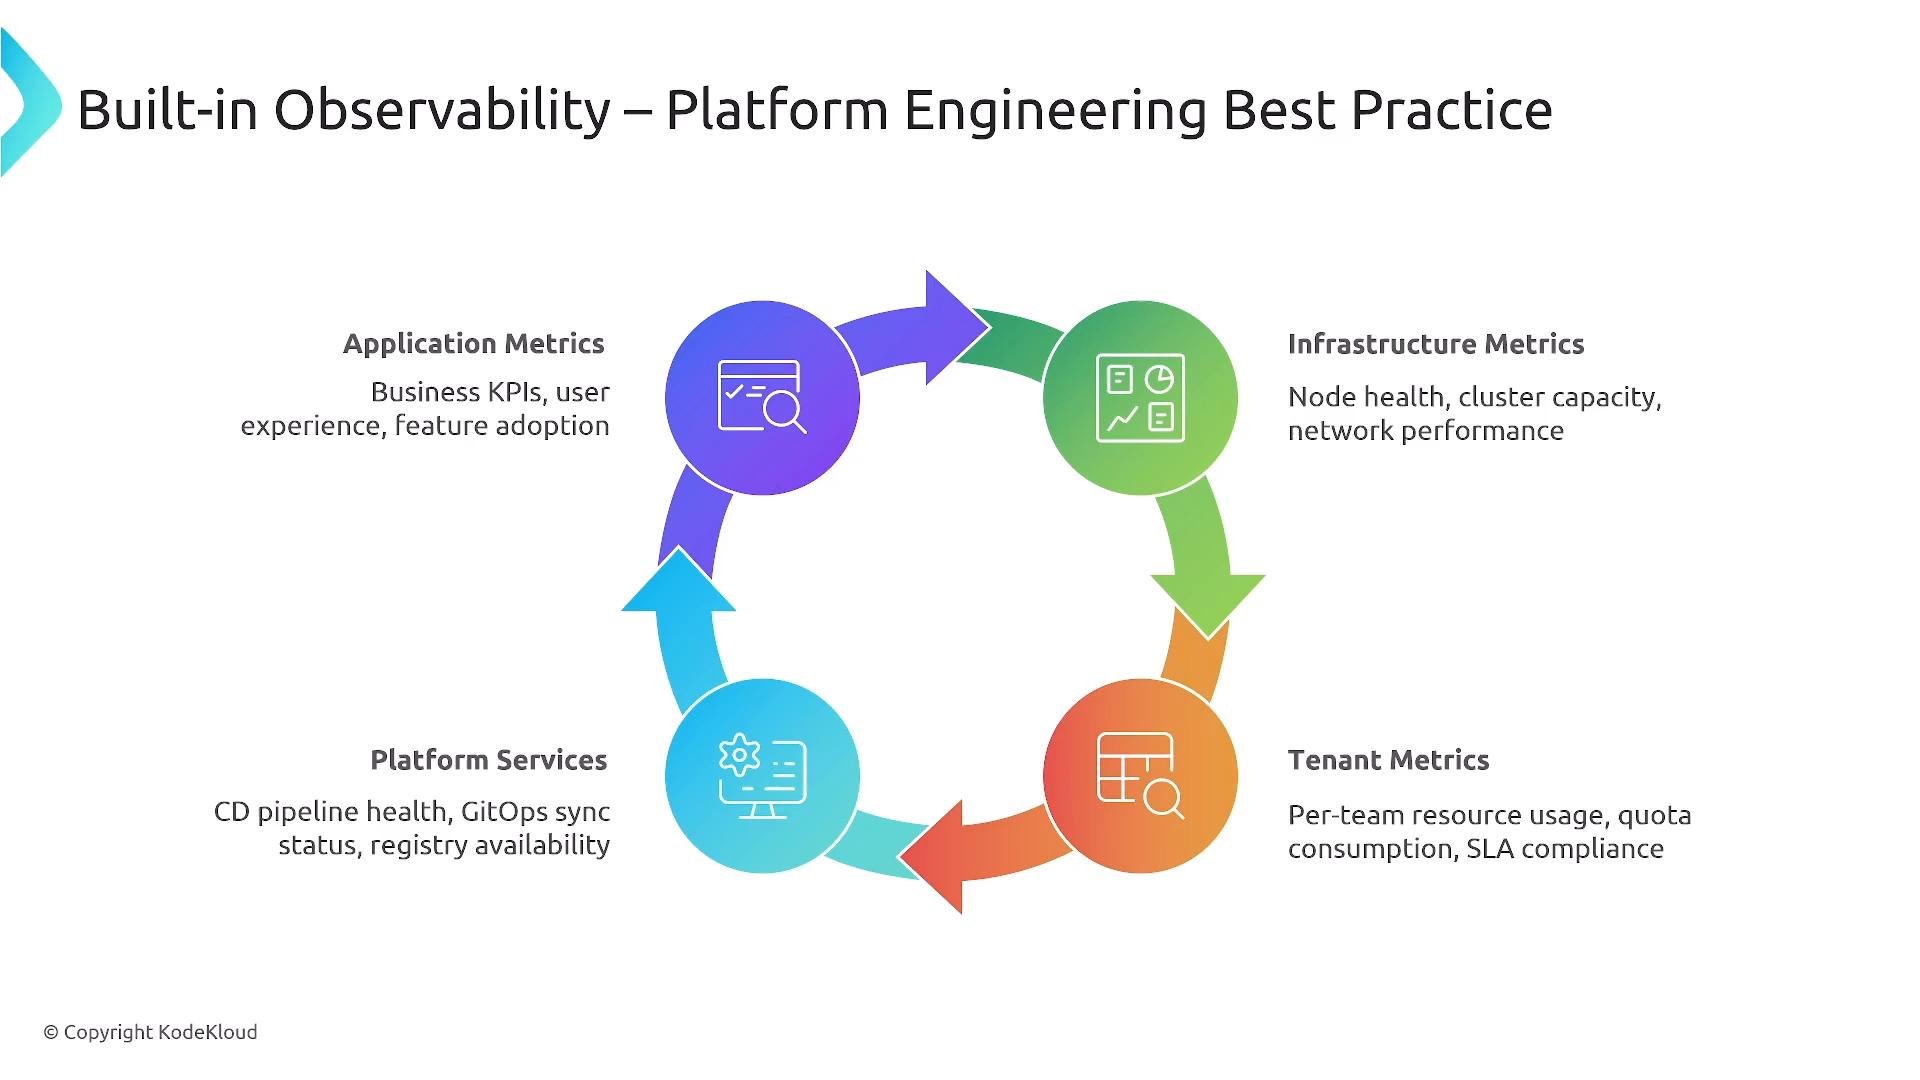
Platform engineering best practices
- Collect telemetry across application, infrastructure, tenant, and platform services.
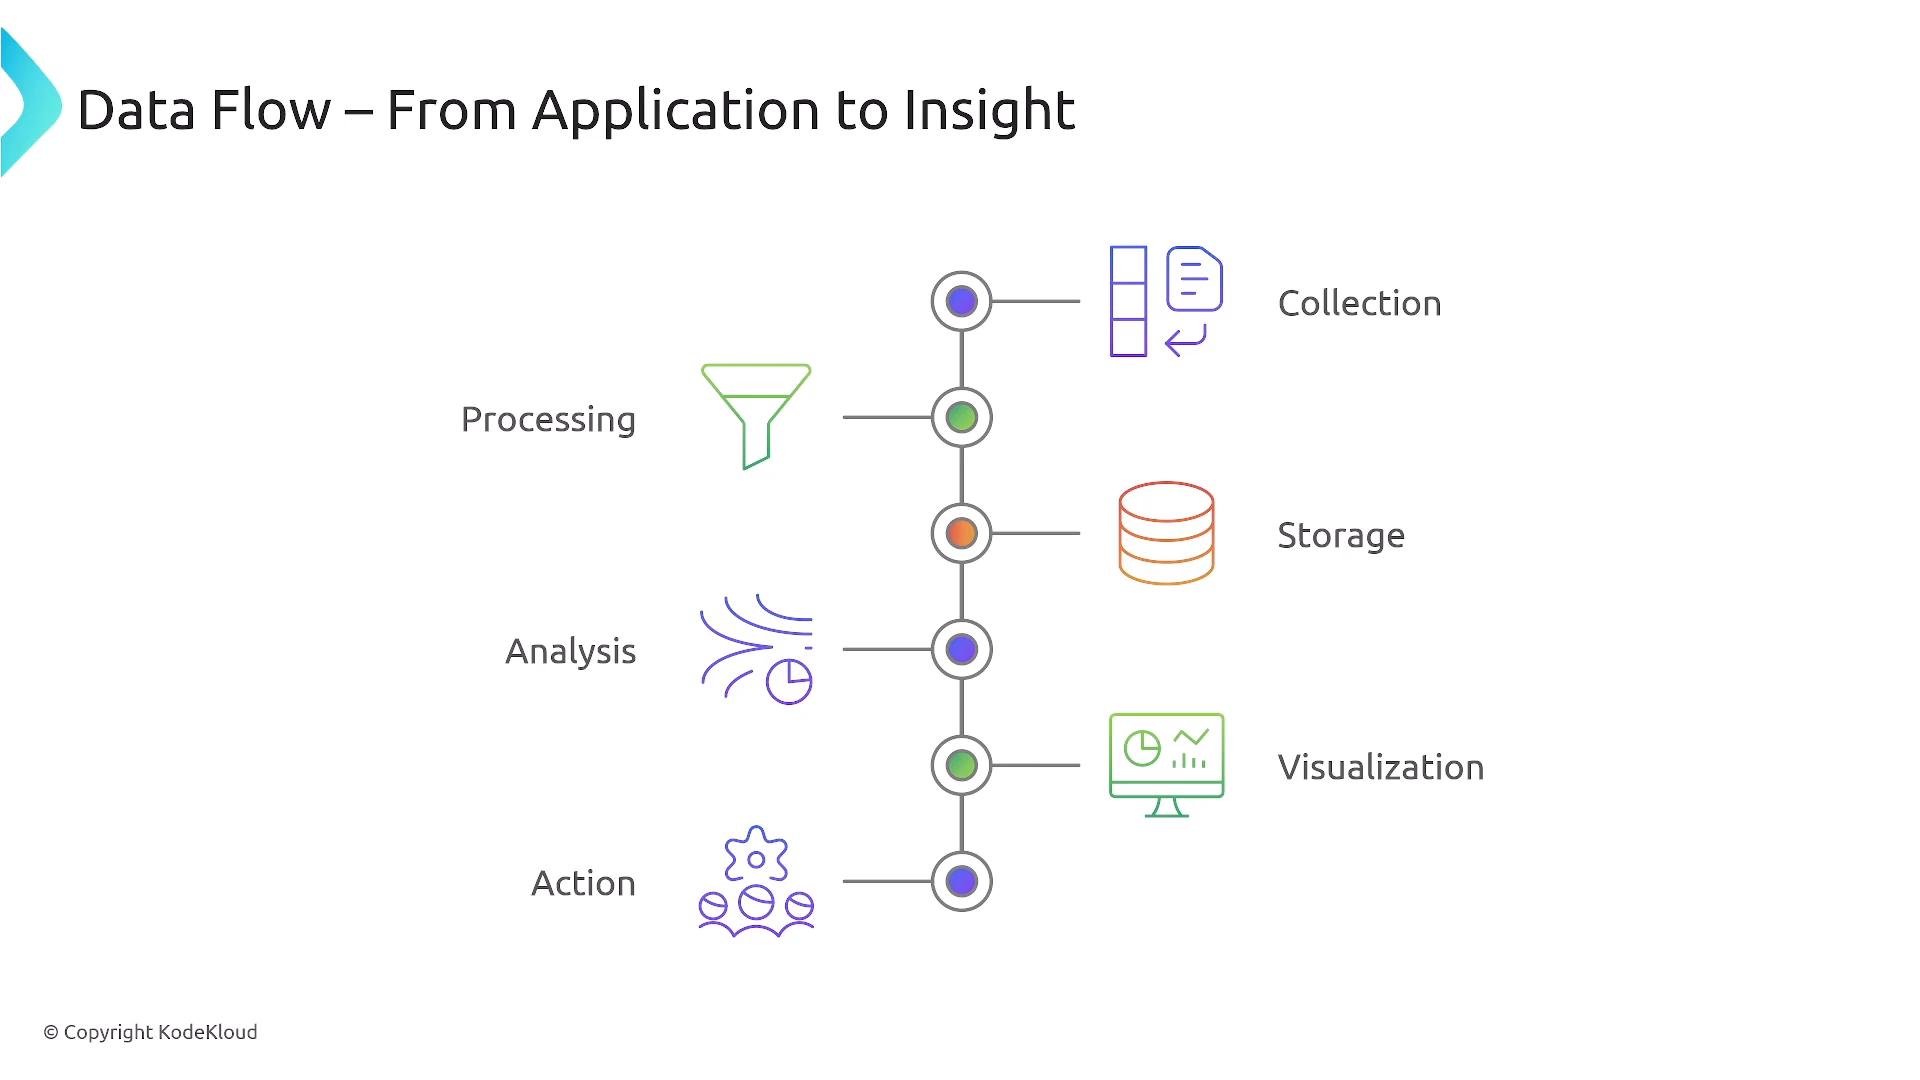
- Centralize processing and enrichment (OTel Collector) to reduce agent complexity.
- Store and visualize data where it is most useful, balancing retention and cost.
- Bake instrumentation into the platform: observability by default enables rapid debugging and automation.
Summary — Key takeaways
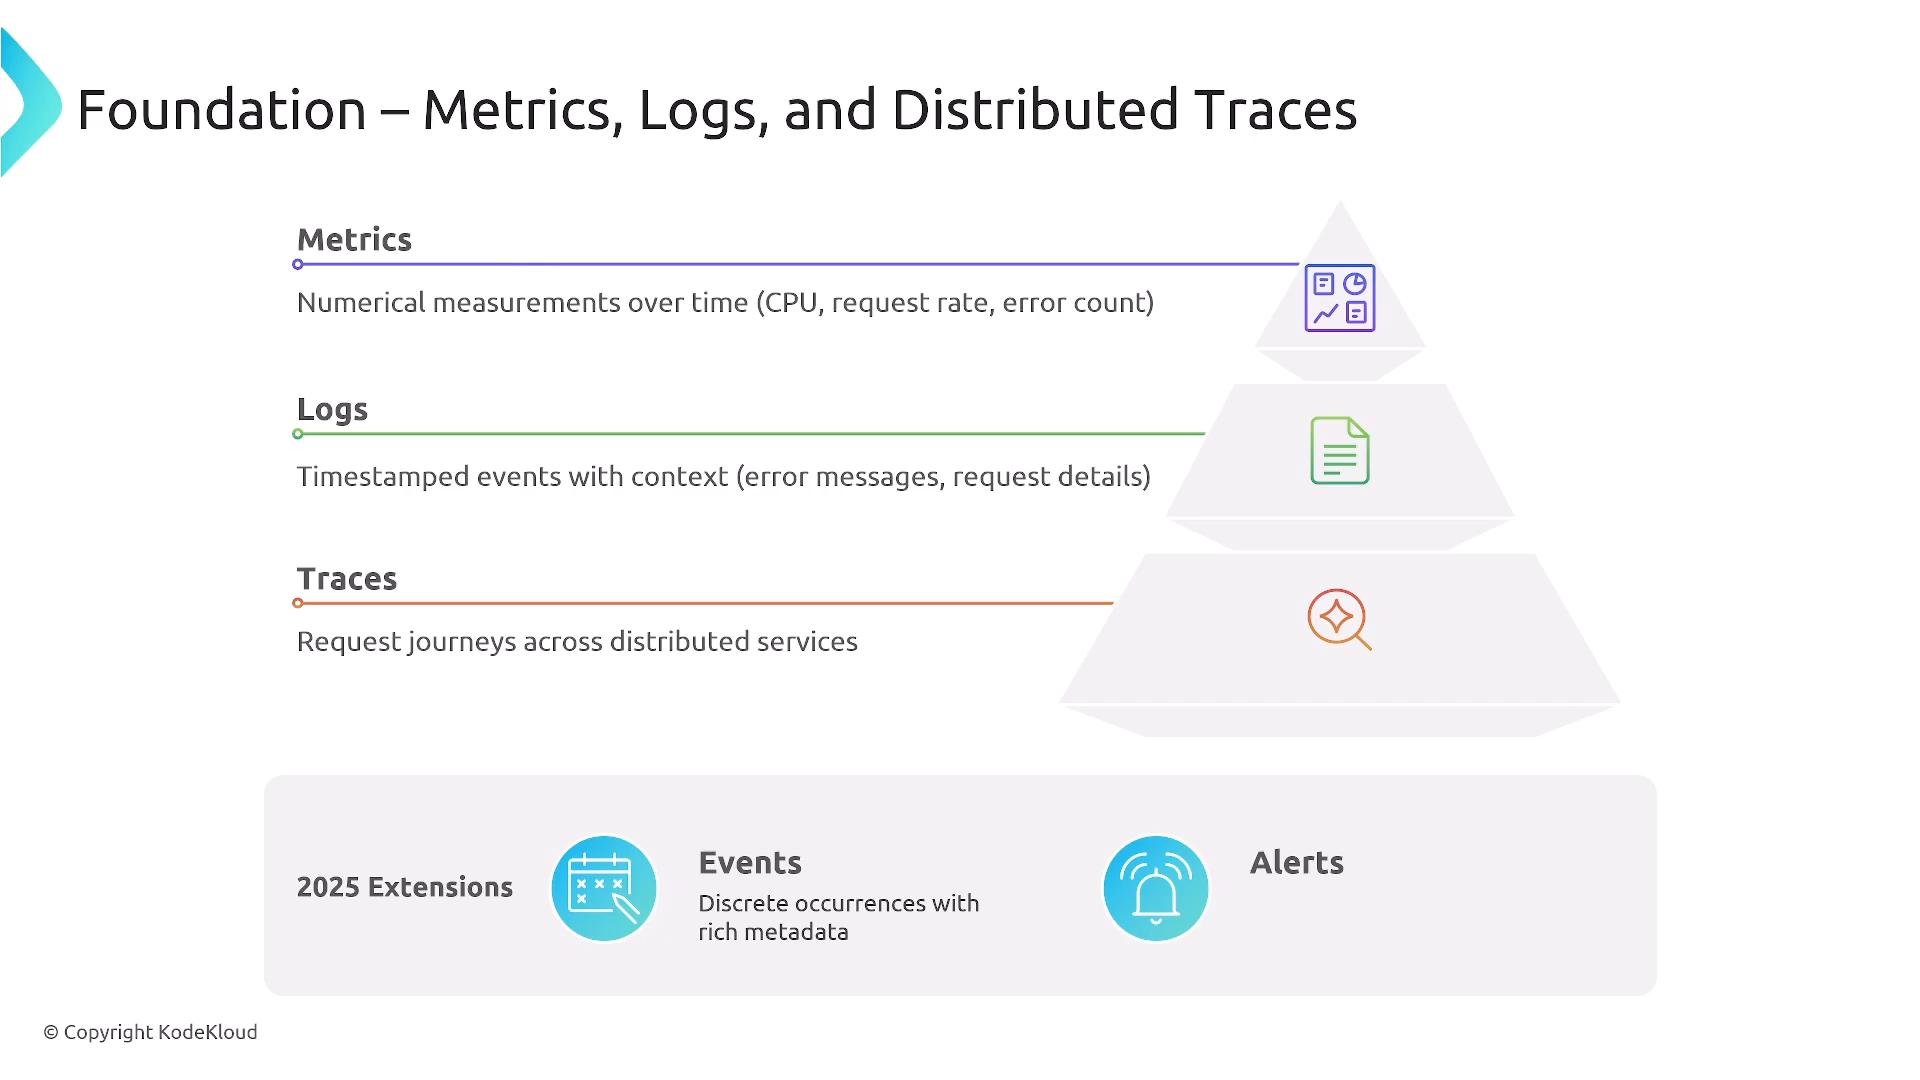
- The core observability pillars are metrics, logs, and traces. Events and alerts add business and operational context.
- Use metrics for trends, alerts, and SLOs; use logs for detailed event context; use traces for end-to-end latency and dependency analysis.
- OpenTelemetry provides a vendor-neutral, unified way to collect and route telemetry.
- Platform engineering should be SLO-driven: define SLIs, set SLOs, and manage error budgets to balance reliability and delivery speed.
- Instrumentation and observability should be built into the platform to enable proactive operations, fast incident response, and efficient troubleshooting.
- Be mindful of storage, cost, and signal quality. Reduce noisy alerts and favor contextual, multi-signal detection.
Links and references
- Prometheus — https://prometheus.io
- Prometheus Querying (PromQL) — https://prometheus.io/docs/prometheus/latest/querying/basics/
- OpenTelemetry — https://opentelemetry.io
- OpenTelemetry Collector — https://opentelemetry.io/docs/collector/
- Fluent Bit — https://fluentbit.io
- Fluentd — https://www.fluentd.org
- Vector — https://vector.dev
- Loki — https://grafana.com/oss/loki
- Jaeger — https://www.jaegertracing.io
- Tempo — https://grafana.com/oss/tempo
- Elasticsearch / Kibana — https://www.elastic.co/