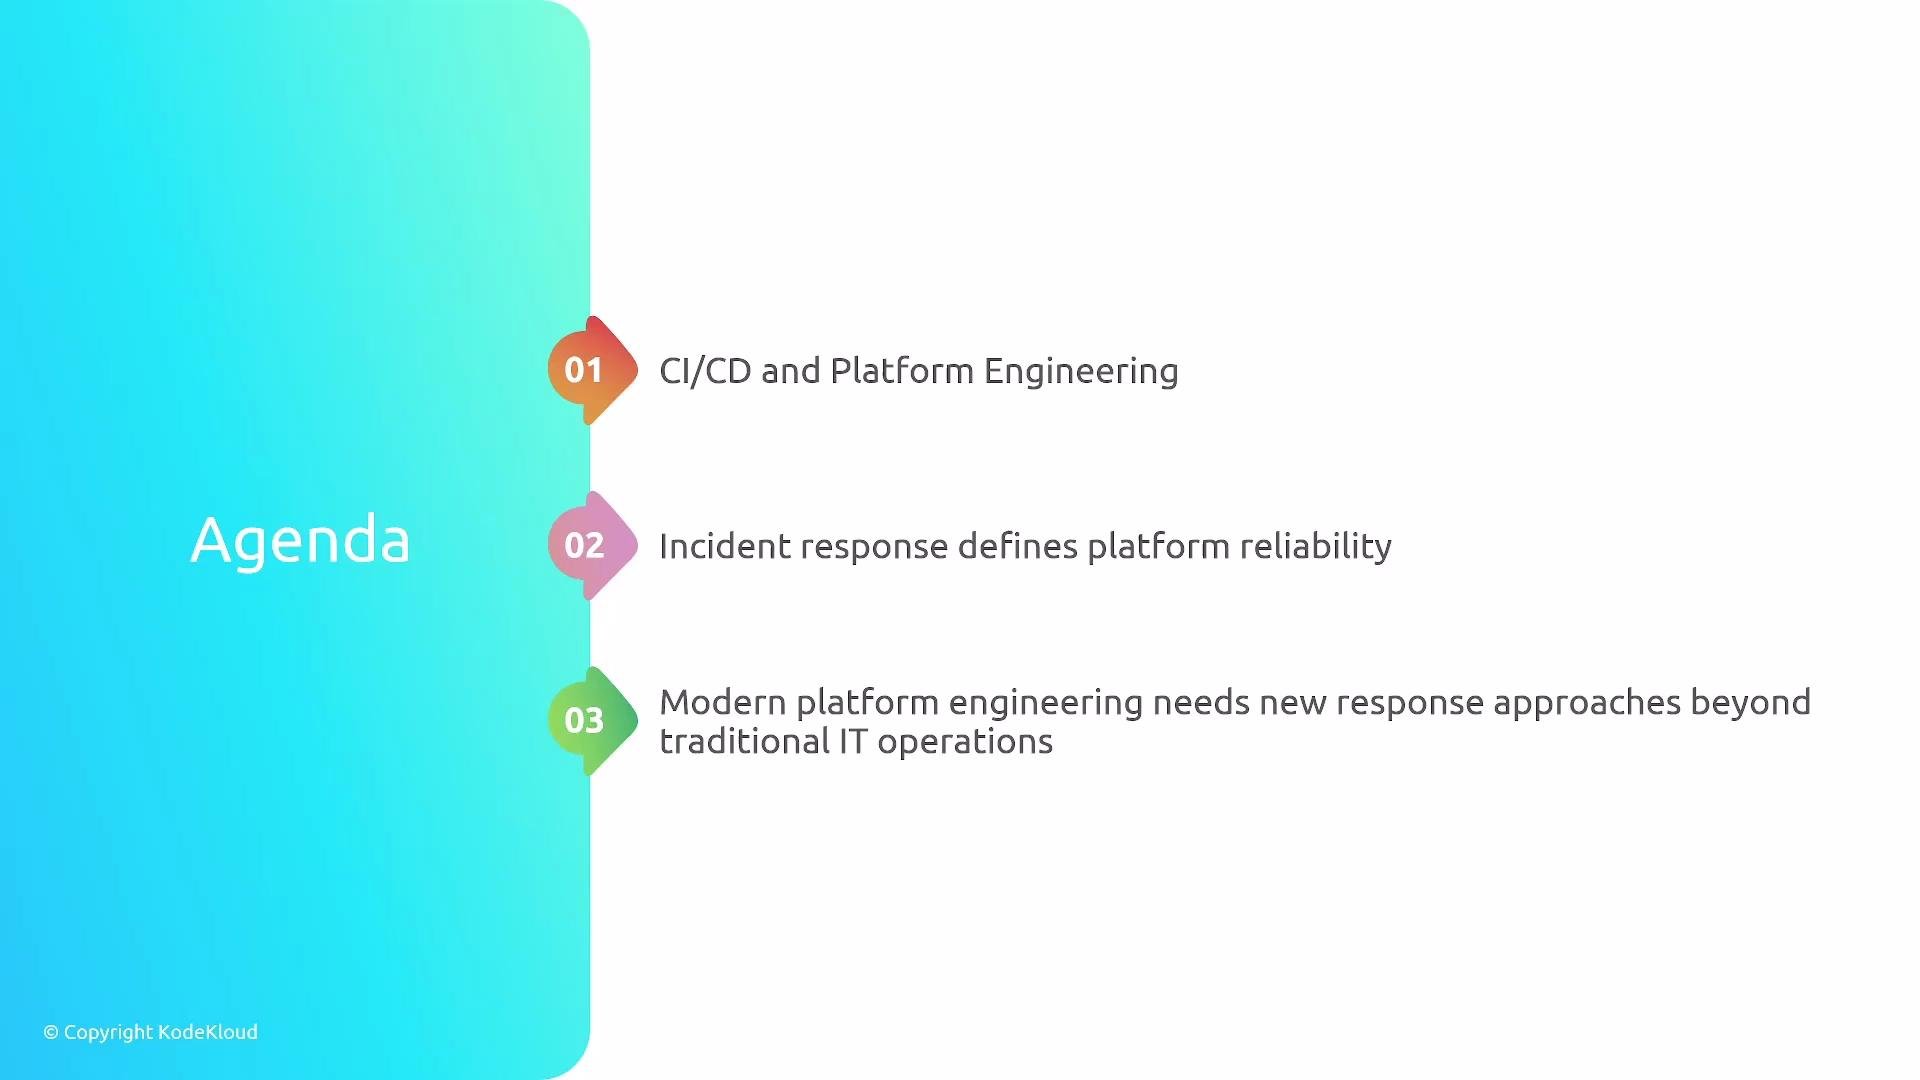
This guide focuses on platform-specific incident response patterns: MTTR components, runbooks (manual to automated), observability signals, escalation and communication practices, and blameless postmortems. Use the examples and commands here as templates for your runbooks and on-call playbooks.
Why this matters for platform engineering
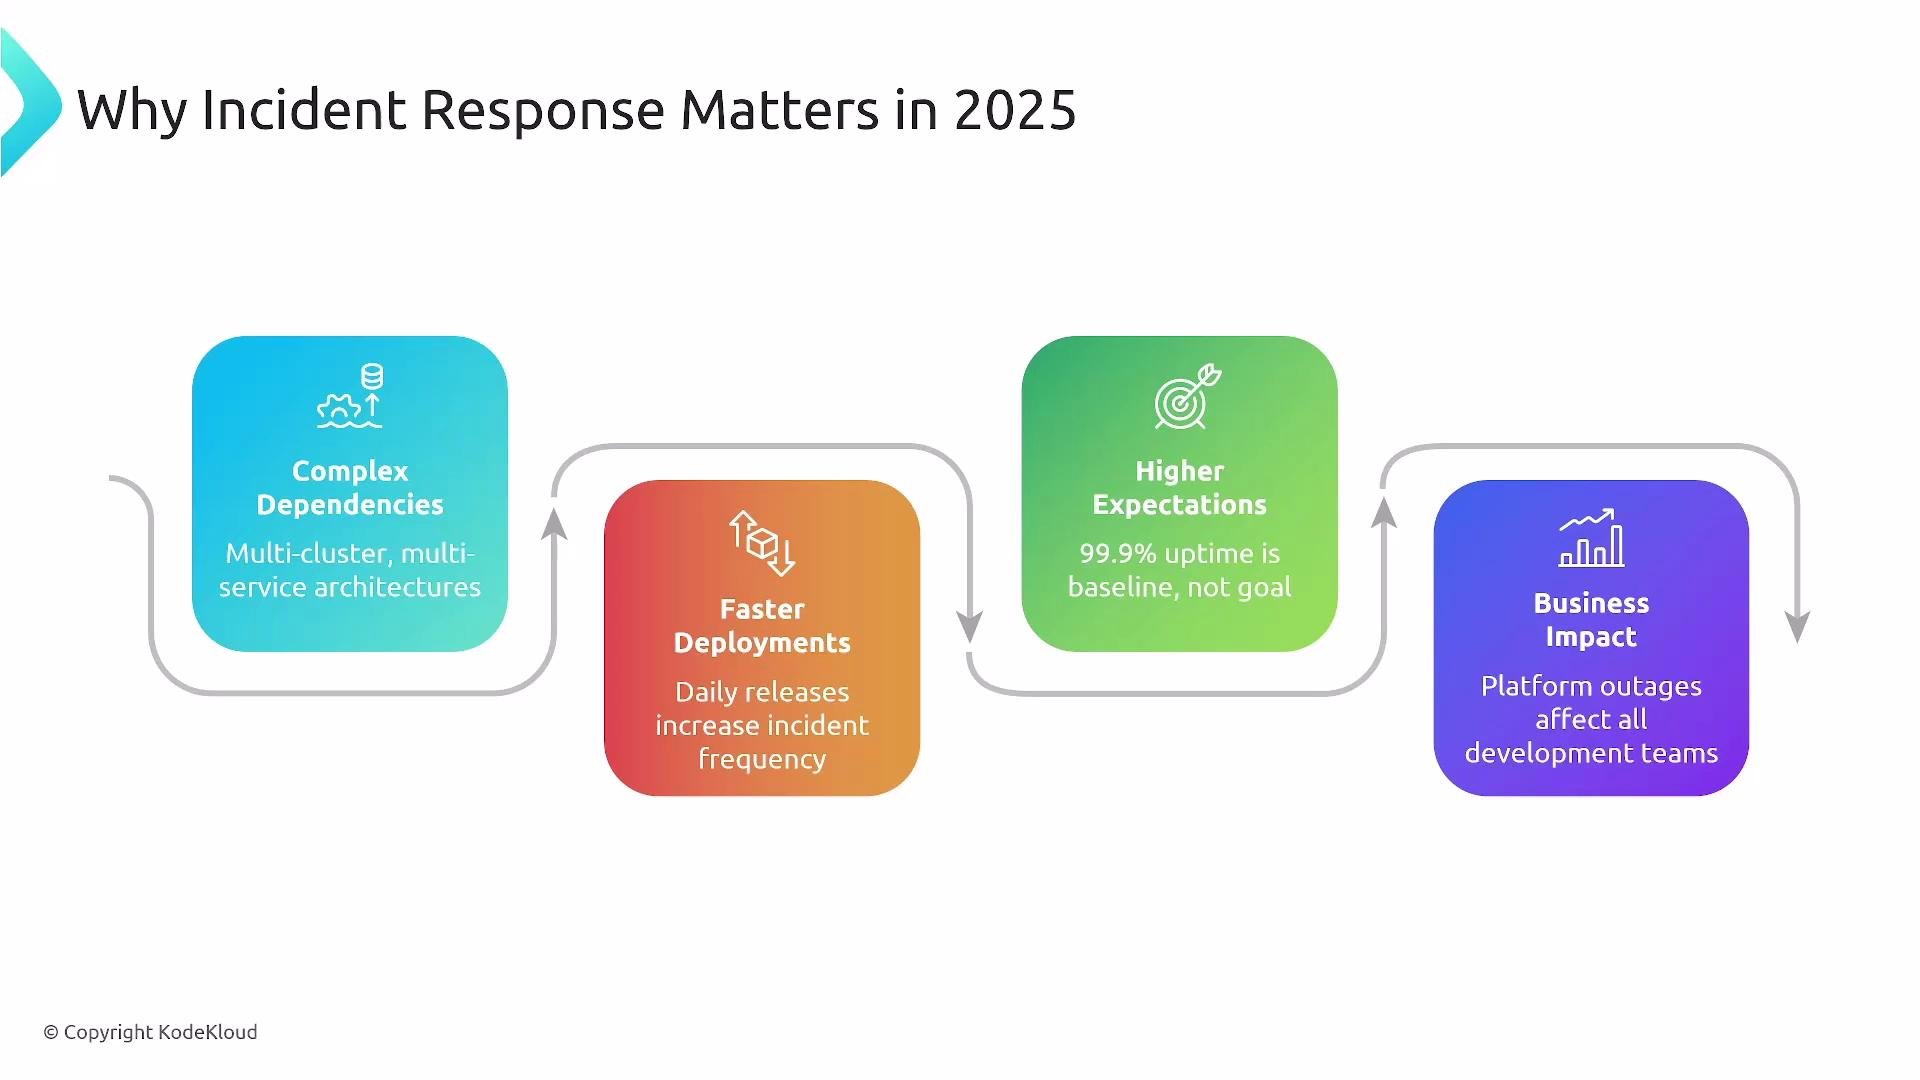
Platform teams operate shared infrastructure that many product teams depend on. This creates higher blast radius and stricter reliability expectations.- Platforms introduce complex, tightly-coupled systems: clusters, multi-cluster setups, and interdependent services. Failures can cascade.
- Faster, more frequent deployments increase the need for robust detection and remediation.
- SLAs and SLOs matter more because outages affect many teams.
- The primary customers are internal developers; developer productivity is a core reliability metric.
How platform incident response differs from traditional IT
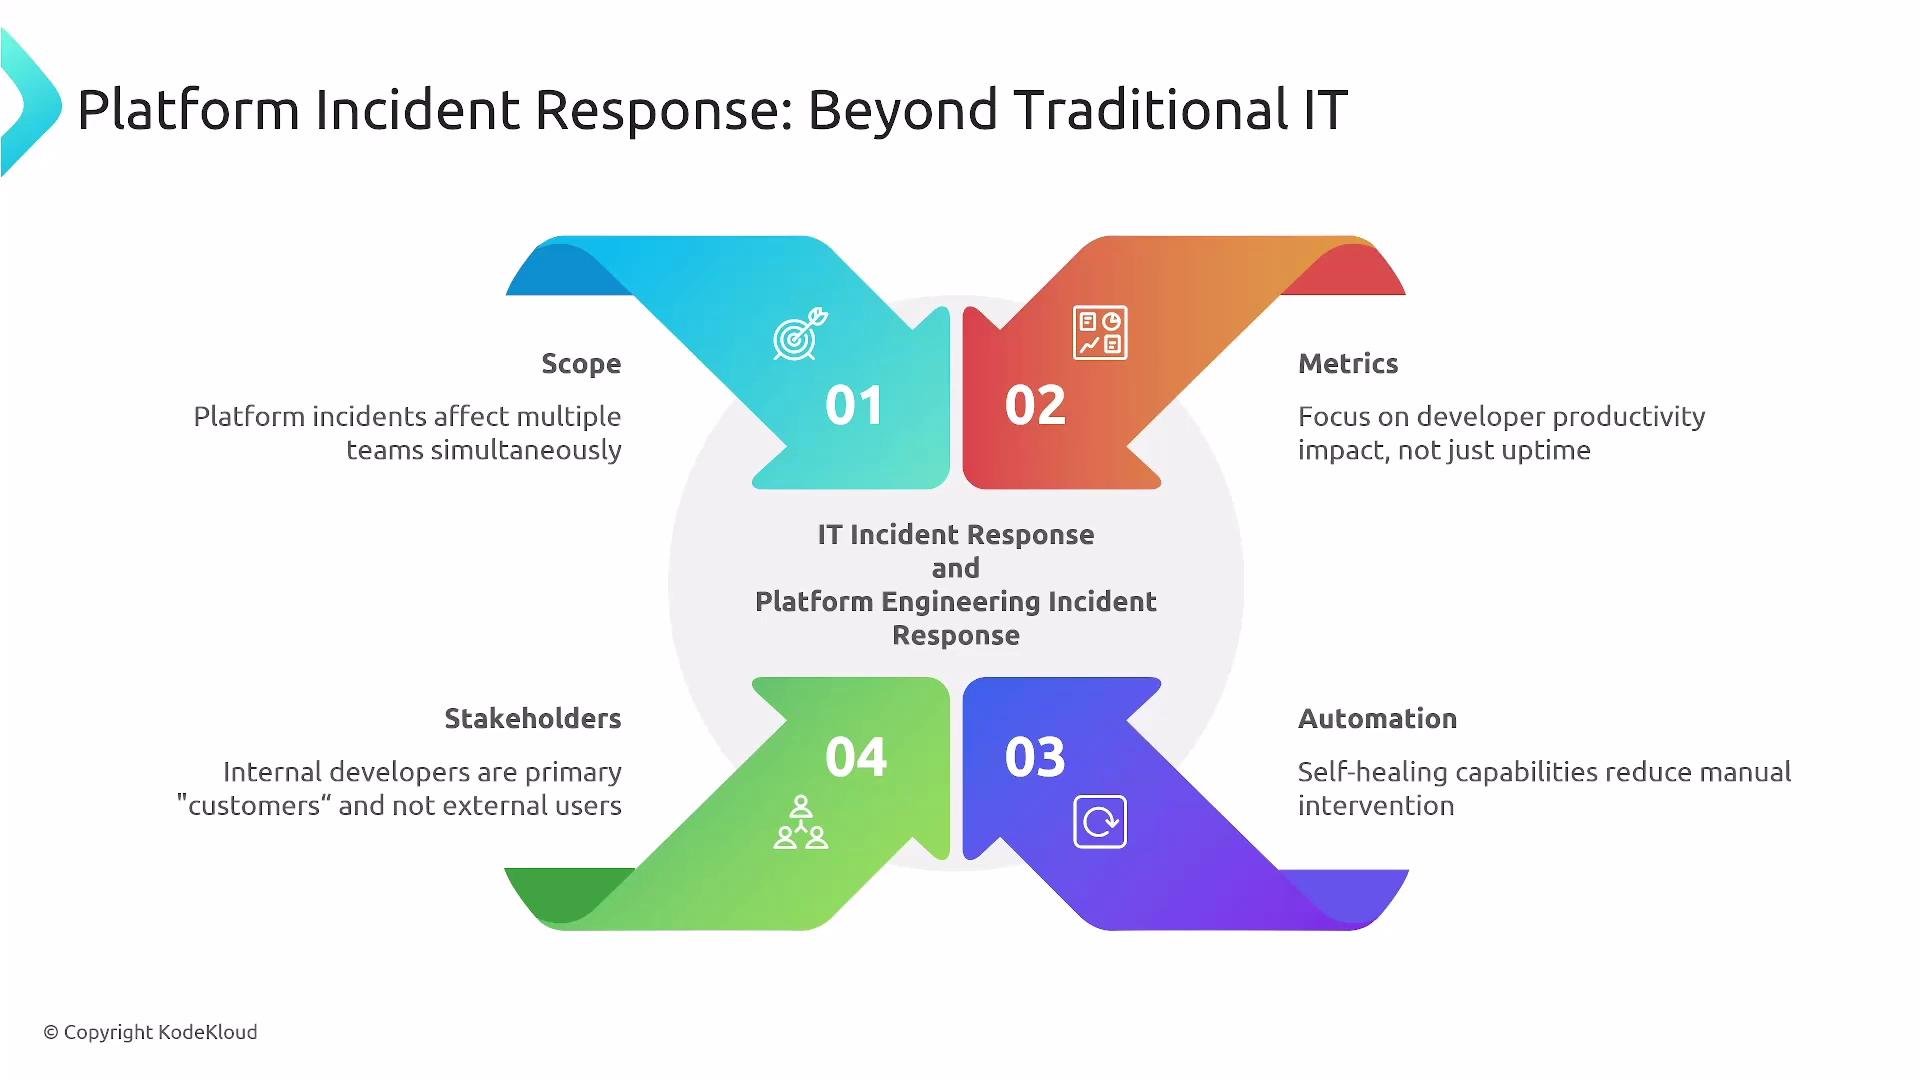
- Scope: incidents often affect many teams and services, not a single server.
- Metrics: we track developer productivity and deployment velocity as well as uptime.
- Automation: platforms should aim for self-healing and self-service to reduce manual tickets.
- Stakeholders: internal developer experience is the priority.
Mean Time To Recovery (MTTR) — break it down
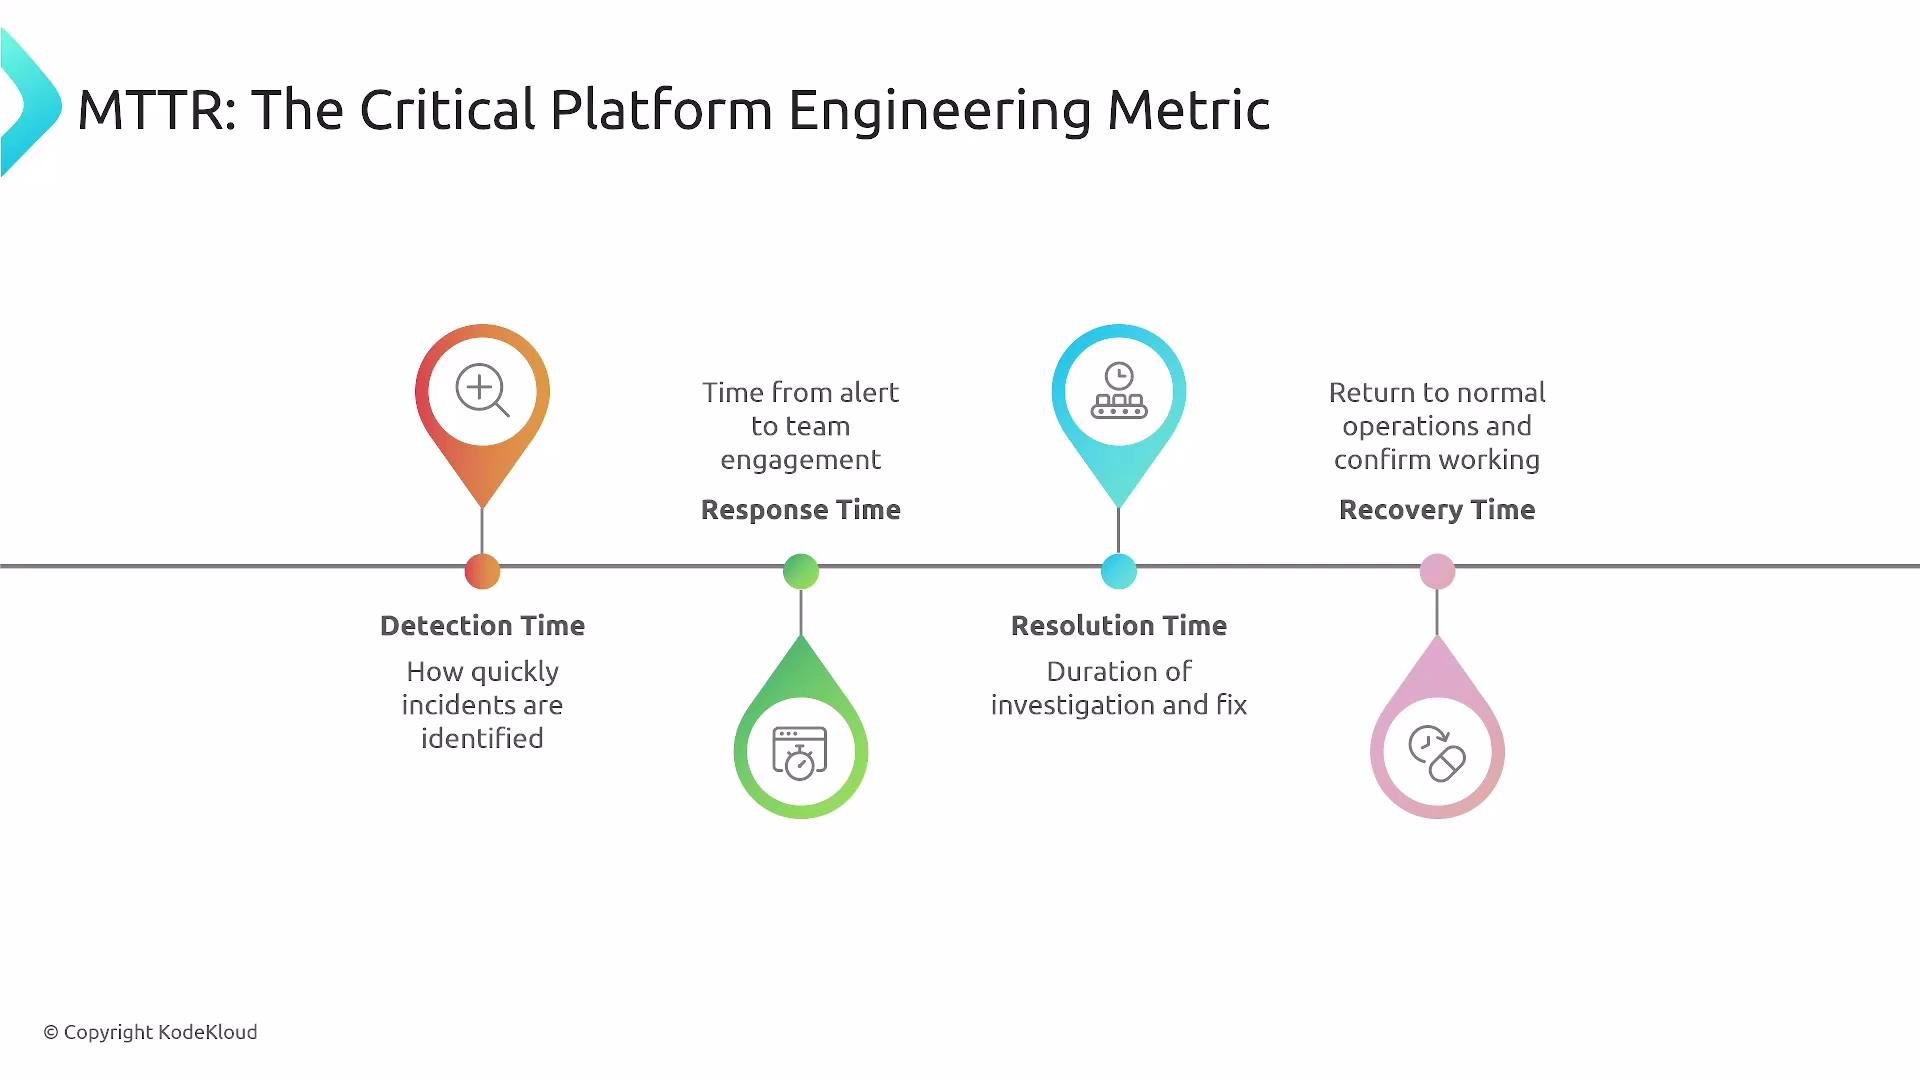
MTTR covers the full lifecycle of an incident: detection, response, resolution (investigation + fix), and recovery to normal operations. Measure and optimize each subcomponent.- Detection time: how quickly an incident is recognized.
- Response time: how quickly responders start working.
- Resolution time: how long until a fix is implemented.
- Recovery time: how long until normal operations are confirmed.
Define severity and targets clearly
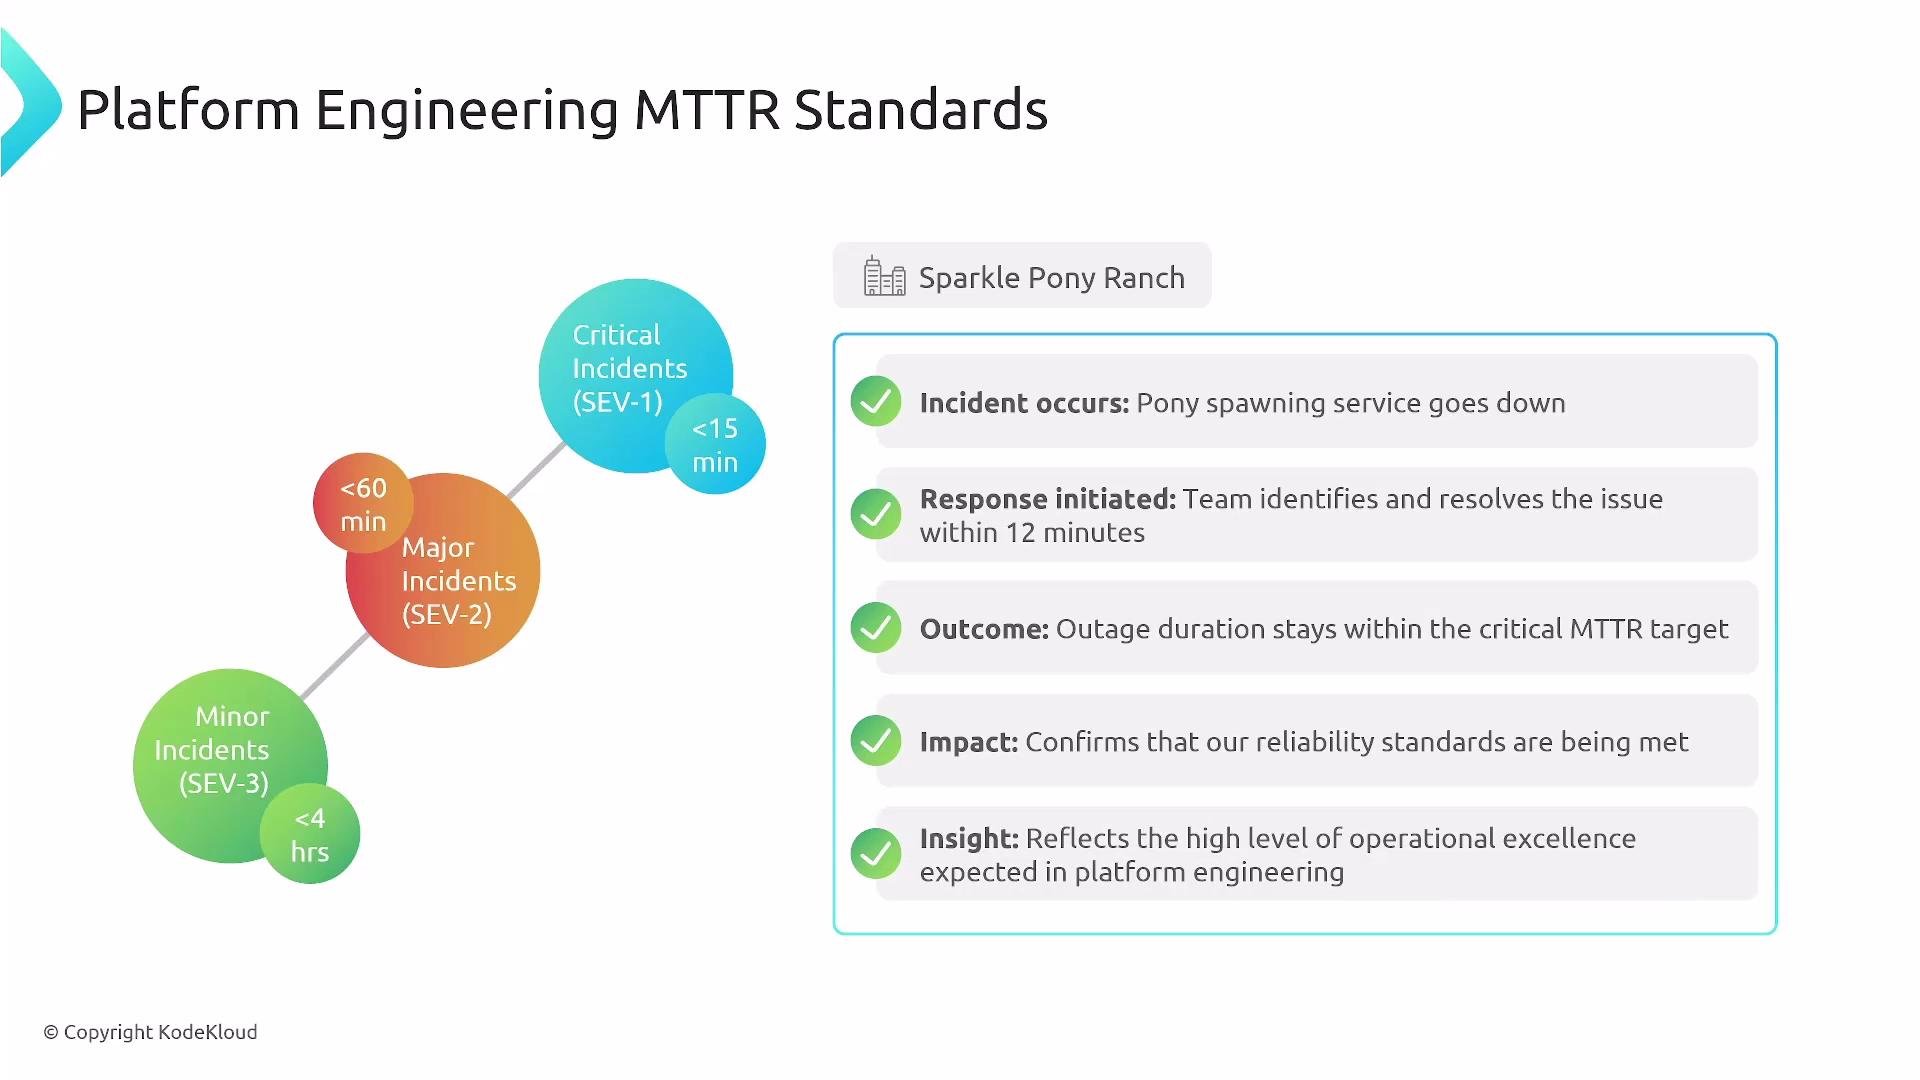
Agree on SEV levels and recovery targets (document in SLAs, SLOs, or internal runbooks). Clear targets enable reliable measurement and consistent response.- Example targets:
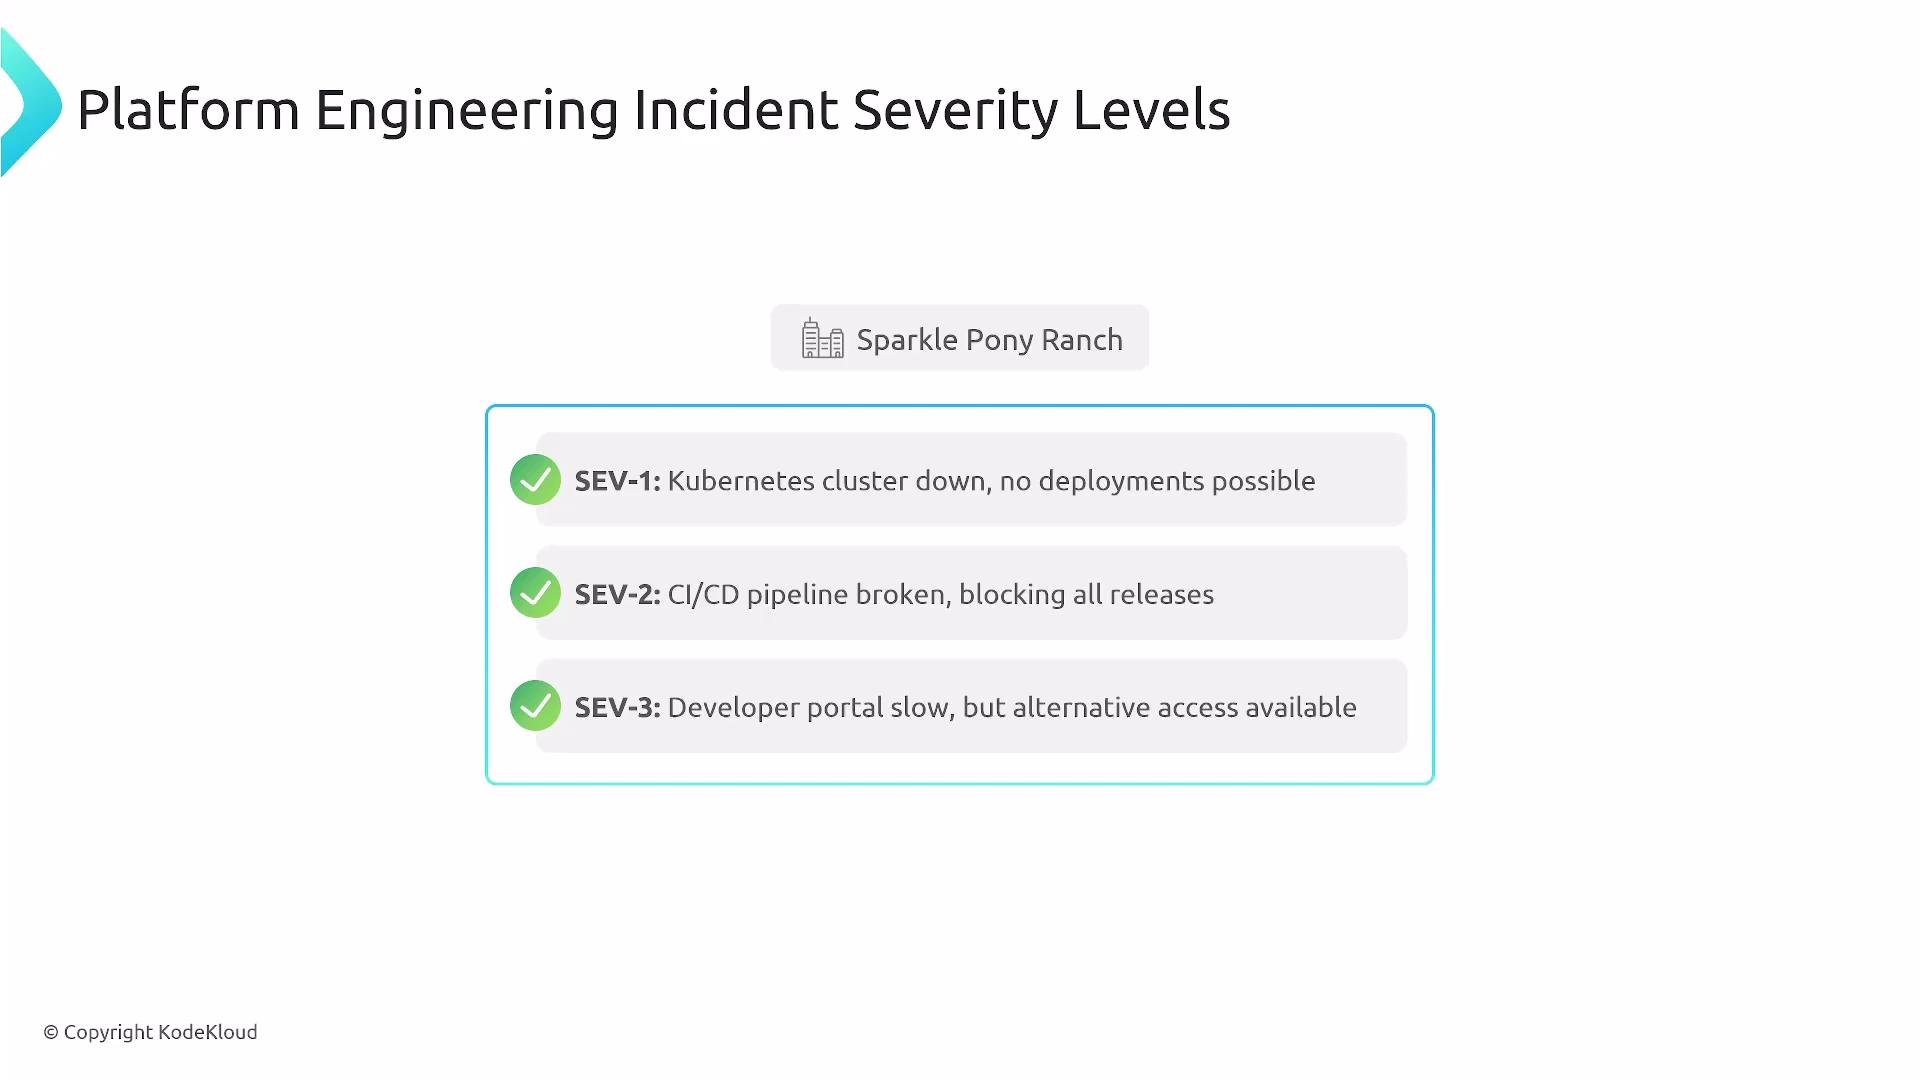
- SEV-1: < 15 minutes to respond
- SEV-2: < 60 minutes
- SEV-3: < 4 hours
On-call tooling (2025 practical stack)
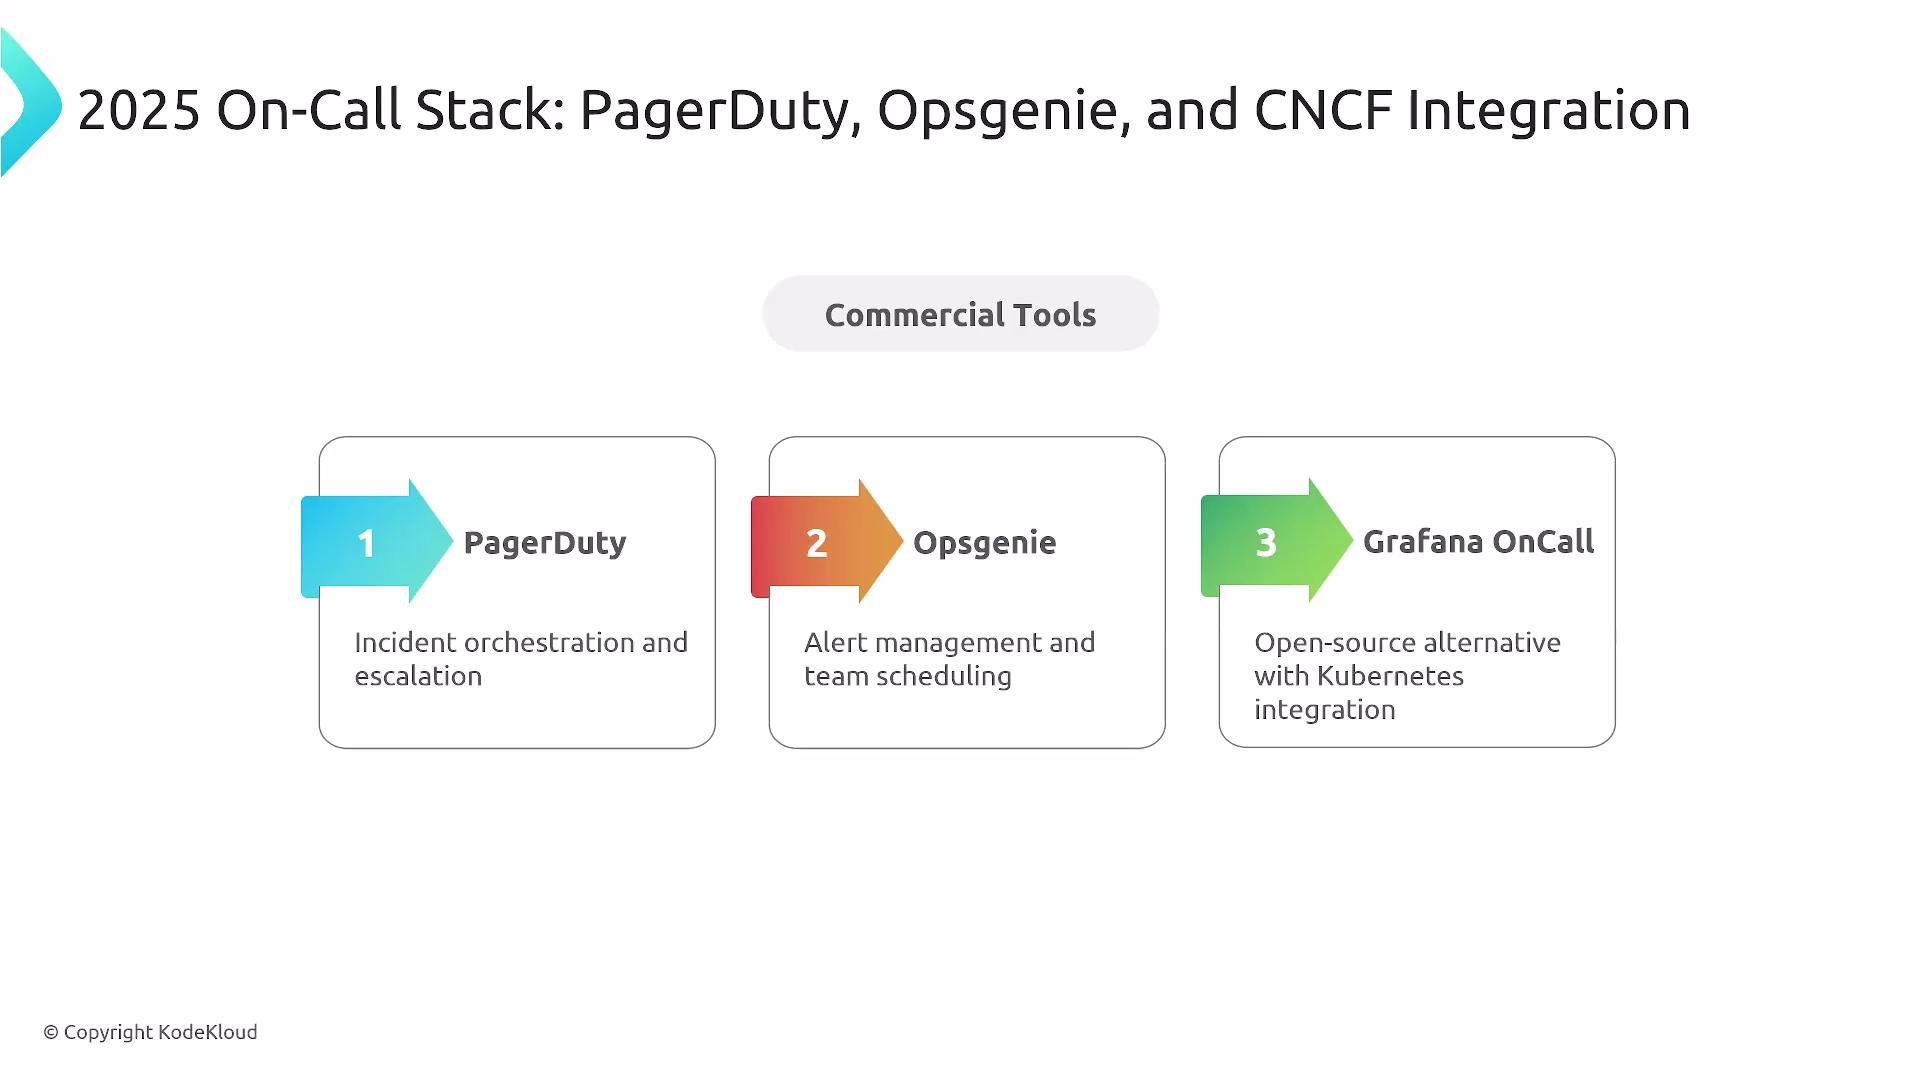
Commercial incident-management tools integrate alerts, runbooks, and chat. There’s no single CNCF-managed on-call suite that replaced these as of mid-2025.
Links and references:
Runbooks: structured, actionable playbooks
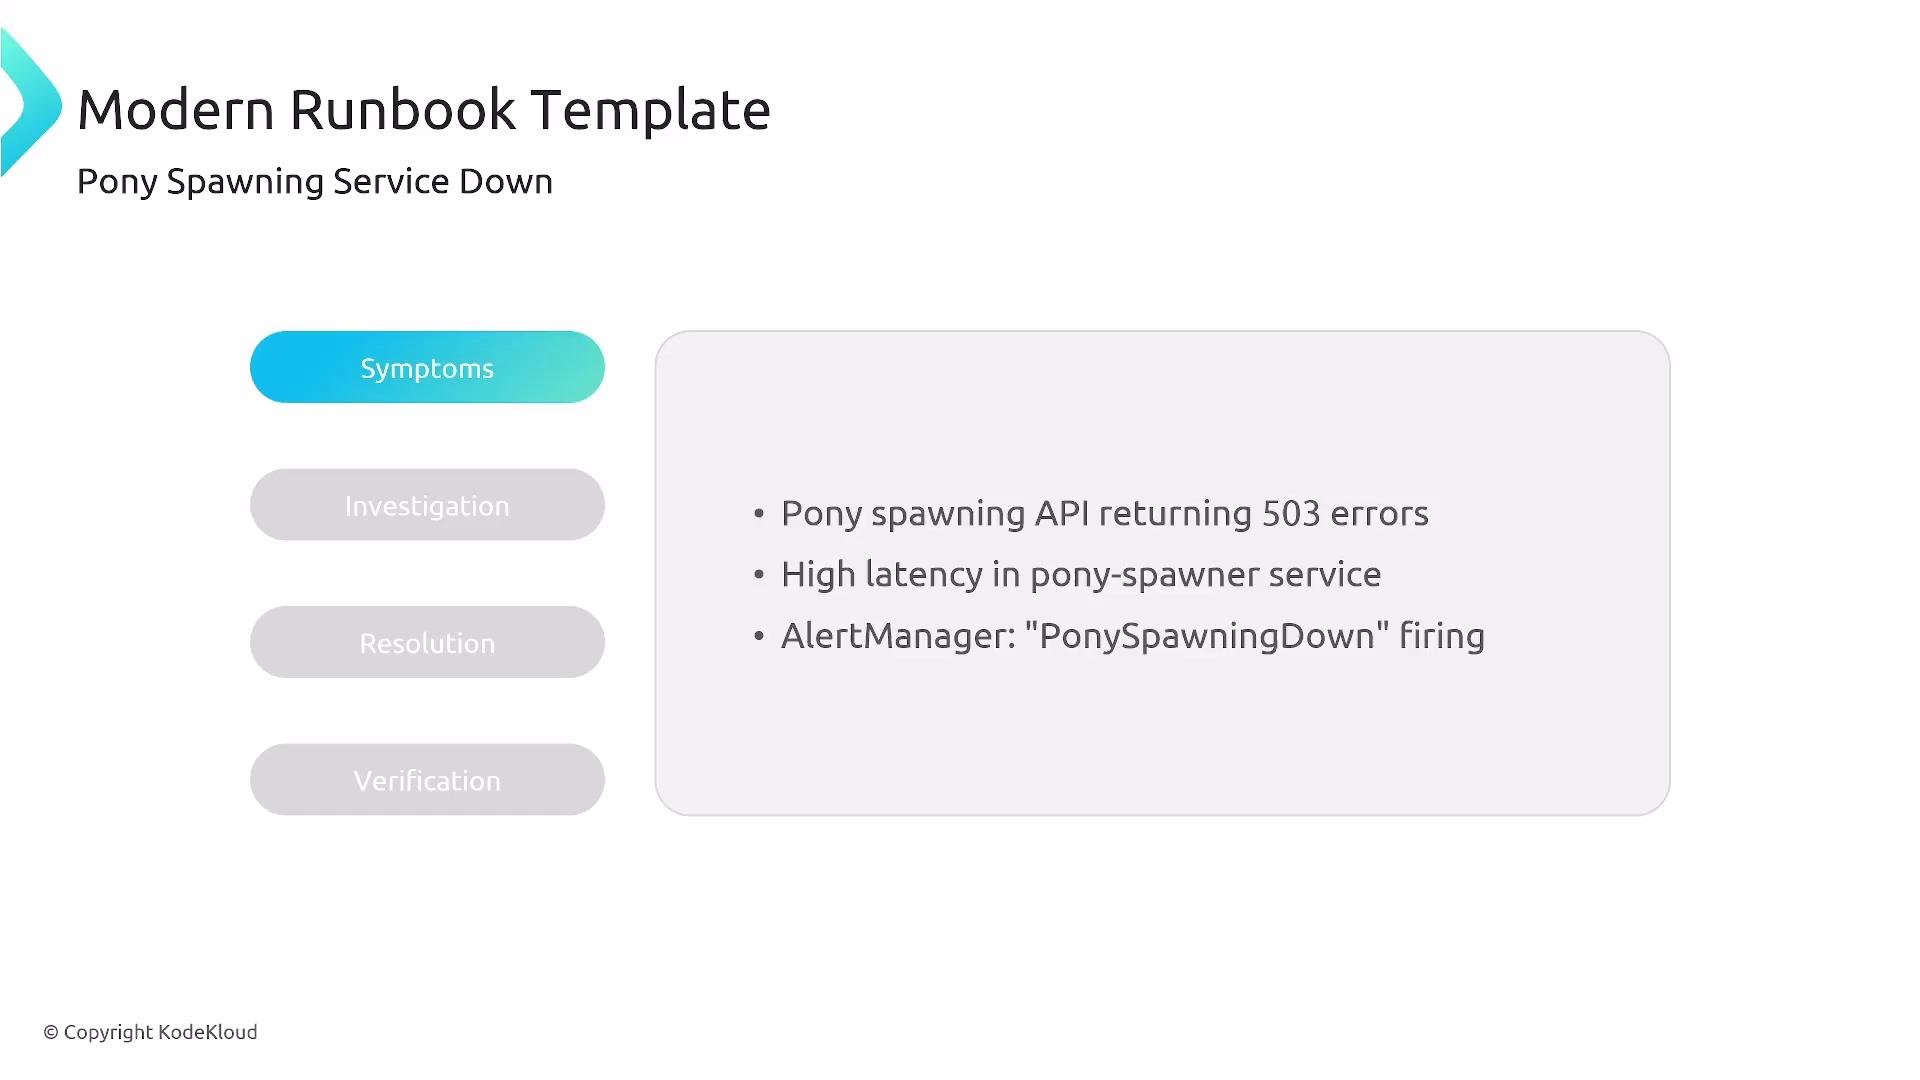
Runbooks (playbooks) should be step-by-step, discoverable, and validated so responders can act quickly—especially during nights or high-stress situations. A modern runbook typically includes:- Symptoms / triggers
- Investigation commands and context
- Possible fixes and when to apply them
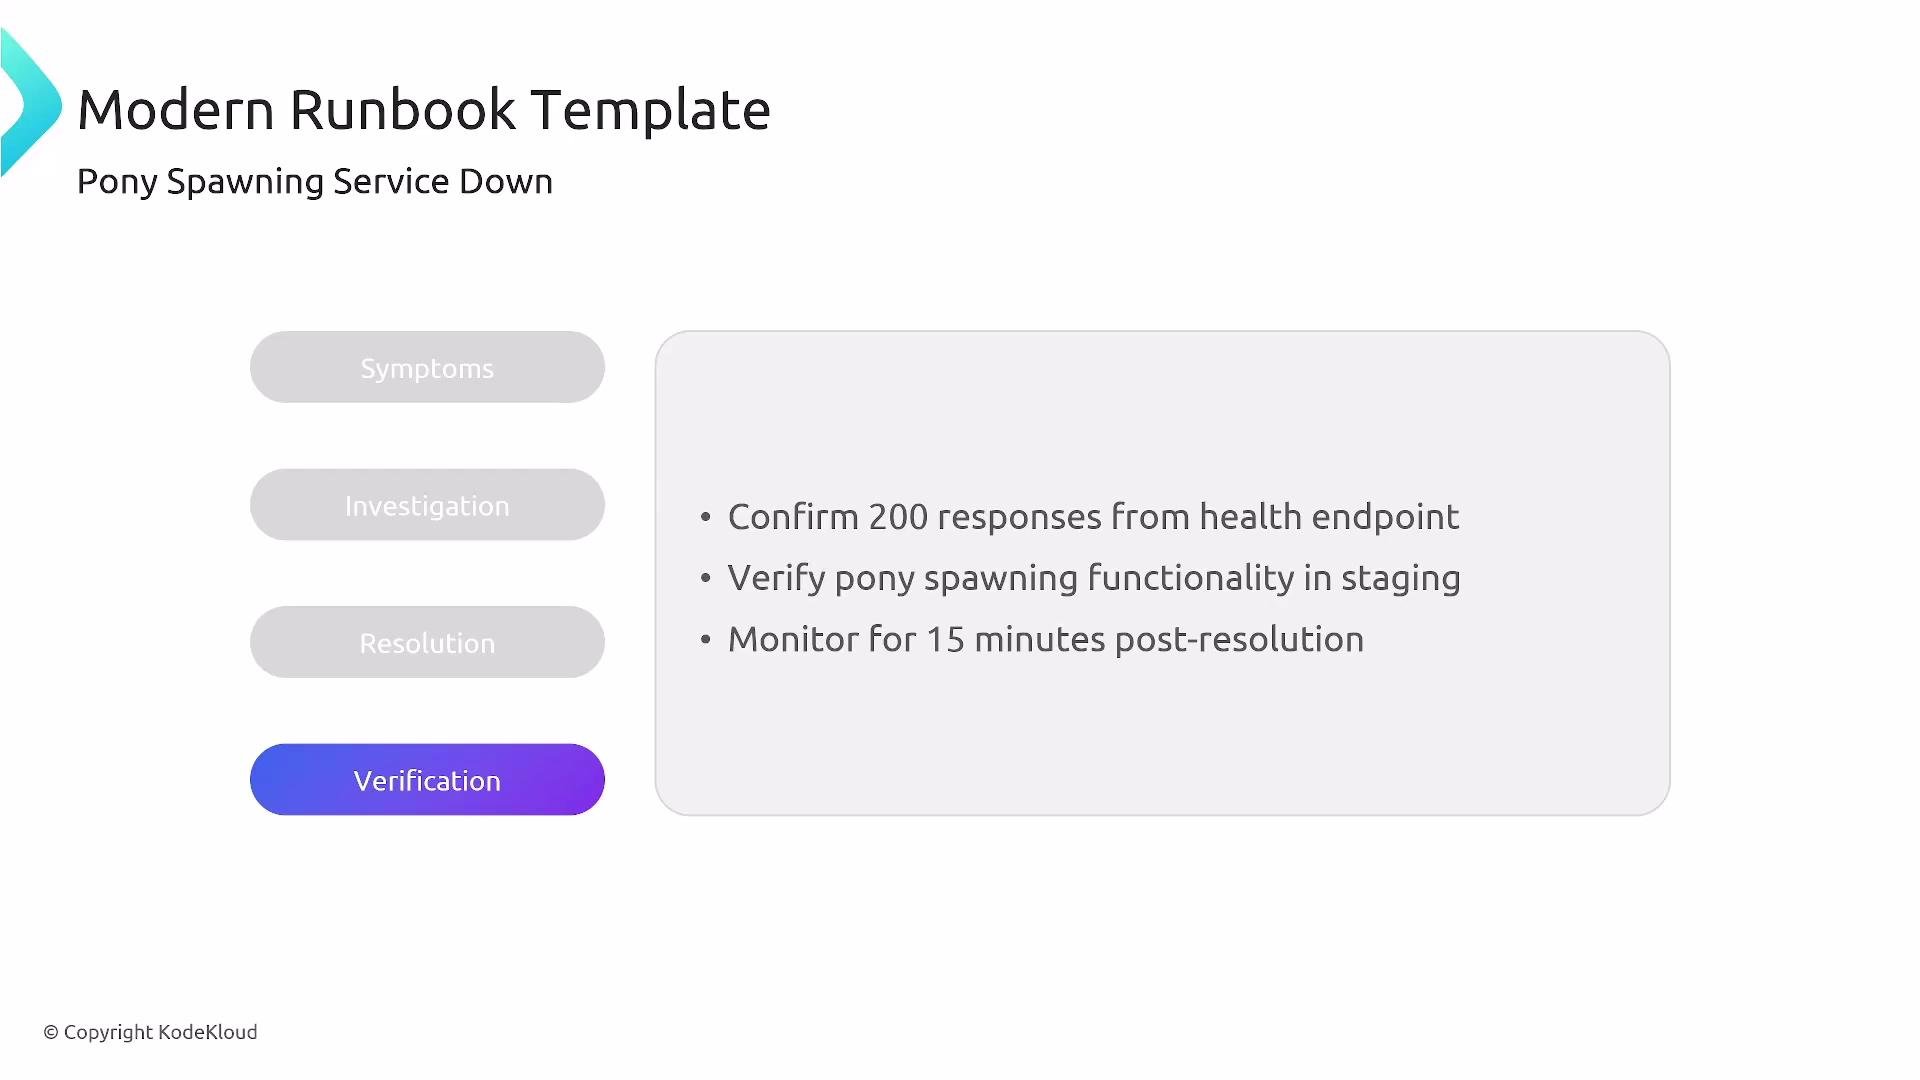
- Verification steps (post-fix checks)
- Post-resolution monitoring and owner
Runbook example: “Pony Spawning Service Down”
If Alertmanager pages you for 503s and high latency frompony-spawning:
- Inspect pods and replica status.
- Review logs and errors from recent deployments.
- Check dependencies (databases, upstream APIs) and network.
- Restart, scale, or roll back deployment as appropriate.
- Verify and monitor for at least 15 minutes after action.
- After applying fixes, monitor the service for a short post-resolution period (e.g., 15 minutes).
- Runbooks should include exact commands but assume platform-level familiarity.
Runbook ownership and validation
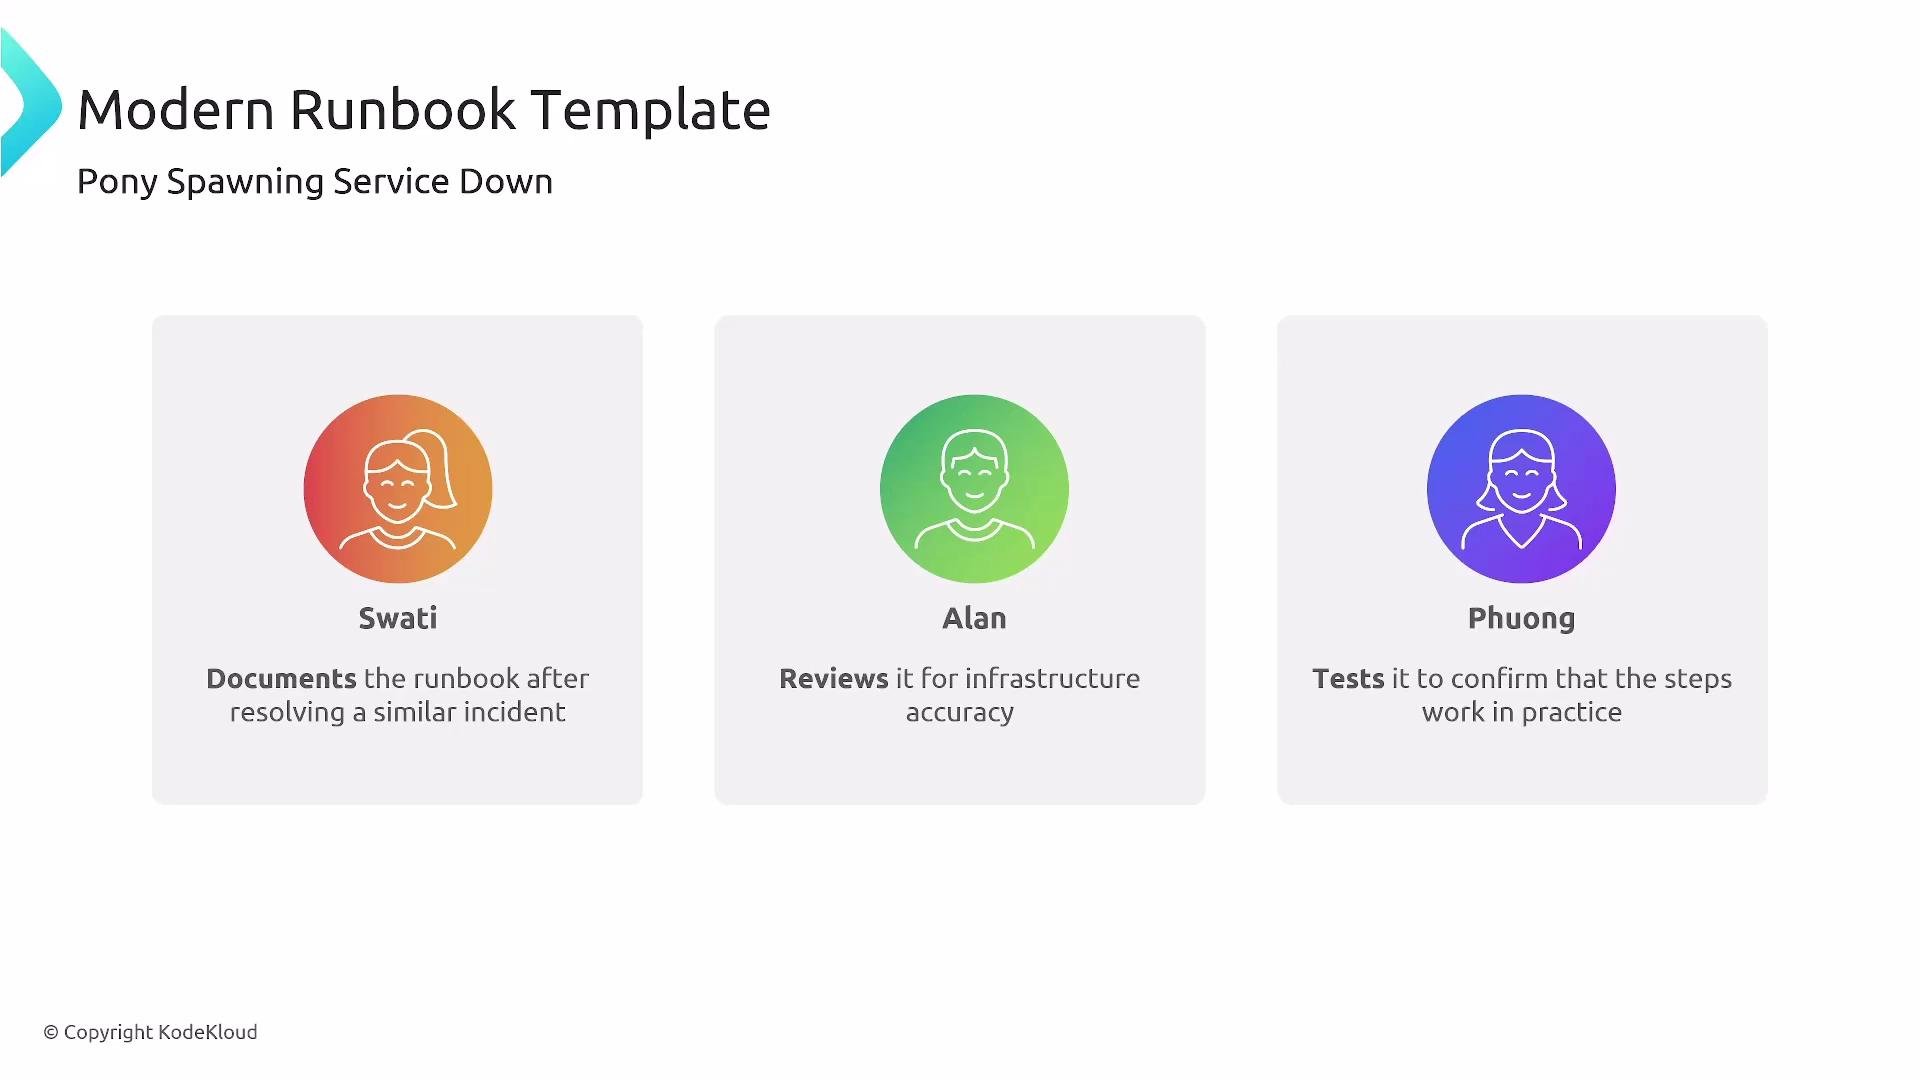
Use a Document → Review → Test loop to keep runbooks reliable. Assign roles for accountability:- Document: author documents the playbook after resolving an incident.
- Review: infra or security reviews steps and privileges.
- Test: a different engineer validates that the steps actually work (in staging if possible).
Automation levels for runbooks
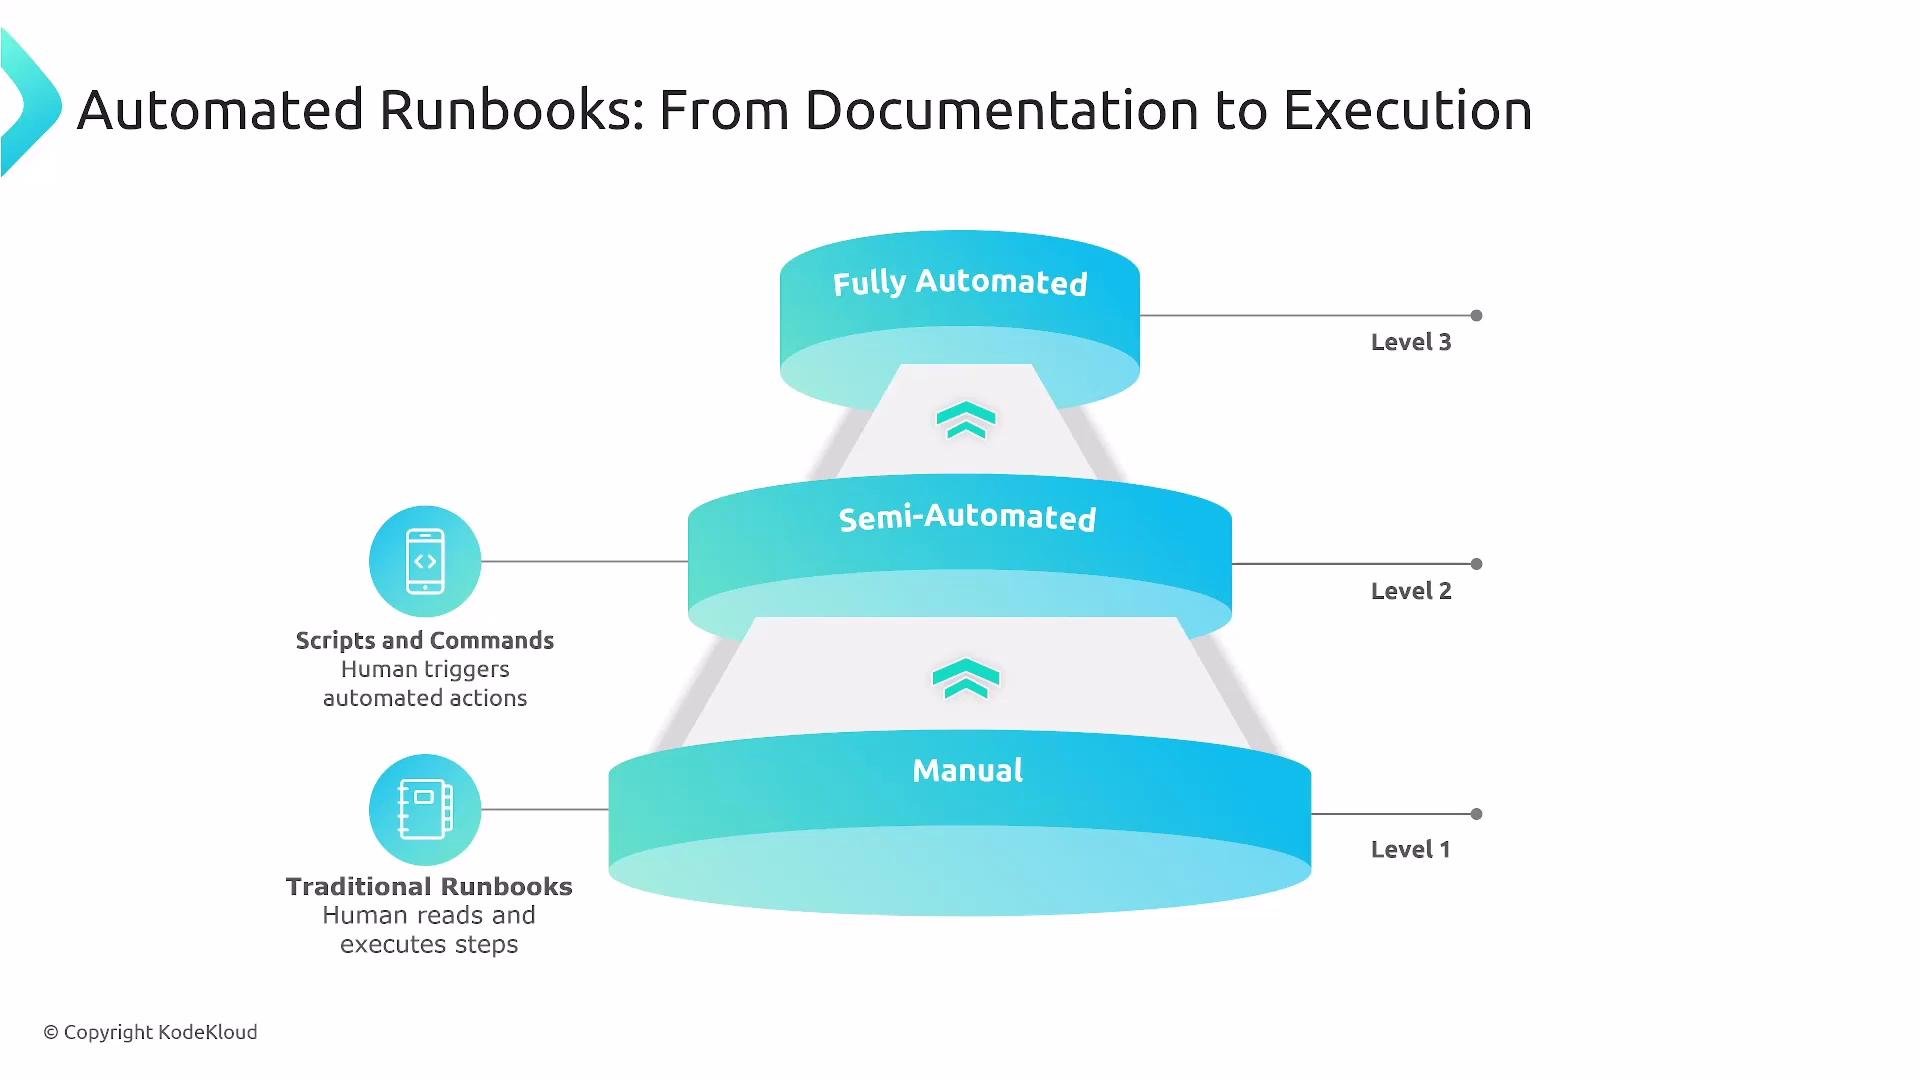
- Manual: human executes steps exactly.
- Semi-automated: scripts or chat-triggered playbooks require a human to trigger them.
- Fully automated: the system attempts remediation automatically and only pages humans on failure or if escalation is required.
Automate thoughtfully. Fully automated remediation reduces toil but requires safe guards: canarying, circuit-breakers, rate-limits, and rollback strategies. Always define escalation paths if automation fails.
Automated integrations
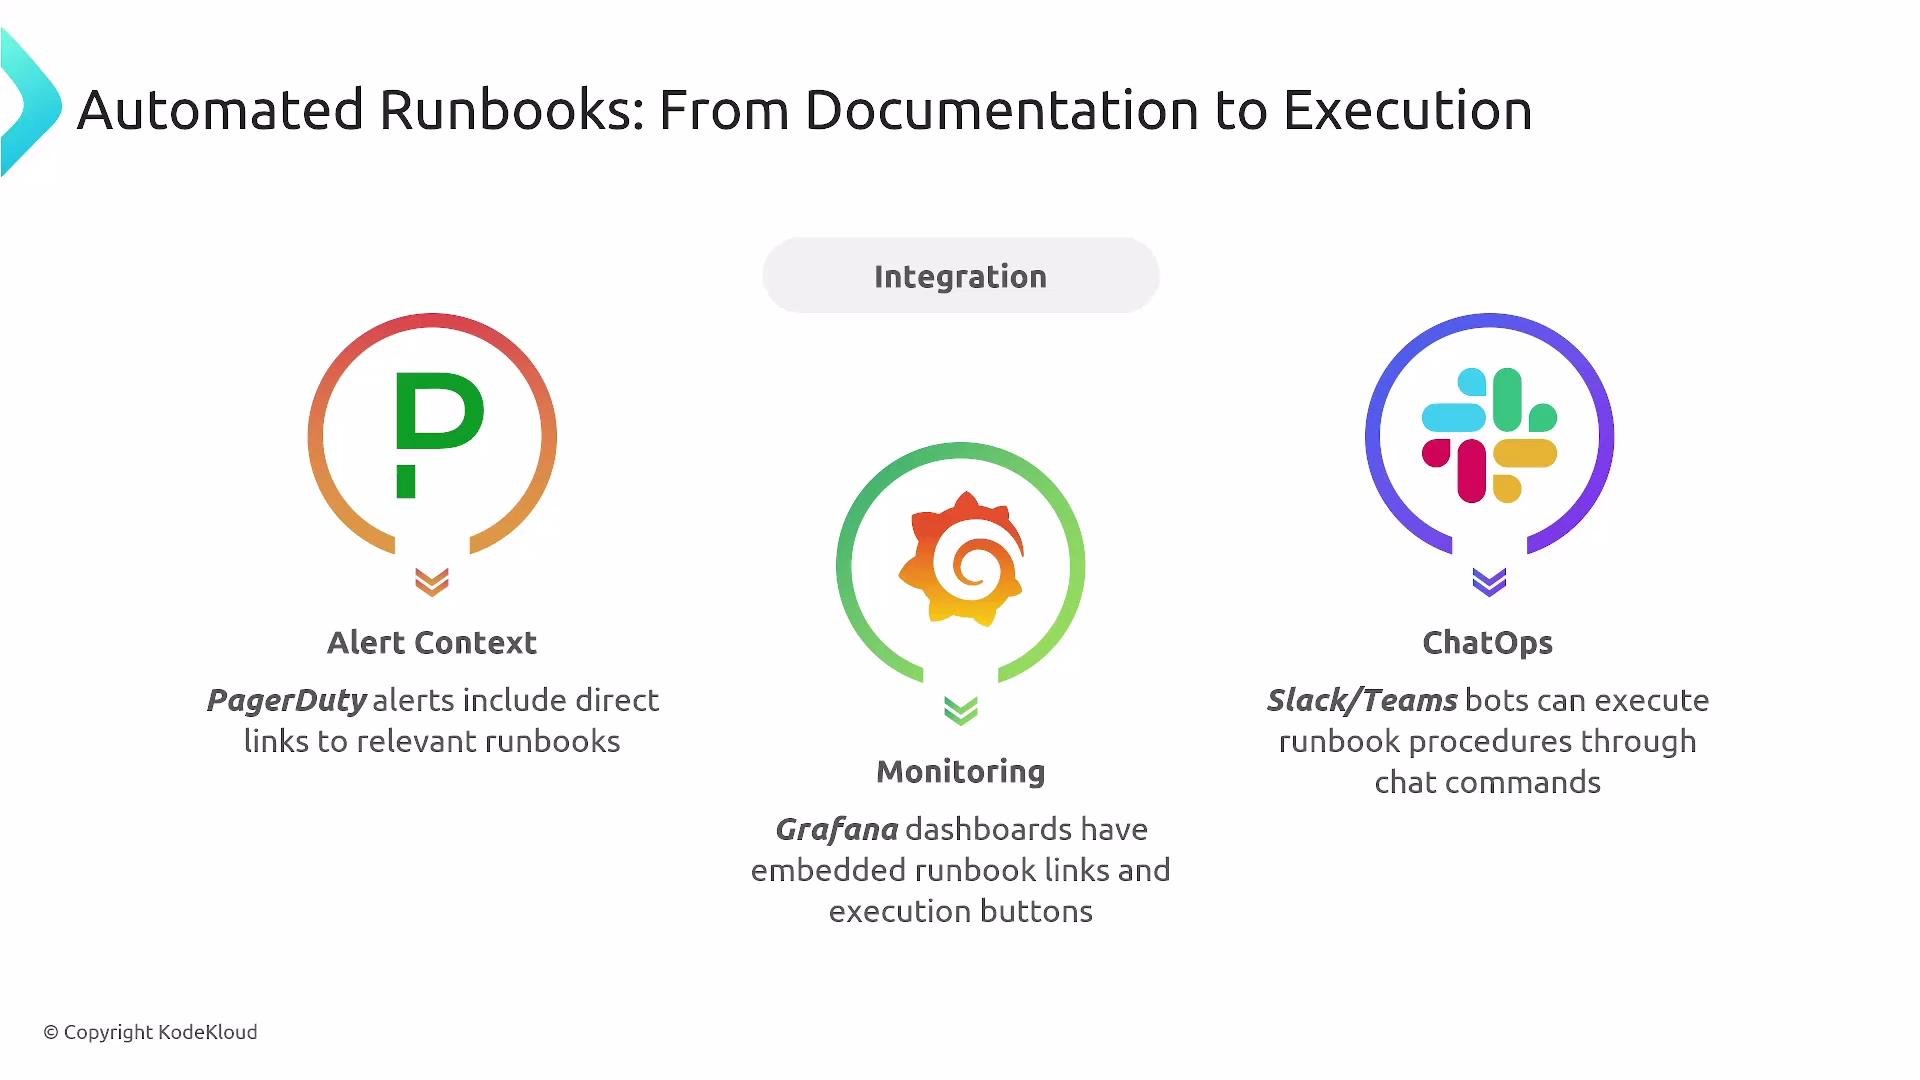
- Alert systems (PagerDuty, Grafana OnCall) should include runbook links and dashboard context.
- Chat platforms (Slack/Teams/Discord) can host slash-commands or bots to trigger semi-automated actions (restart service, scale deployment).
- Integrate monitoring context (graphs, logs, traces) into the incident notification to speed diagnosis.
Common platform incident types
Platform incidents often fall into these categories: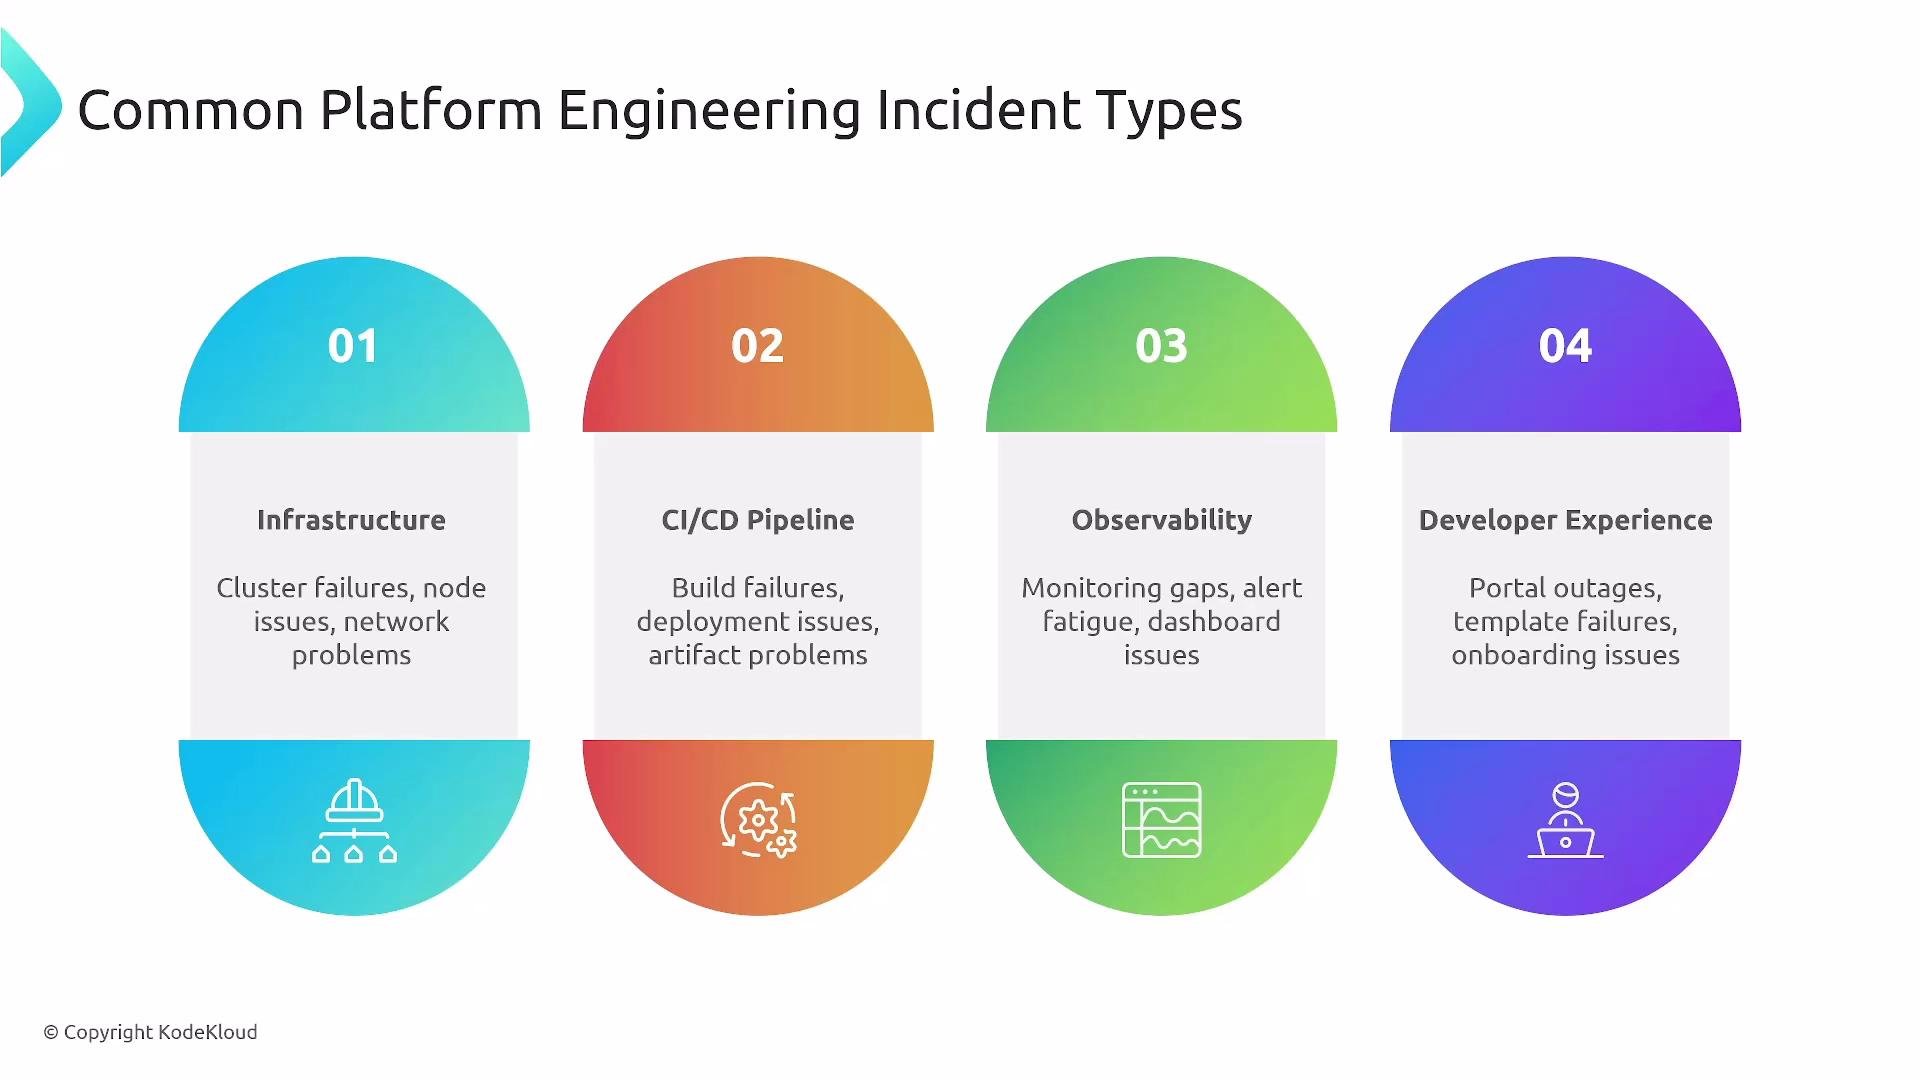
Kubernetes-specific incidents
Examples include pod crashes, resource exhaustion, networking failures, sidecar/service mesh issues, and RBAC/permission regressions. When troubleshooting, collect component status, recent changes, events, and logs.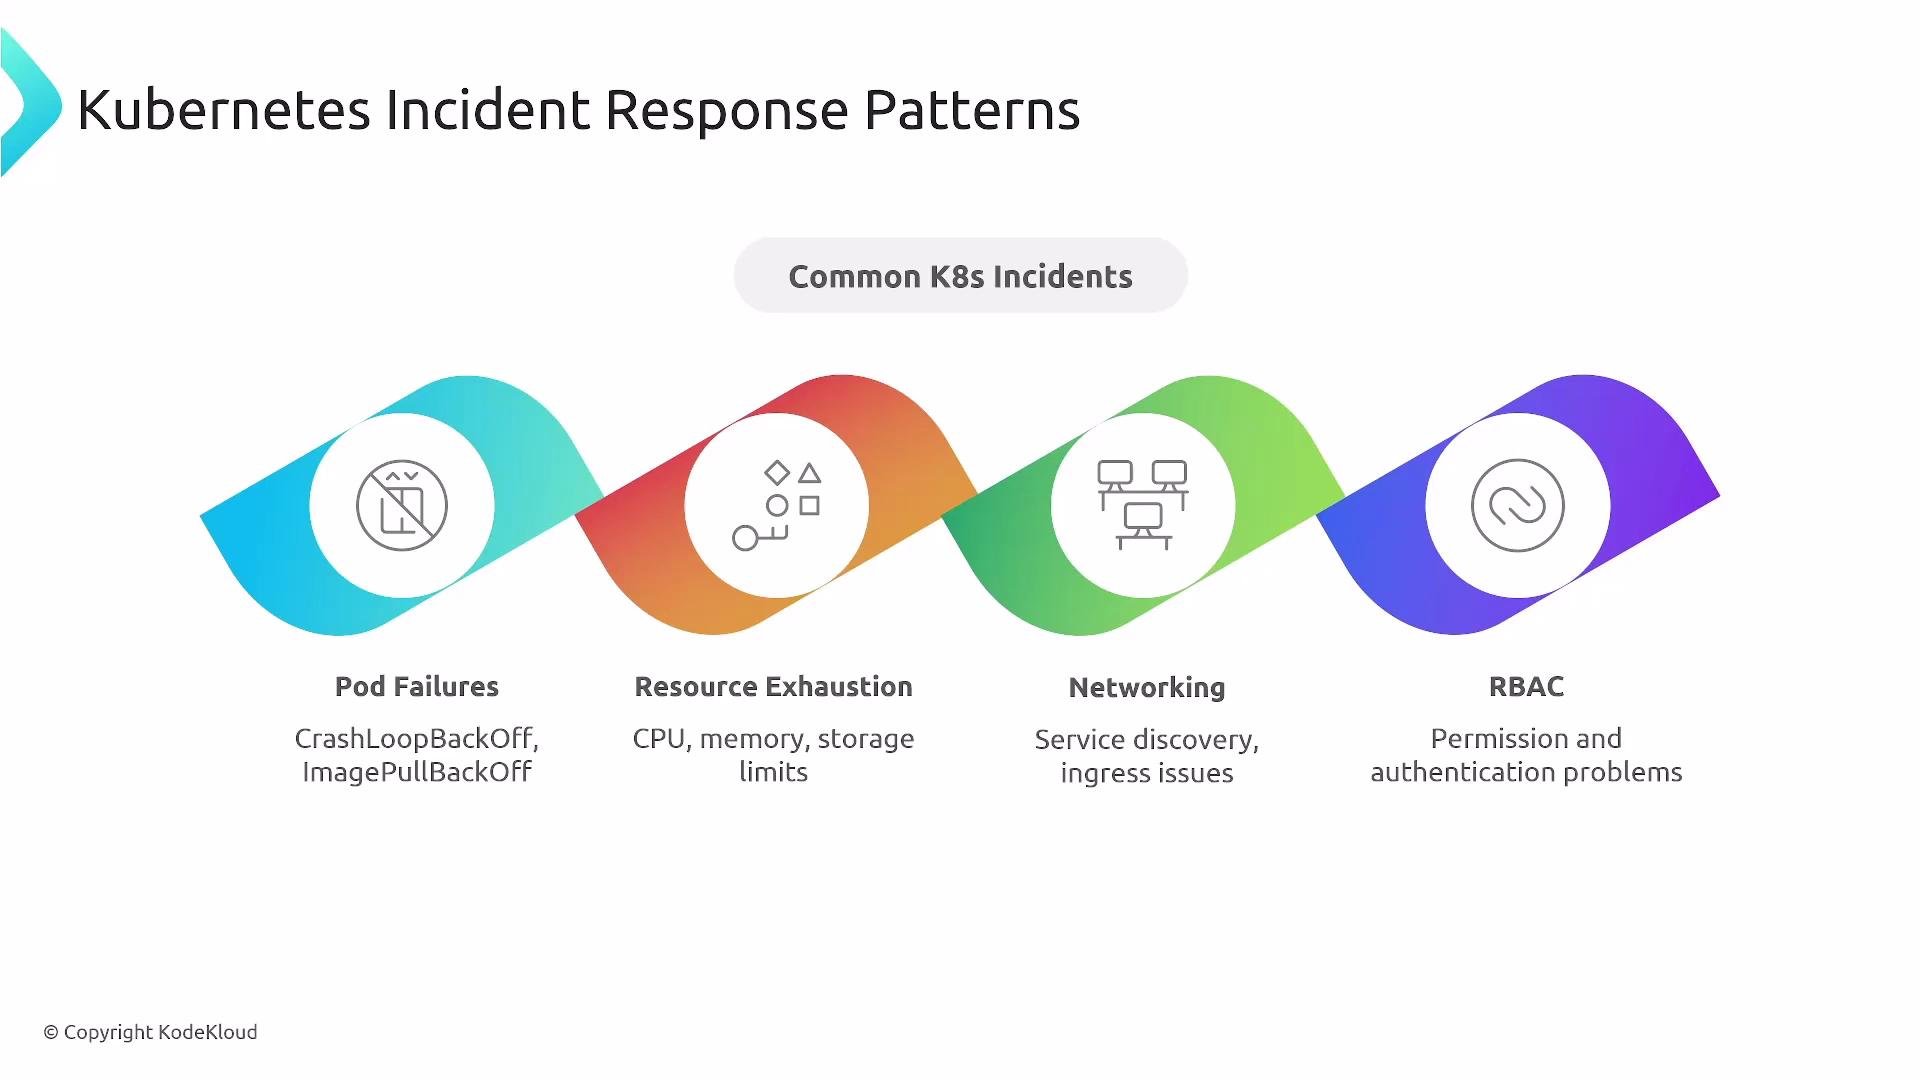
Tip: Put these exact commands in runbooks but ensure they’re scoped and safe (least privileges).
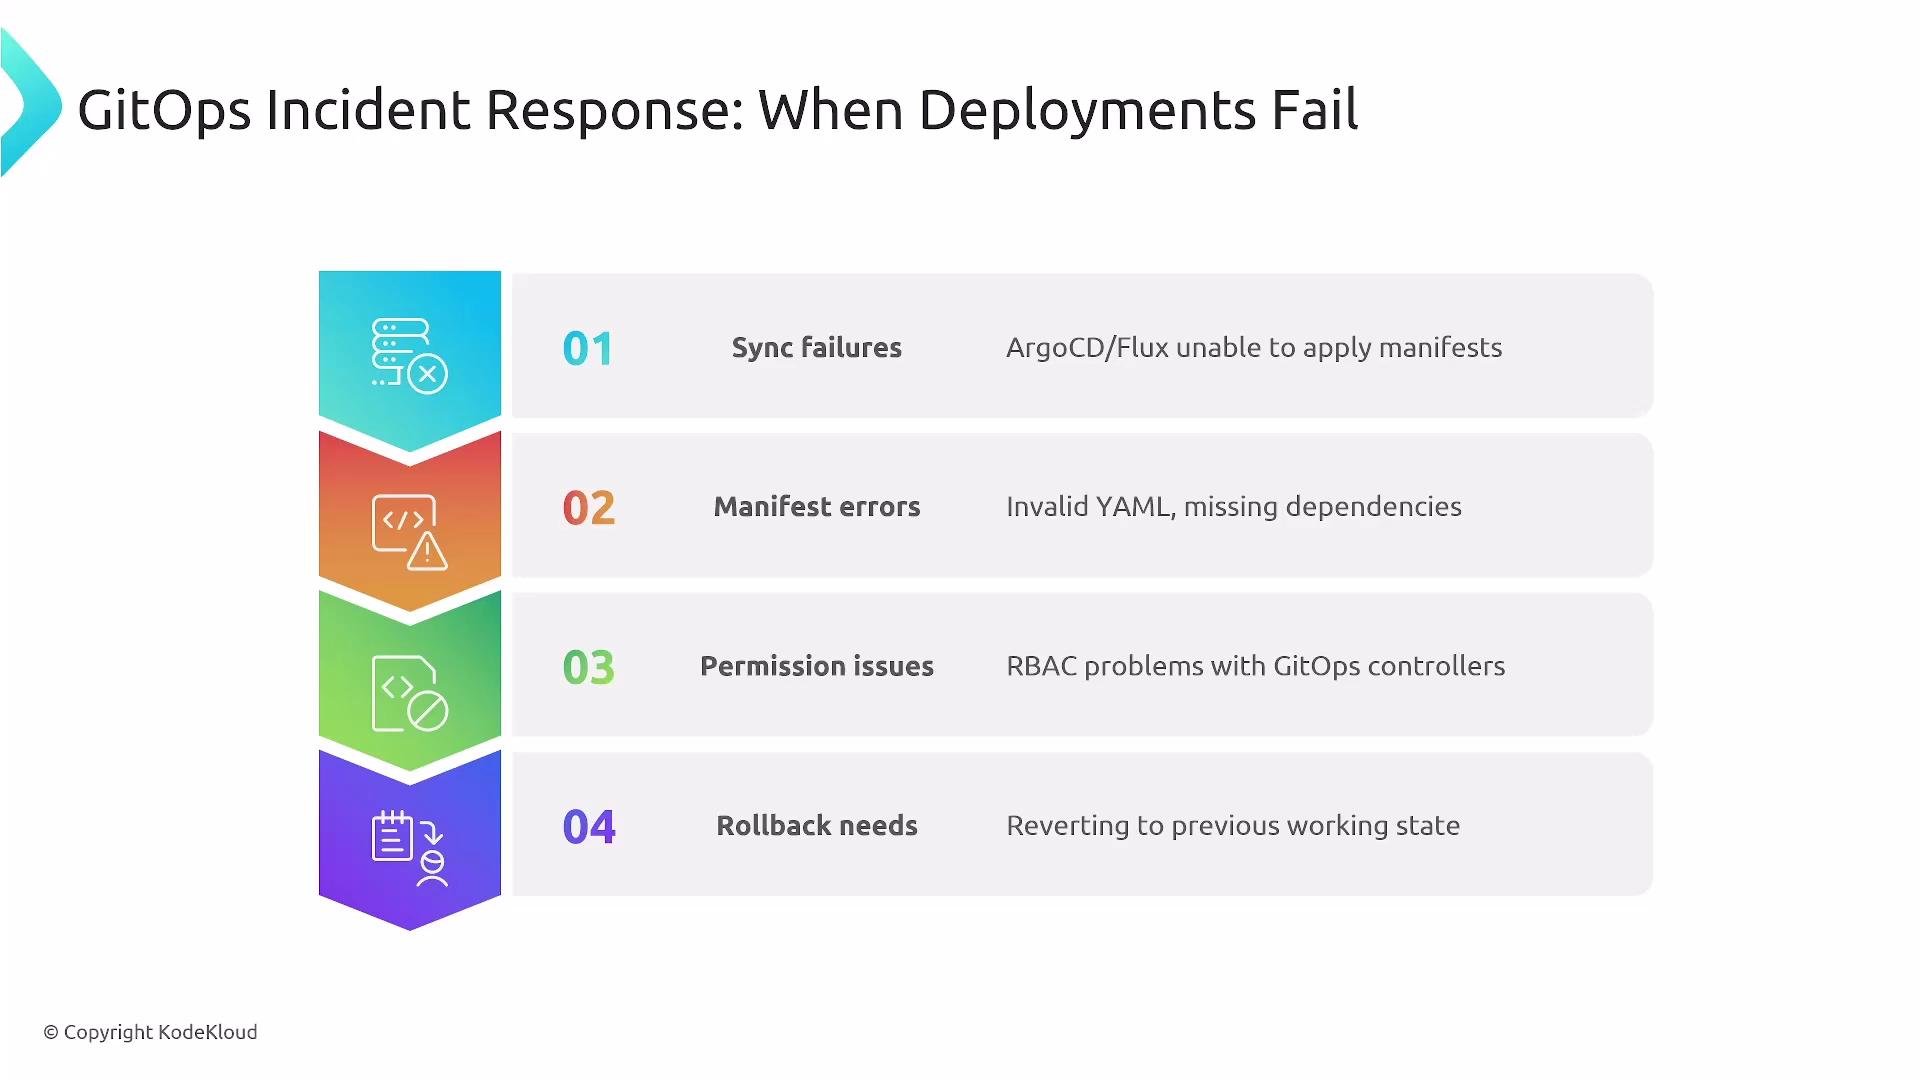
GitOps and deployment failures
Common causes:- Sync failures (Argo/Flux)
- Broken YAML manifests or schema validation errors
- Dependency ordering or hooks that fail
- RBAC/permission problems or service-account regressions
Observability for faster resolution
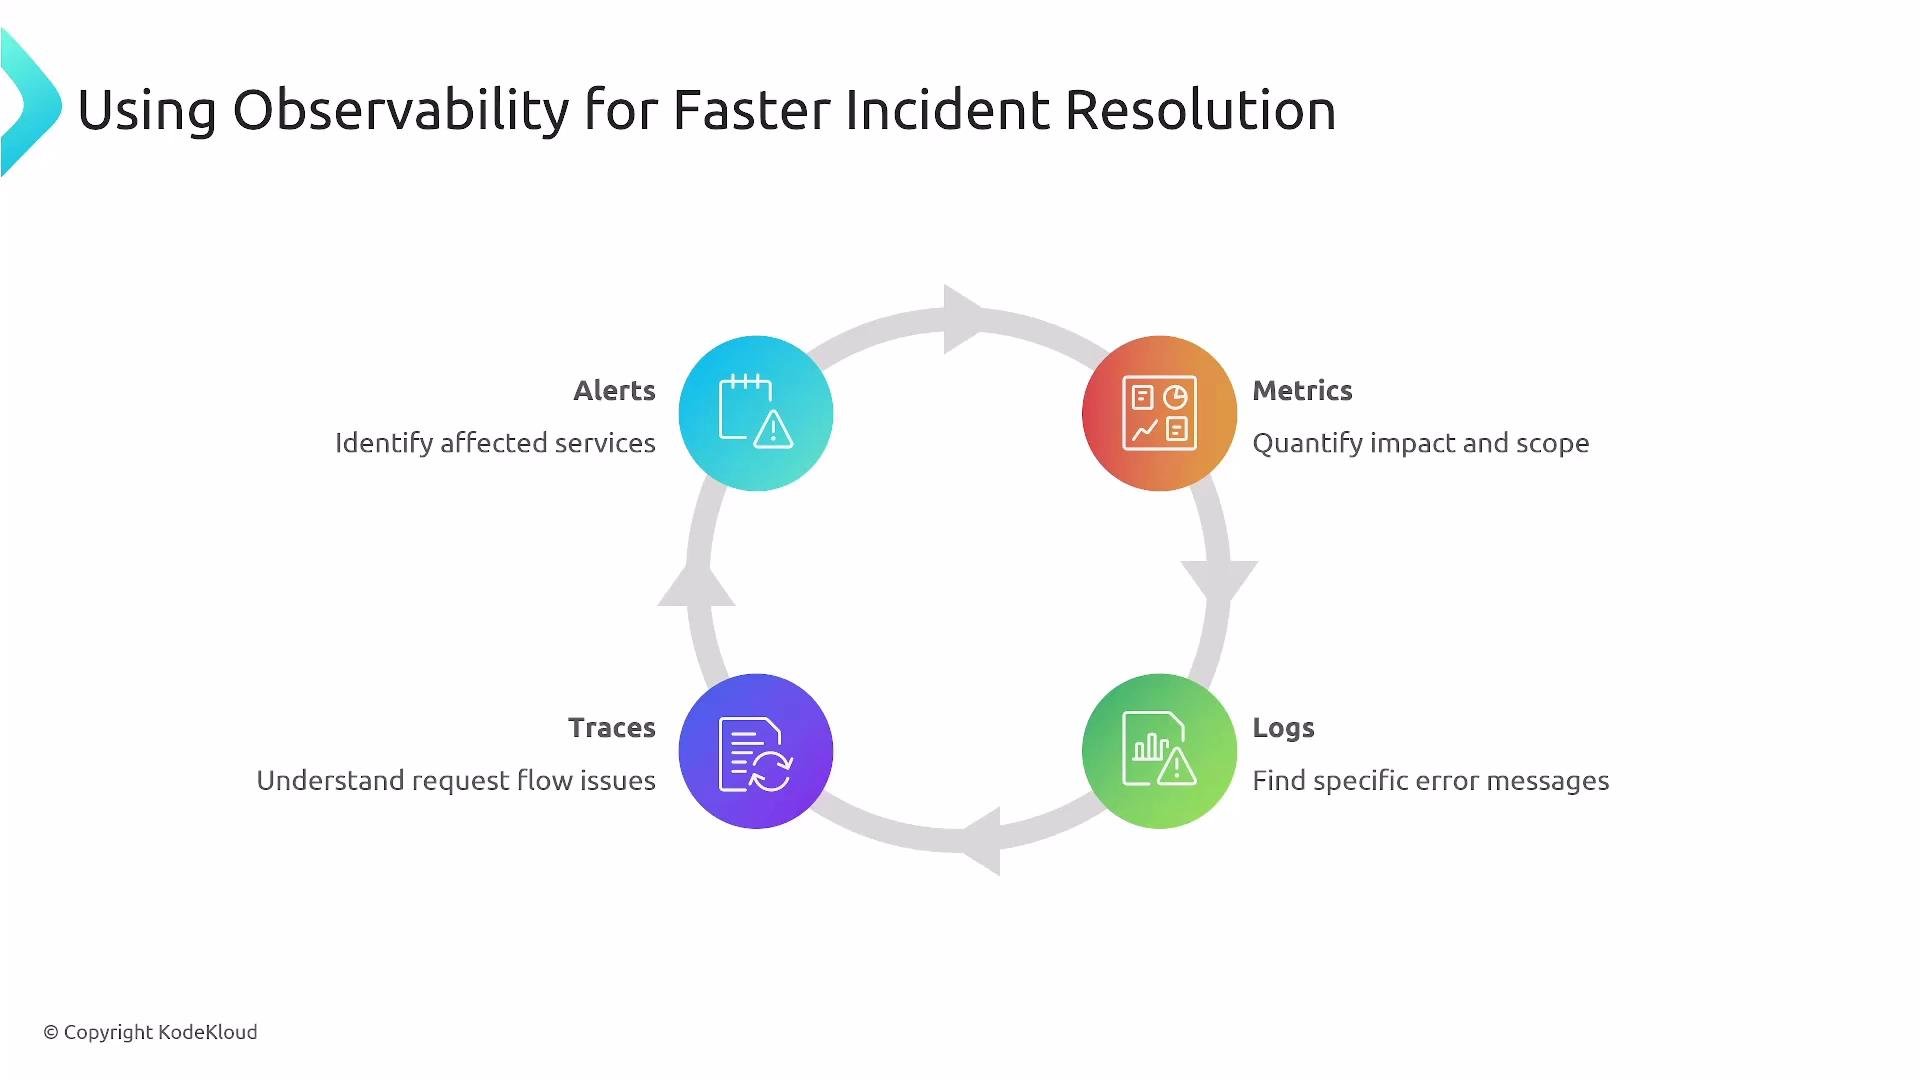
Four key signals accelerate diagnosis and recovery:- Alerts — identify the affected service and trigger response.
- Metrics — quantify impact and scope.
- Logs — search for error messages and stack traces.
- Traces — understand request flow and bottlenecks.
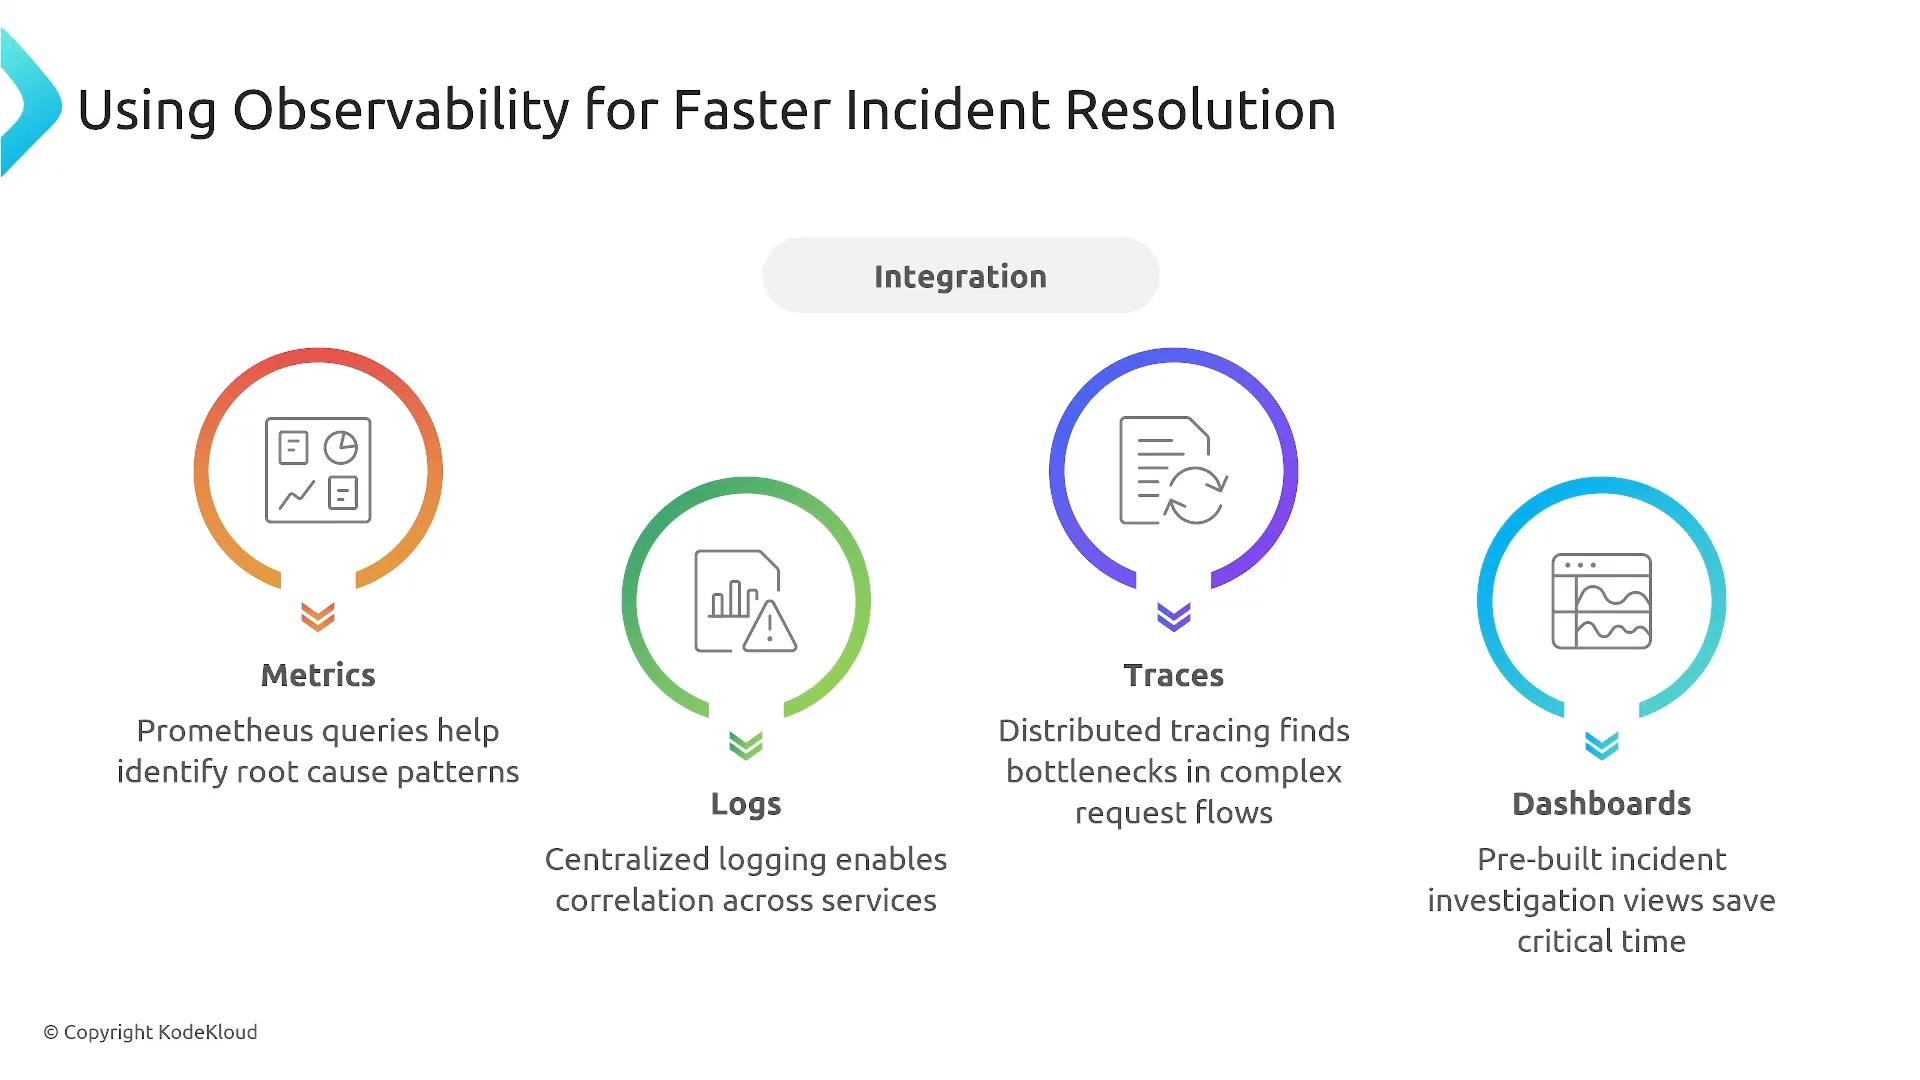
- Metrics: Prometheus
- Logs: EFK or Loki
- Traces: Jaeger
- Dashboards: Grafana (practical default for many orgs)
Communication patterns
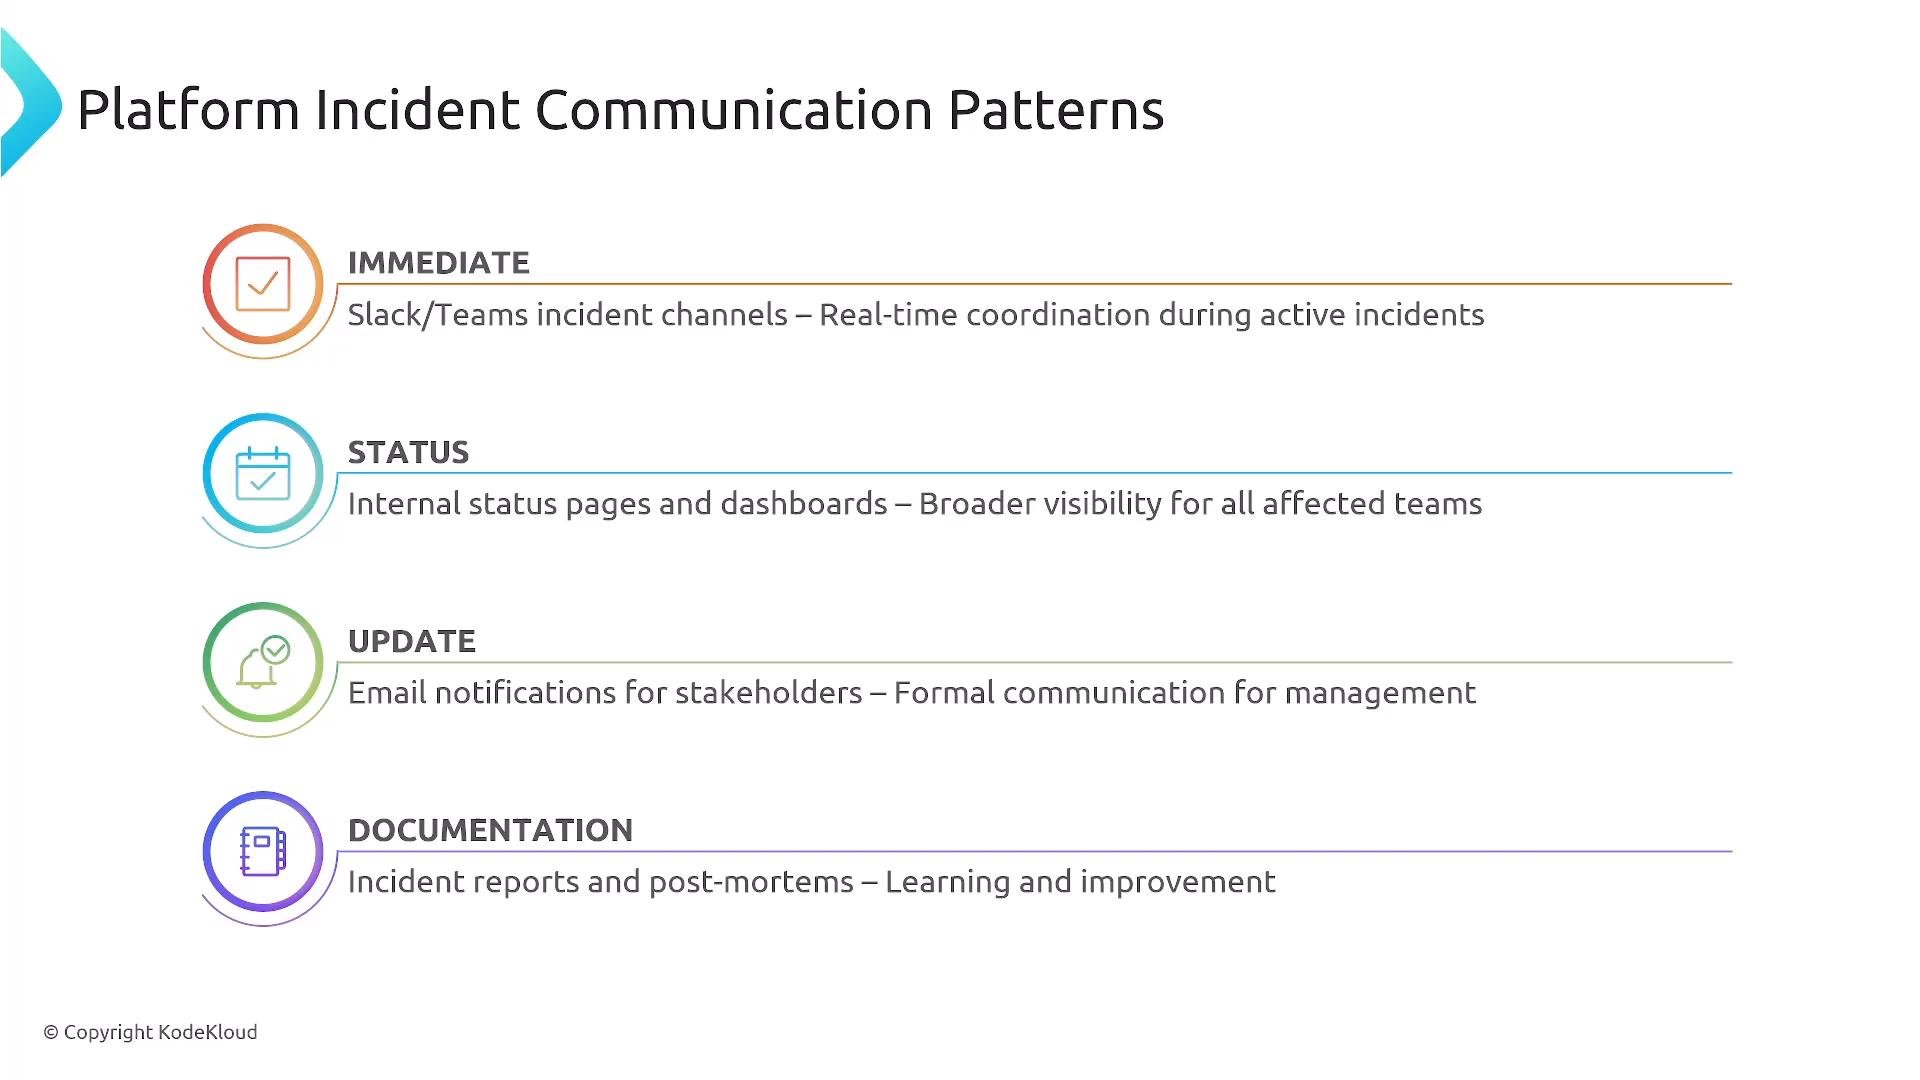
Clear communication reduces confusion and speeds coordination:- Real-time coordination: Slack/Teams channels for responders and collaborative triage.
- Status pages: for broader stakeholders to check incident state.
- Formal communications: emails or announcements for impacted business units.
Escalation and response roles
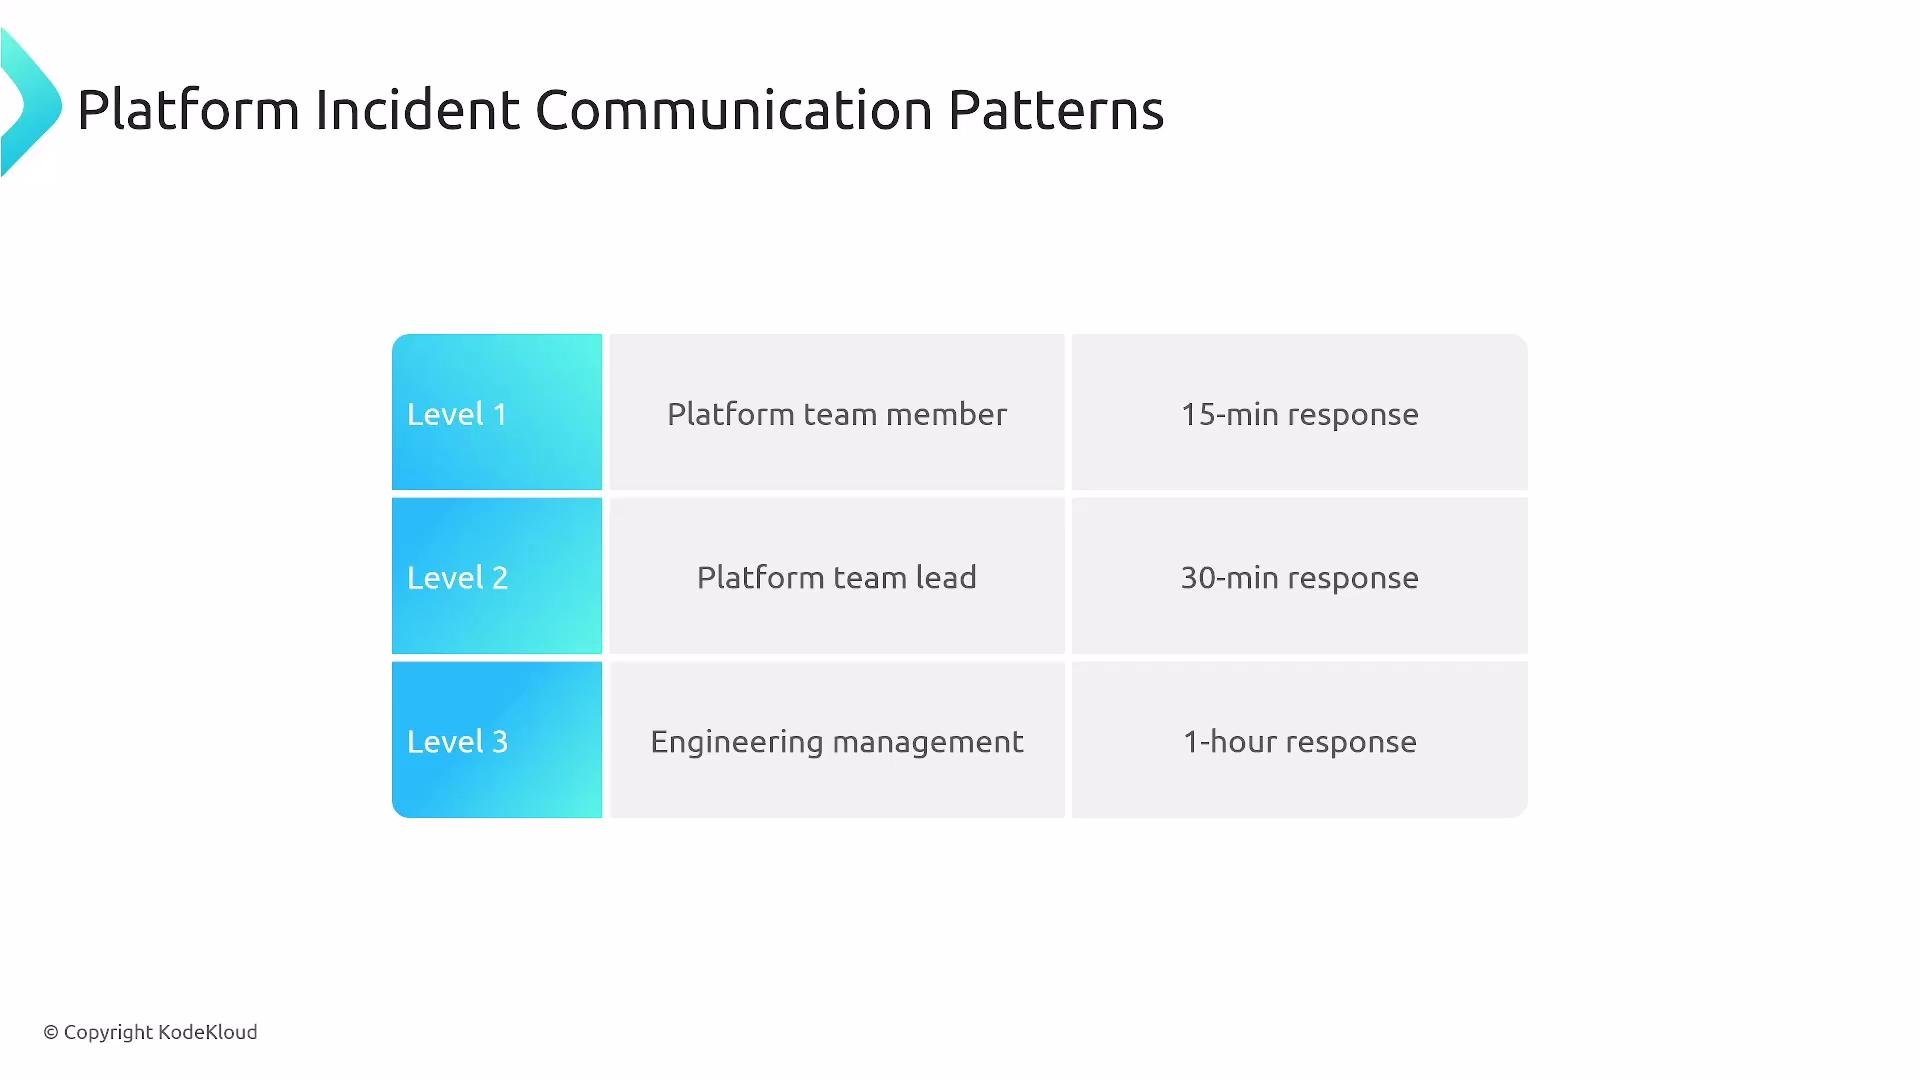
Define clear on-call responsibilities and escalation paths. A typical pattern:- First responder → Team lead → Engineering management (escalate based on impact & time-to-resolution).
Severity is a business decision
Business stakeholders define what counts as SEV-1, SEV-2, etc., and set recovery targets. Platform teams should design architecture and automation to meet those targets.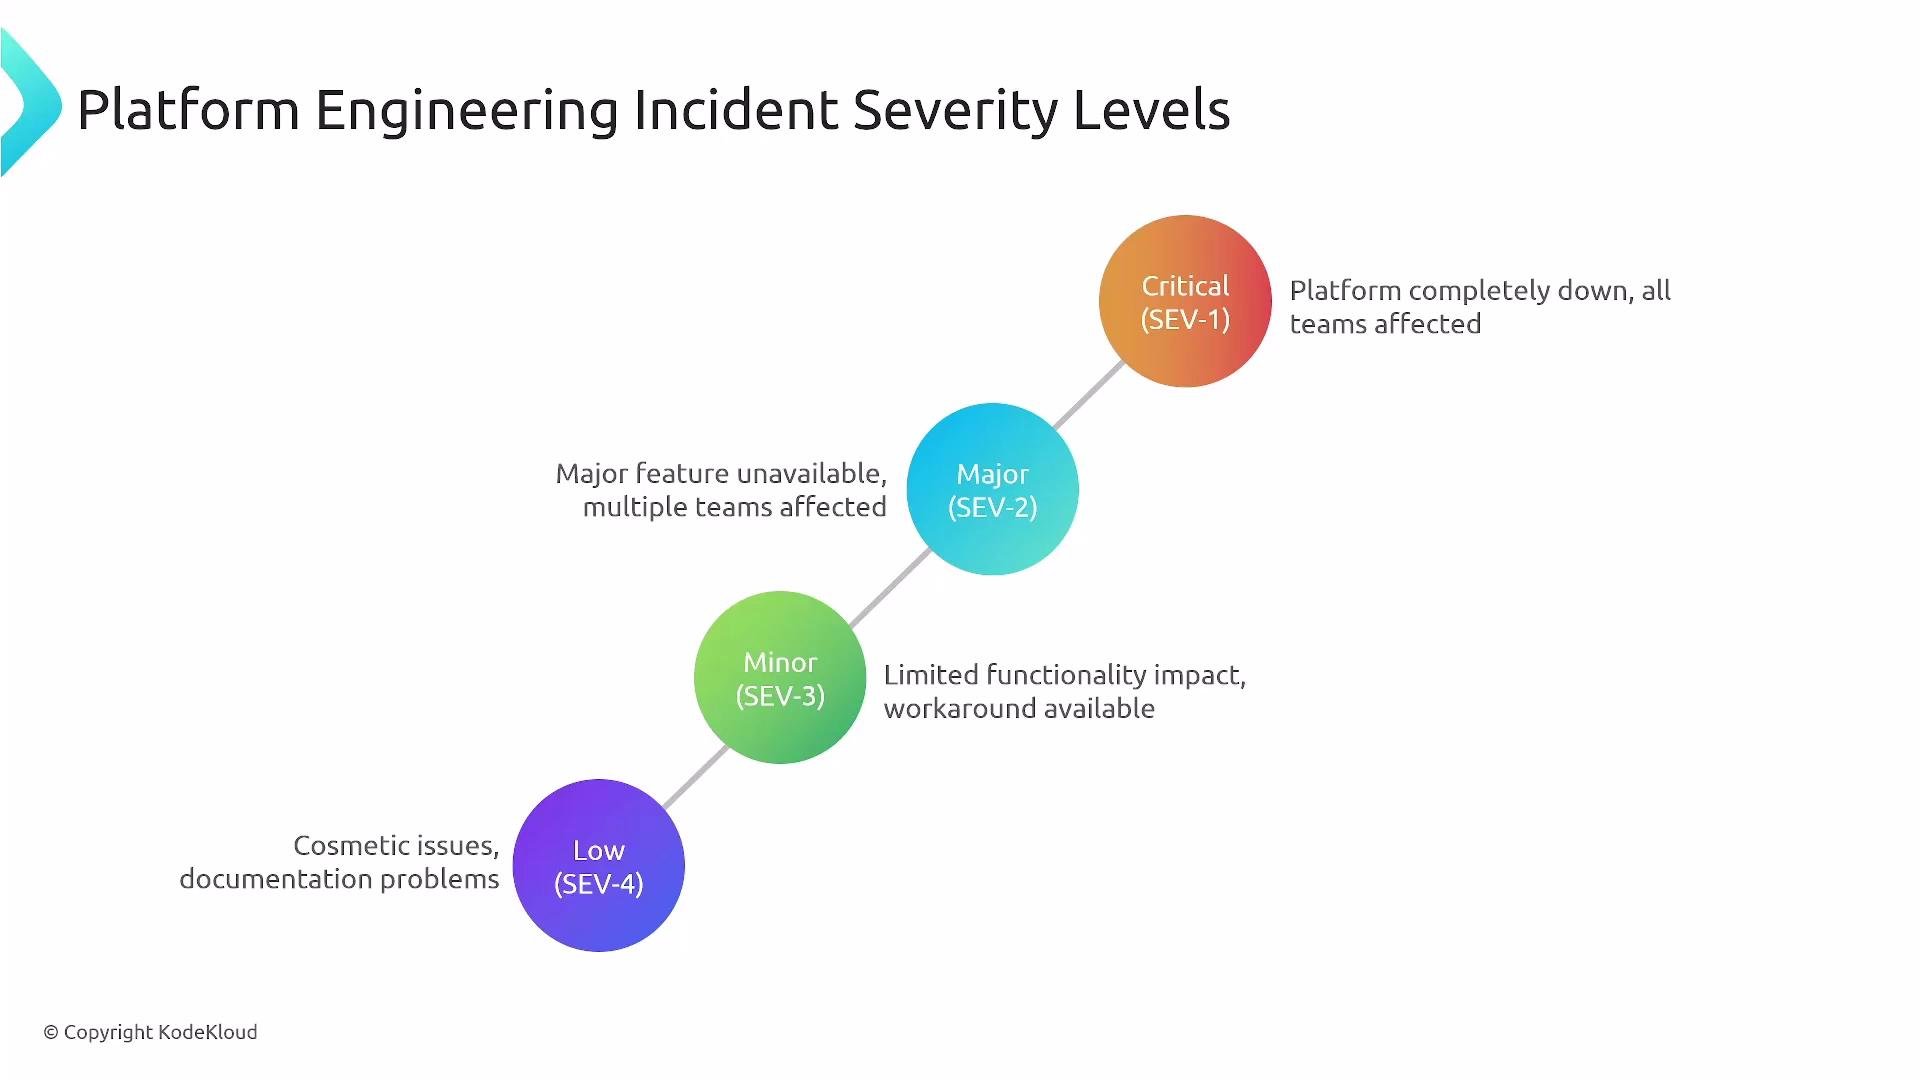
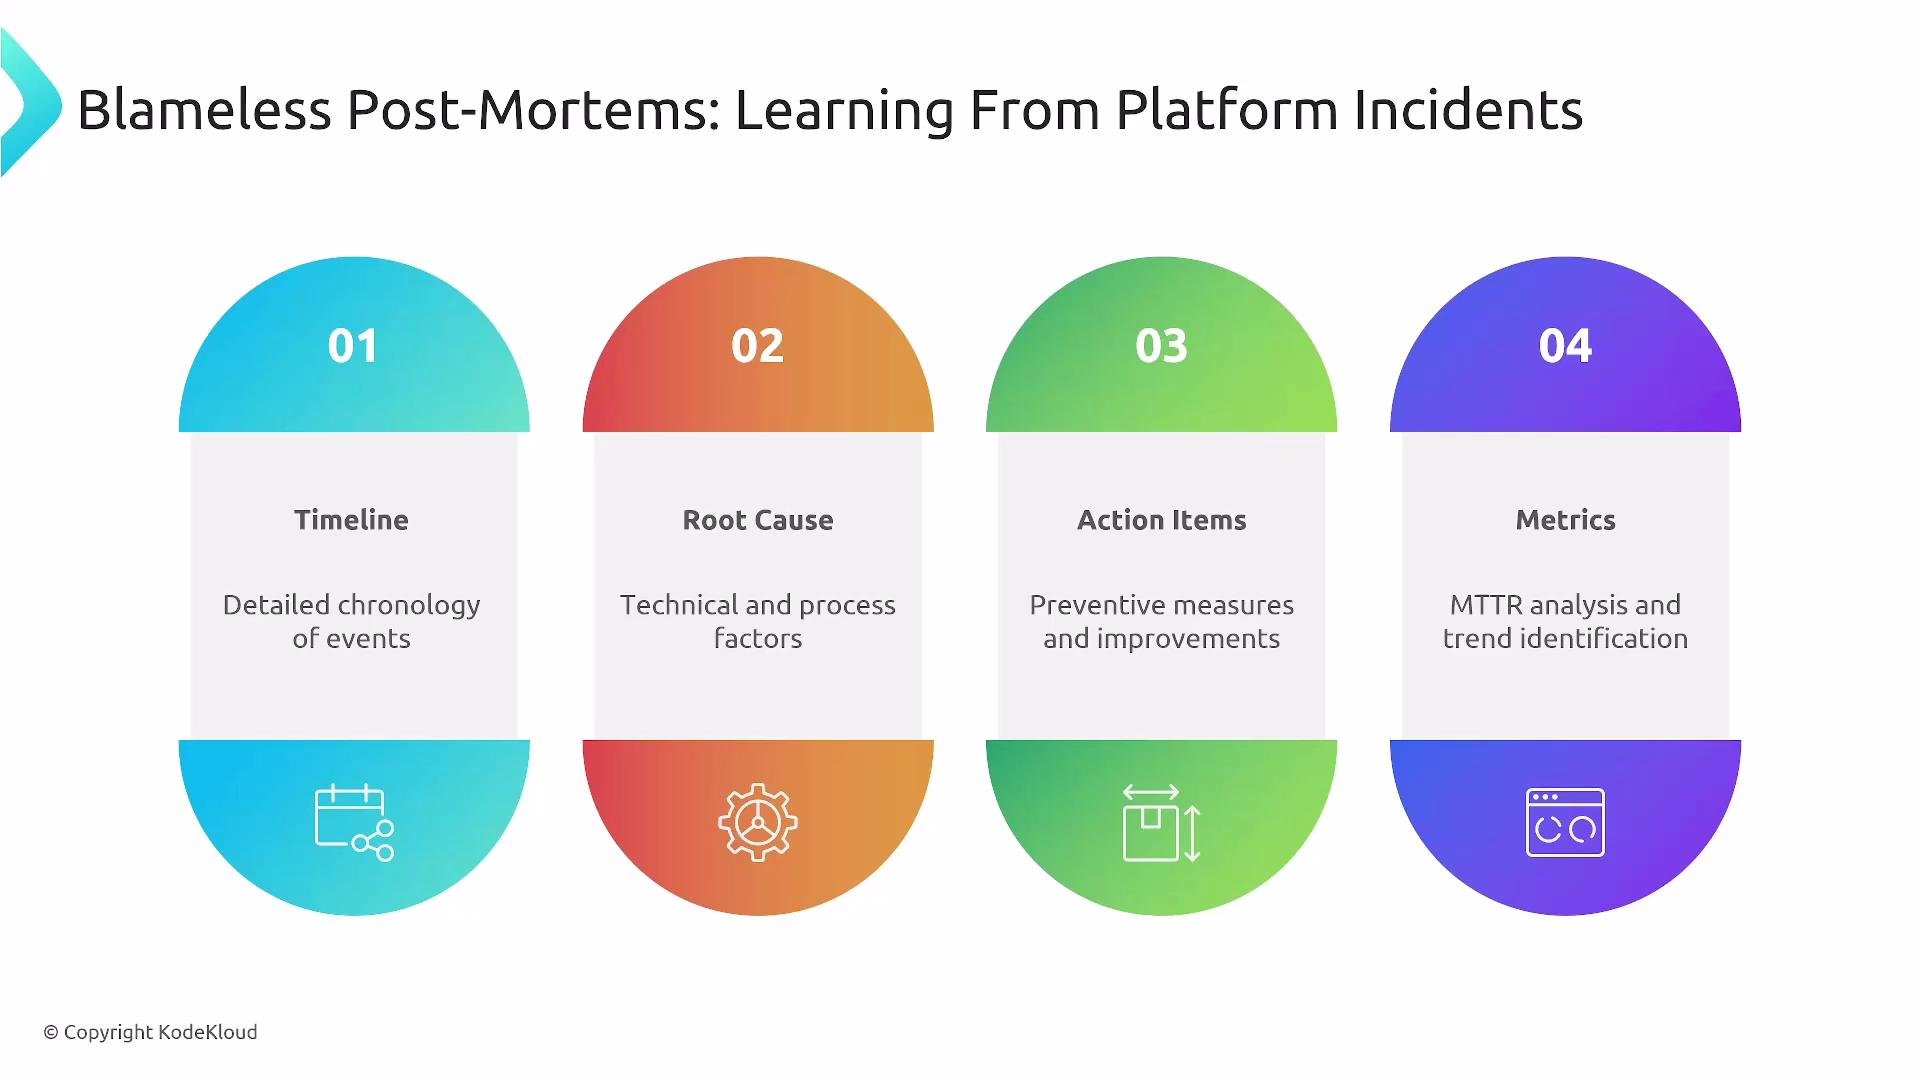
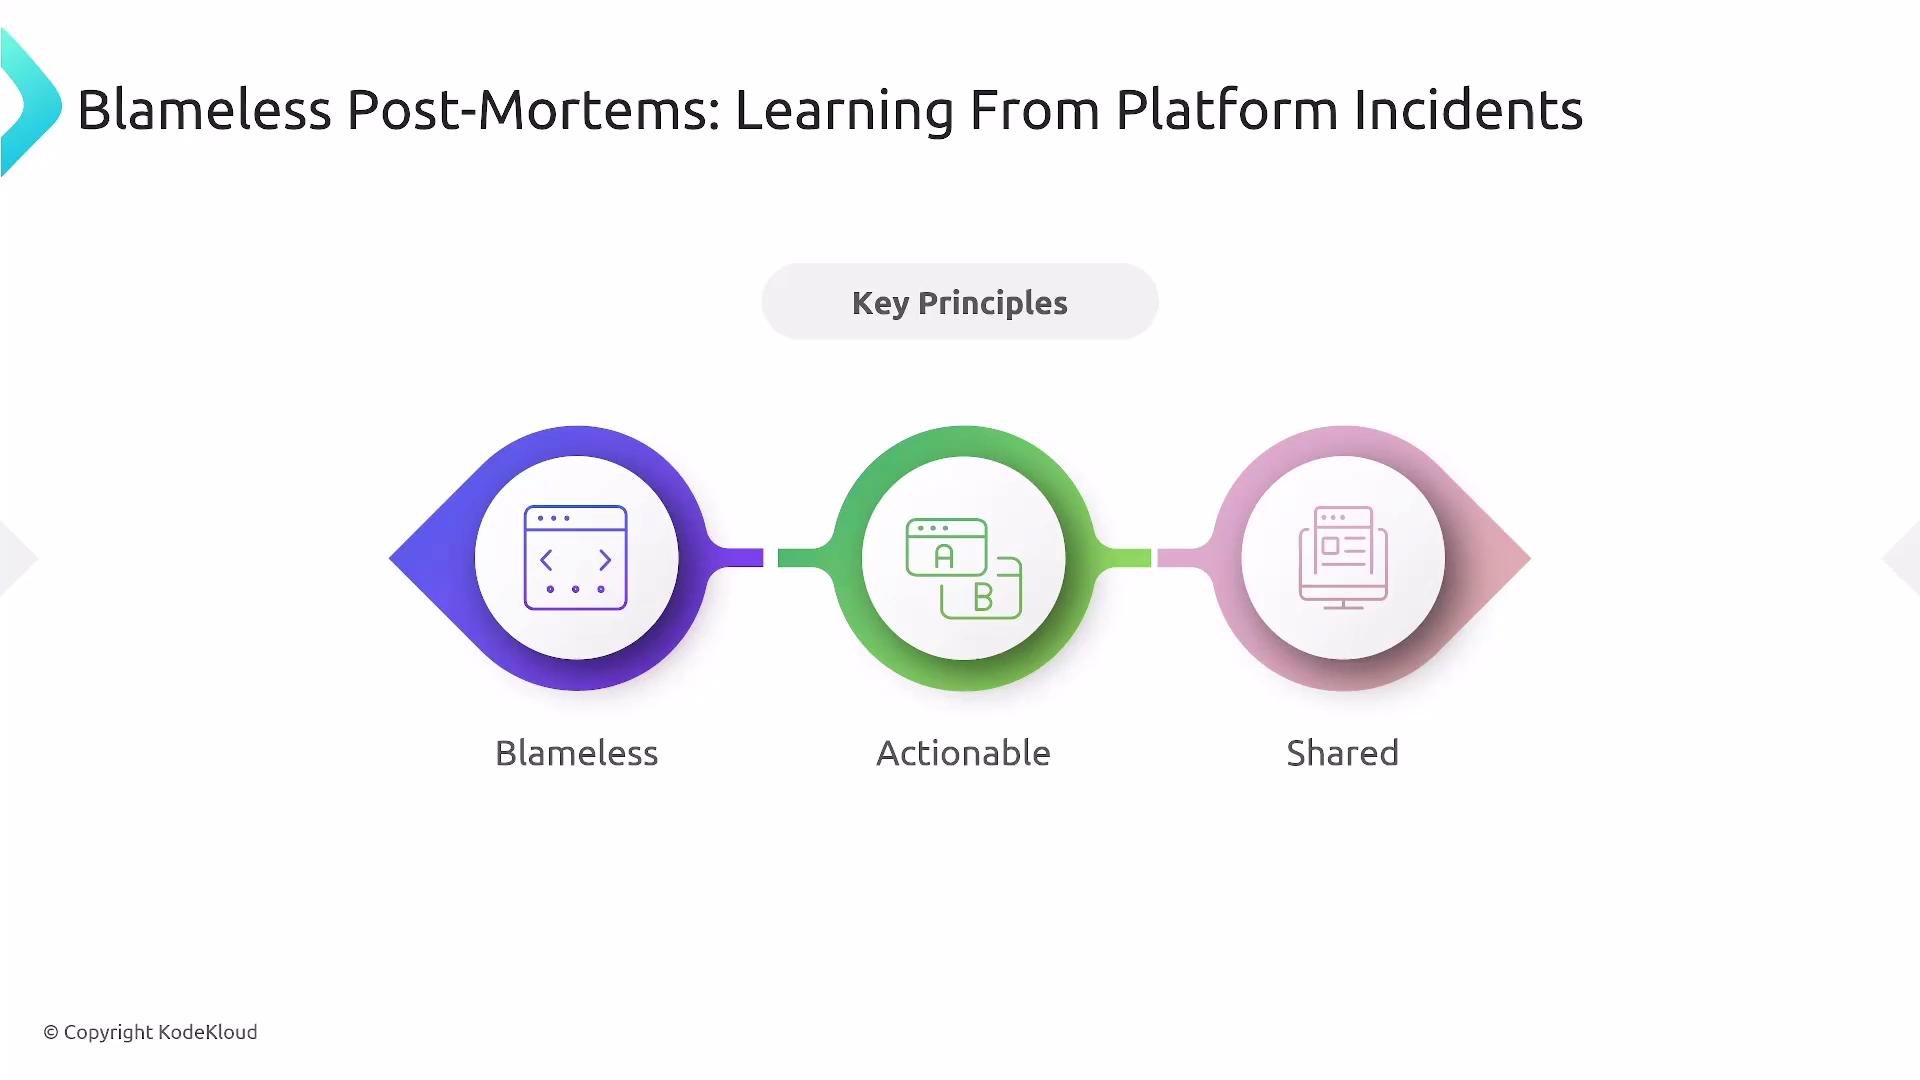
Publish blameless postmortems
Blameless postmortems capture learning and drive improvement. Include:- Timeline of events
- Root cause analysis (systems-focused)
- Actionable mitigations and owners
- Impact on SLAs/SLOs
Measure incident response effectiveness
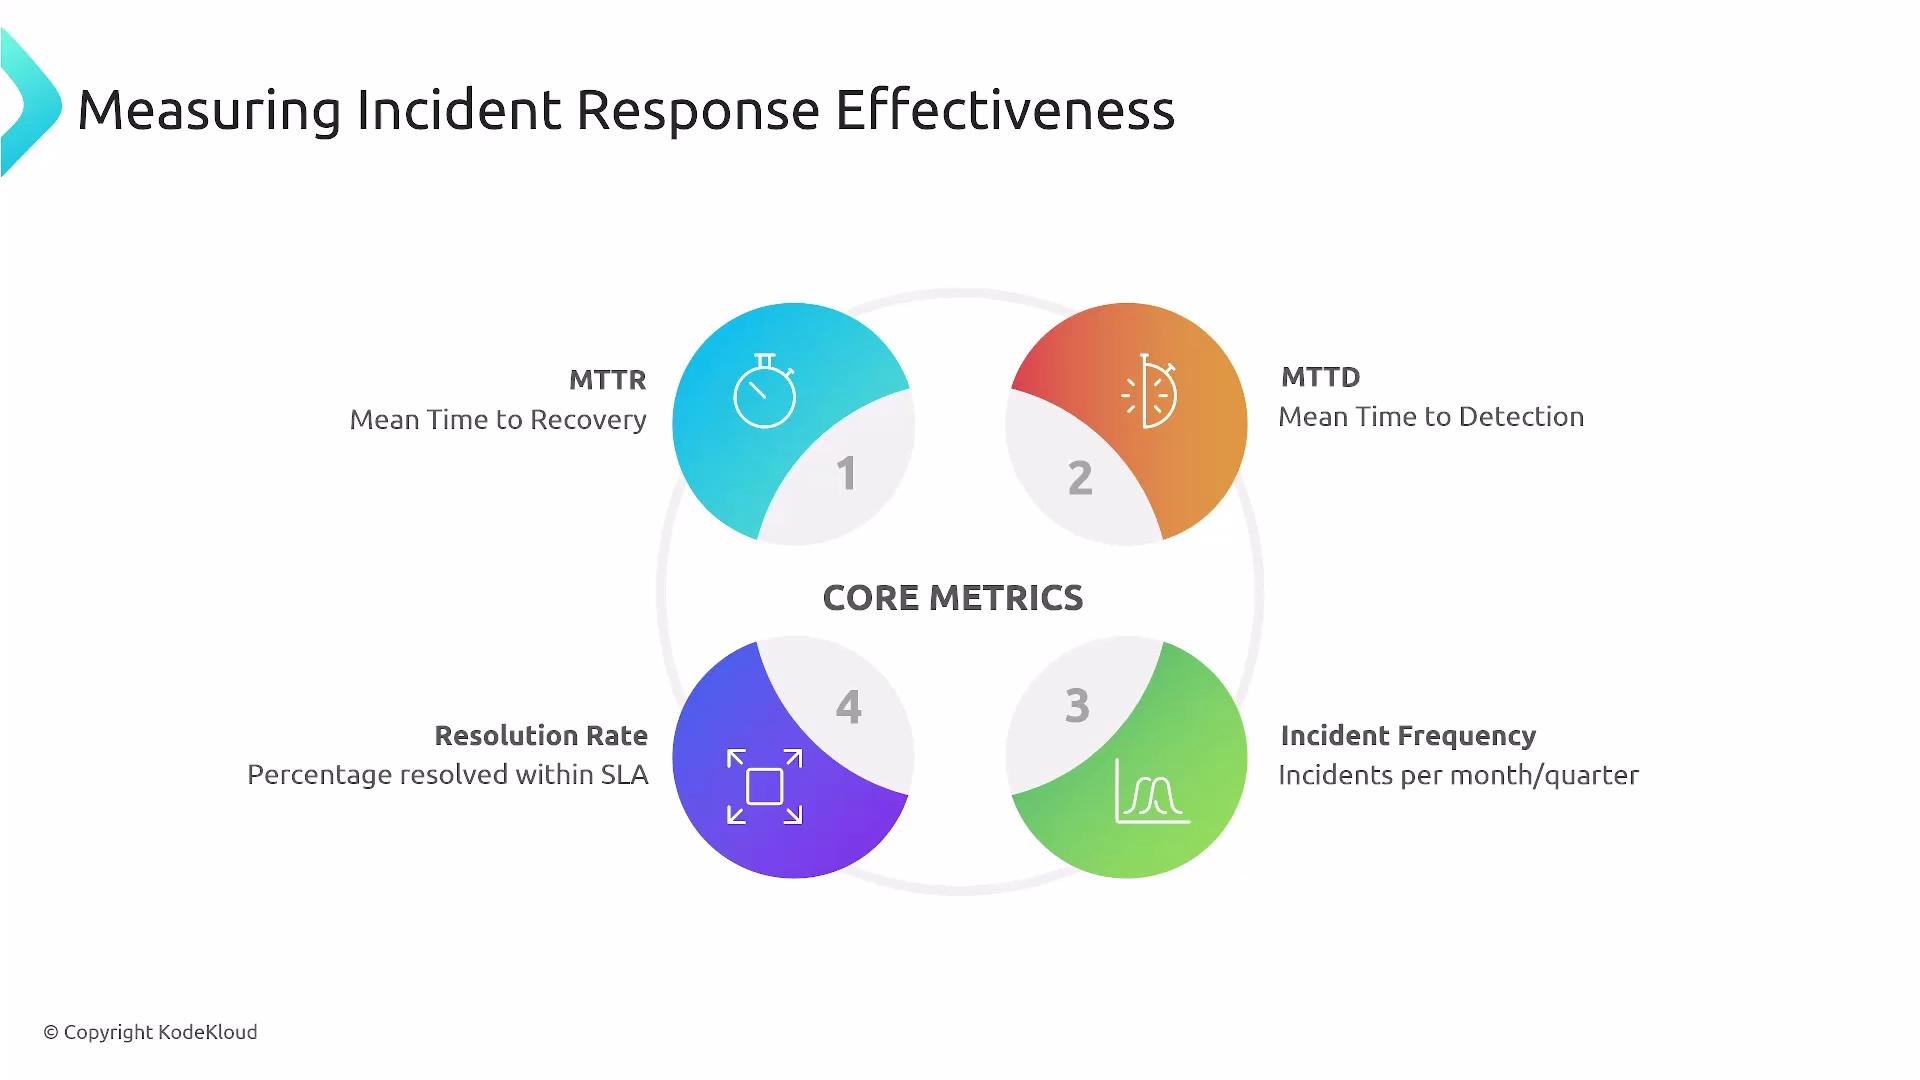
Track core metrics and trends to iterate on processes:
Track percentage of incidents resolved within targets and analyze trends to prioritize tooling and automations.
Example: organizational metrics and trending
Measure MTTR and MTTD over time. Even small degradations indicate areas to improve detection, automation, or testing.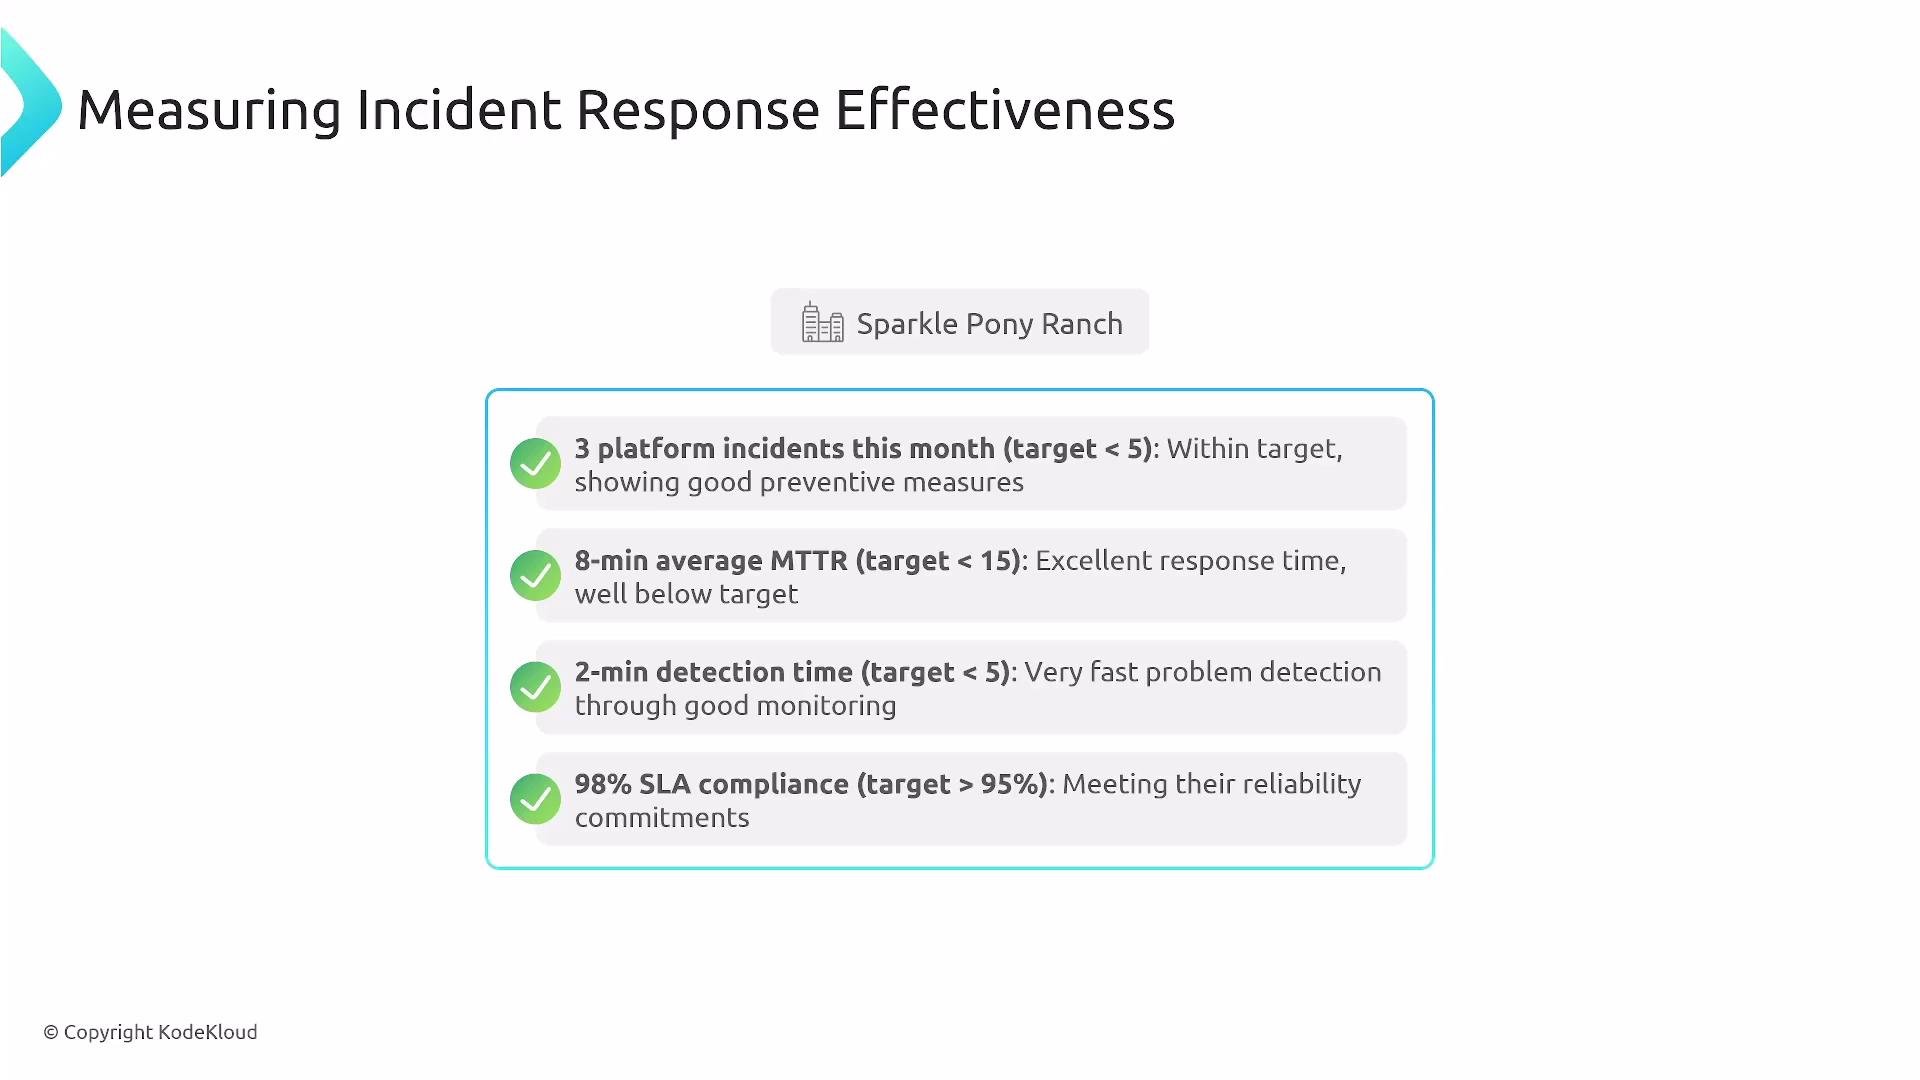
Self-healing and automation patterns
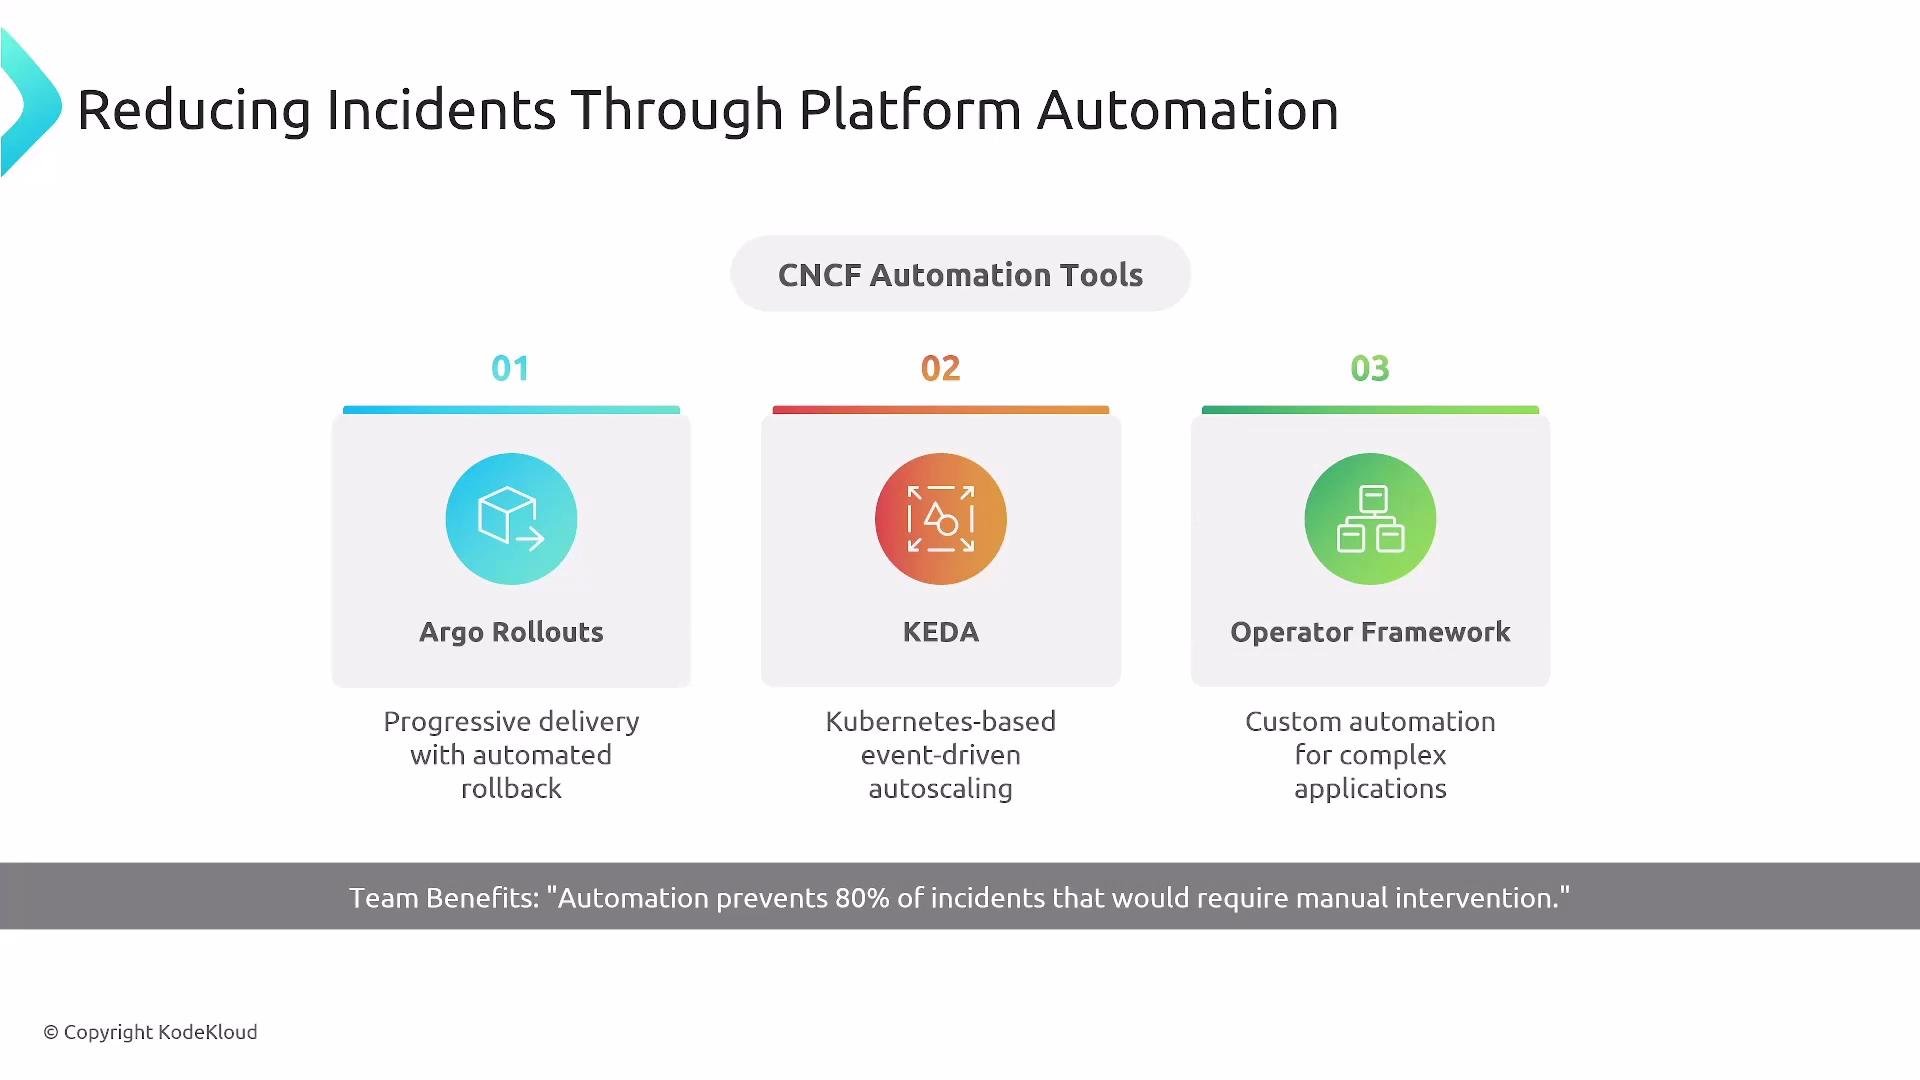
Design platforms to recover automatically where safe: autoscaling, circuit-breakers, automated rollbacks, and progressive delivery. CNCF tools that help:- Argo Rollouts — progressive delivery and automated rollback
- KEDA — event-driven autoscaling
- Operator frameworks — encode operational knowledge
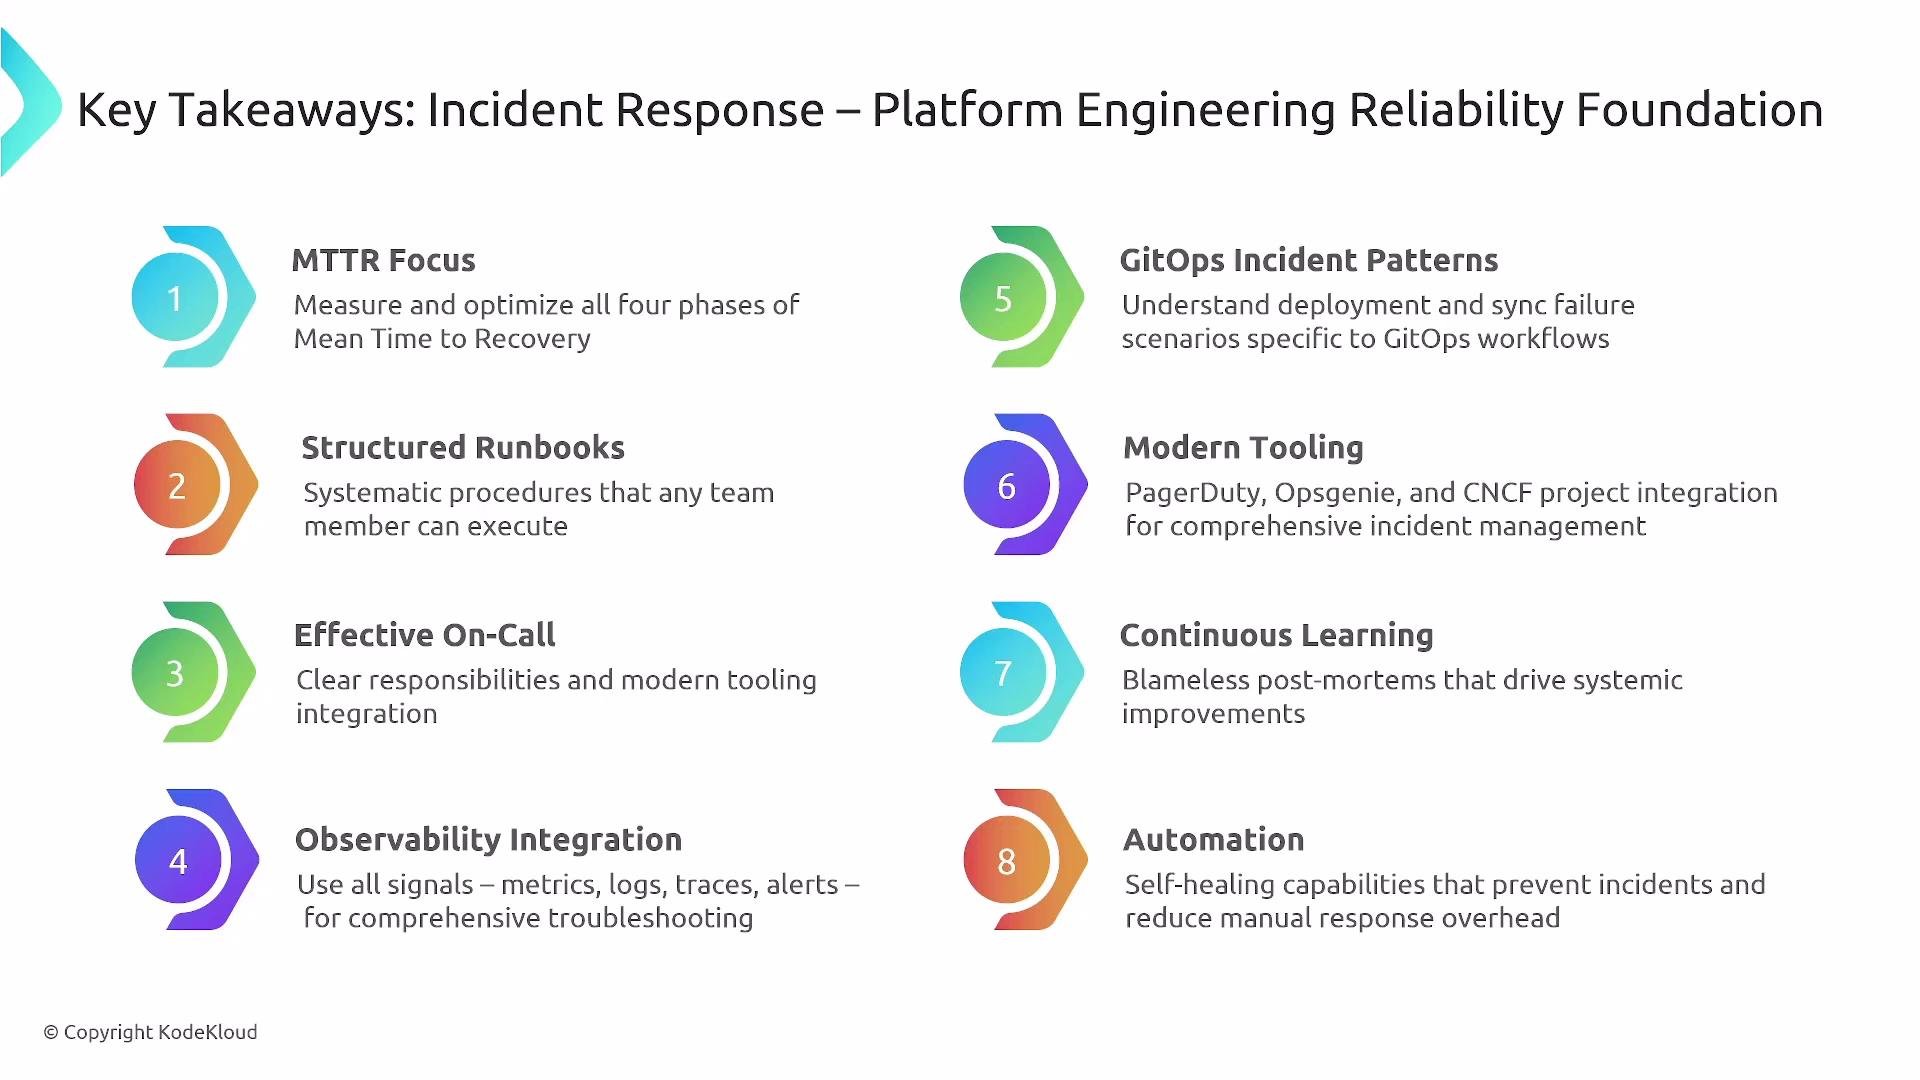
Key takeaways
- Measure the full MTTR lifecycle: detection, response, resolution, recovery.
- Use structured runbooks and ensure they are validated and tested.
- Define clear on-call responsibilities and escalation paths.
- Bake observability into platform services (metrics, logs, traces, dashboards).
- Understand common failure modes (Kubernetes, GitOps, CI/CD) and have response patterns ready.
- Prefer modern tooling and automated responses where safe; manual intervention does not scale.
- Conduct blameless postmortems, share learnings, and iterate on prevention and automation.