Welcome — this lesson covers practical, exam-relevant concepts for Domain 4: intelligent resource management, capacity planning, and scaling. These are core skills for platform engineers and frequent topics on the CNPA certification: resource requests and limits, QoS classes, autoscaling layers, node provisioning, and emerging dynamic resource allocation techniques. Why this matters
  • Heterogeneous compute: VMs, serverless, and containers require different allocation strategies.
  • Millisecond-scale workloads: event-driven microservices need fast, predictable scaling.
  • Cost control: scale precisely to avoid wasted spend.
  • Sustainability & efficiency: reduce unnecessary resource consumption and carbon footprint.
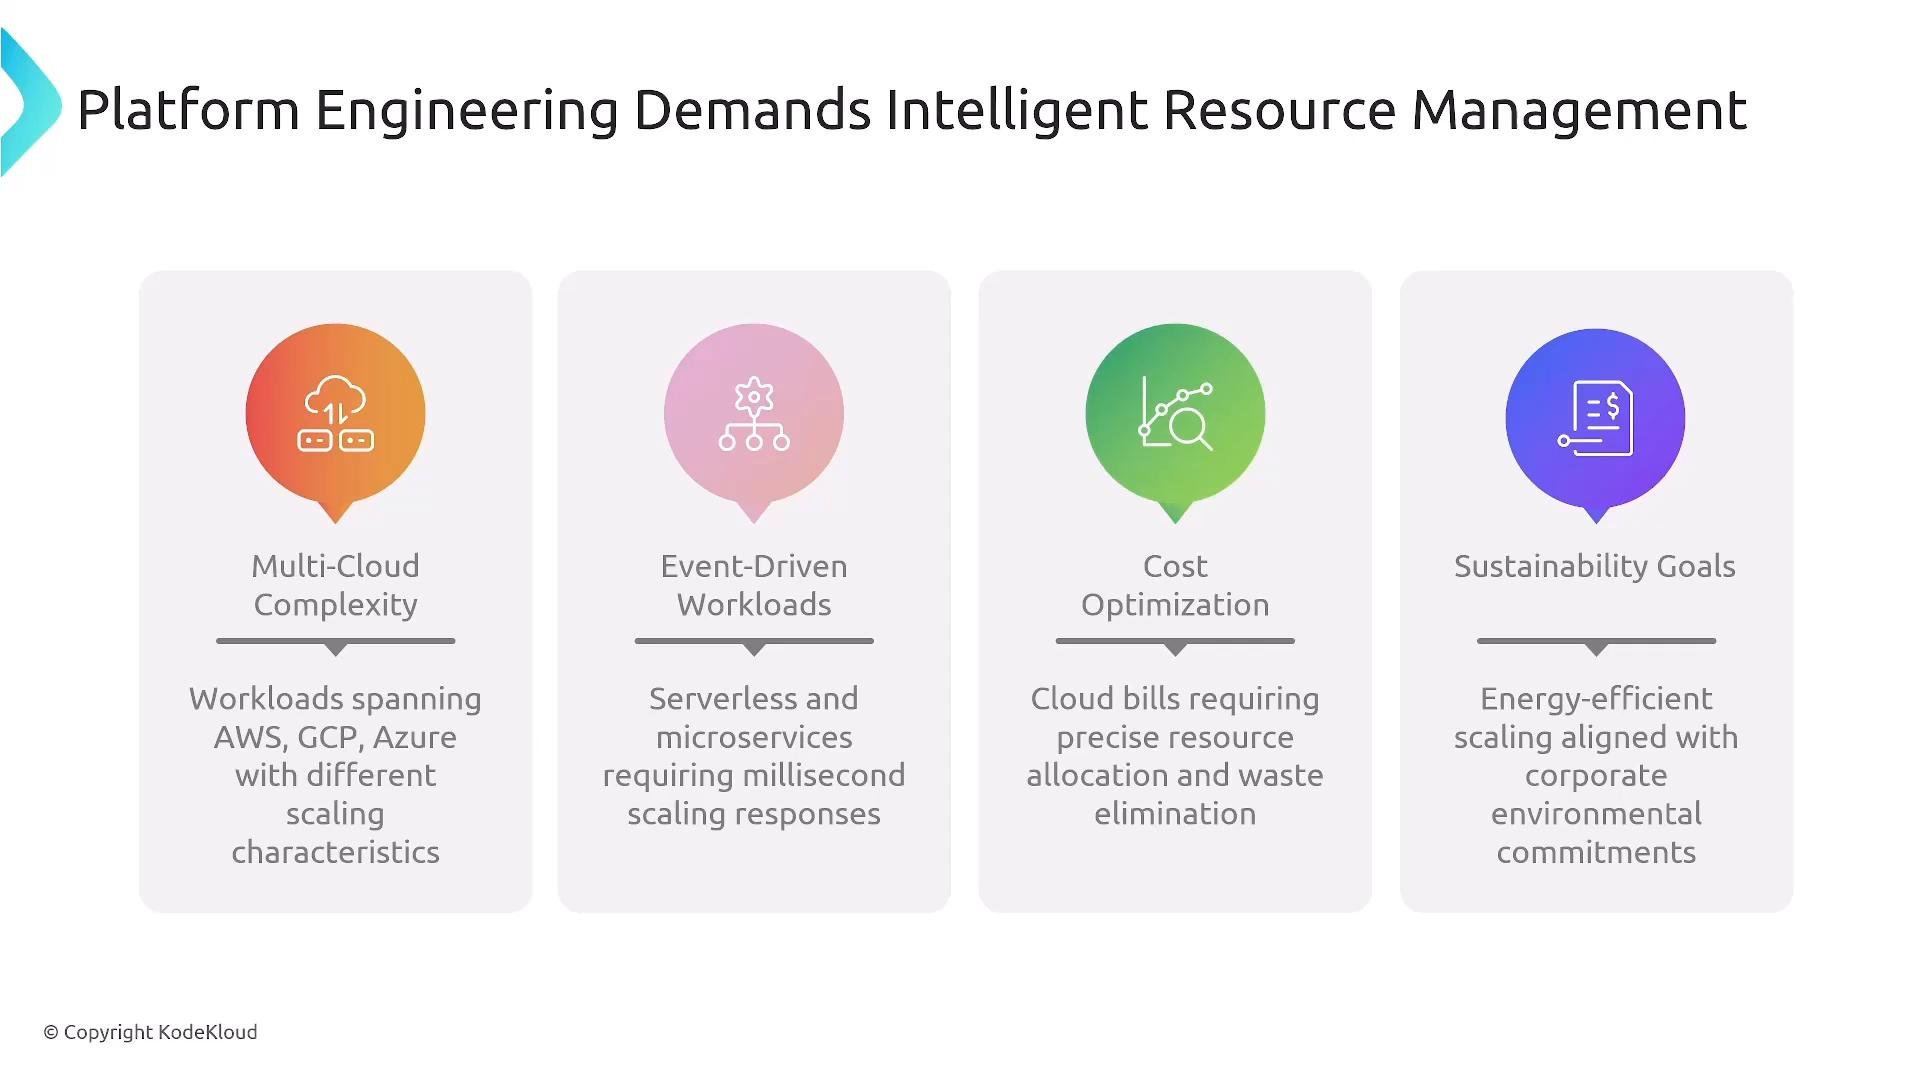
An infographic titled "Platform Engineering Demands Intelligent Resource Management" that highlights four challenges—Multi-Cloud Complexity, Event-Driven Workloads, Cost Optimization, and Sustainability Goals—each shown with a colored icon and short explanatory text.
Real-world example: Sparkle Pony Ranch
  • Normal traffic: ~100 spawns/sec.
  • Event peak: ~2,000 spawns/sec (20× spike). Over-provisioning for peak wastes cost; under-provisioning harms UX. Platform engineers must balance peak capacity, cost, and SLA.
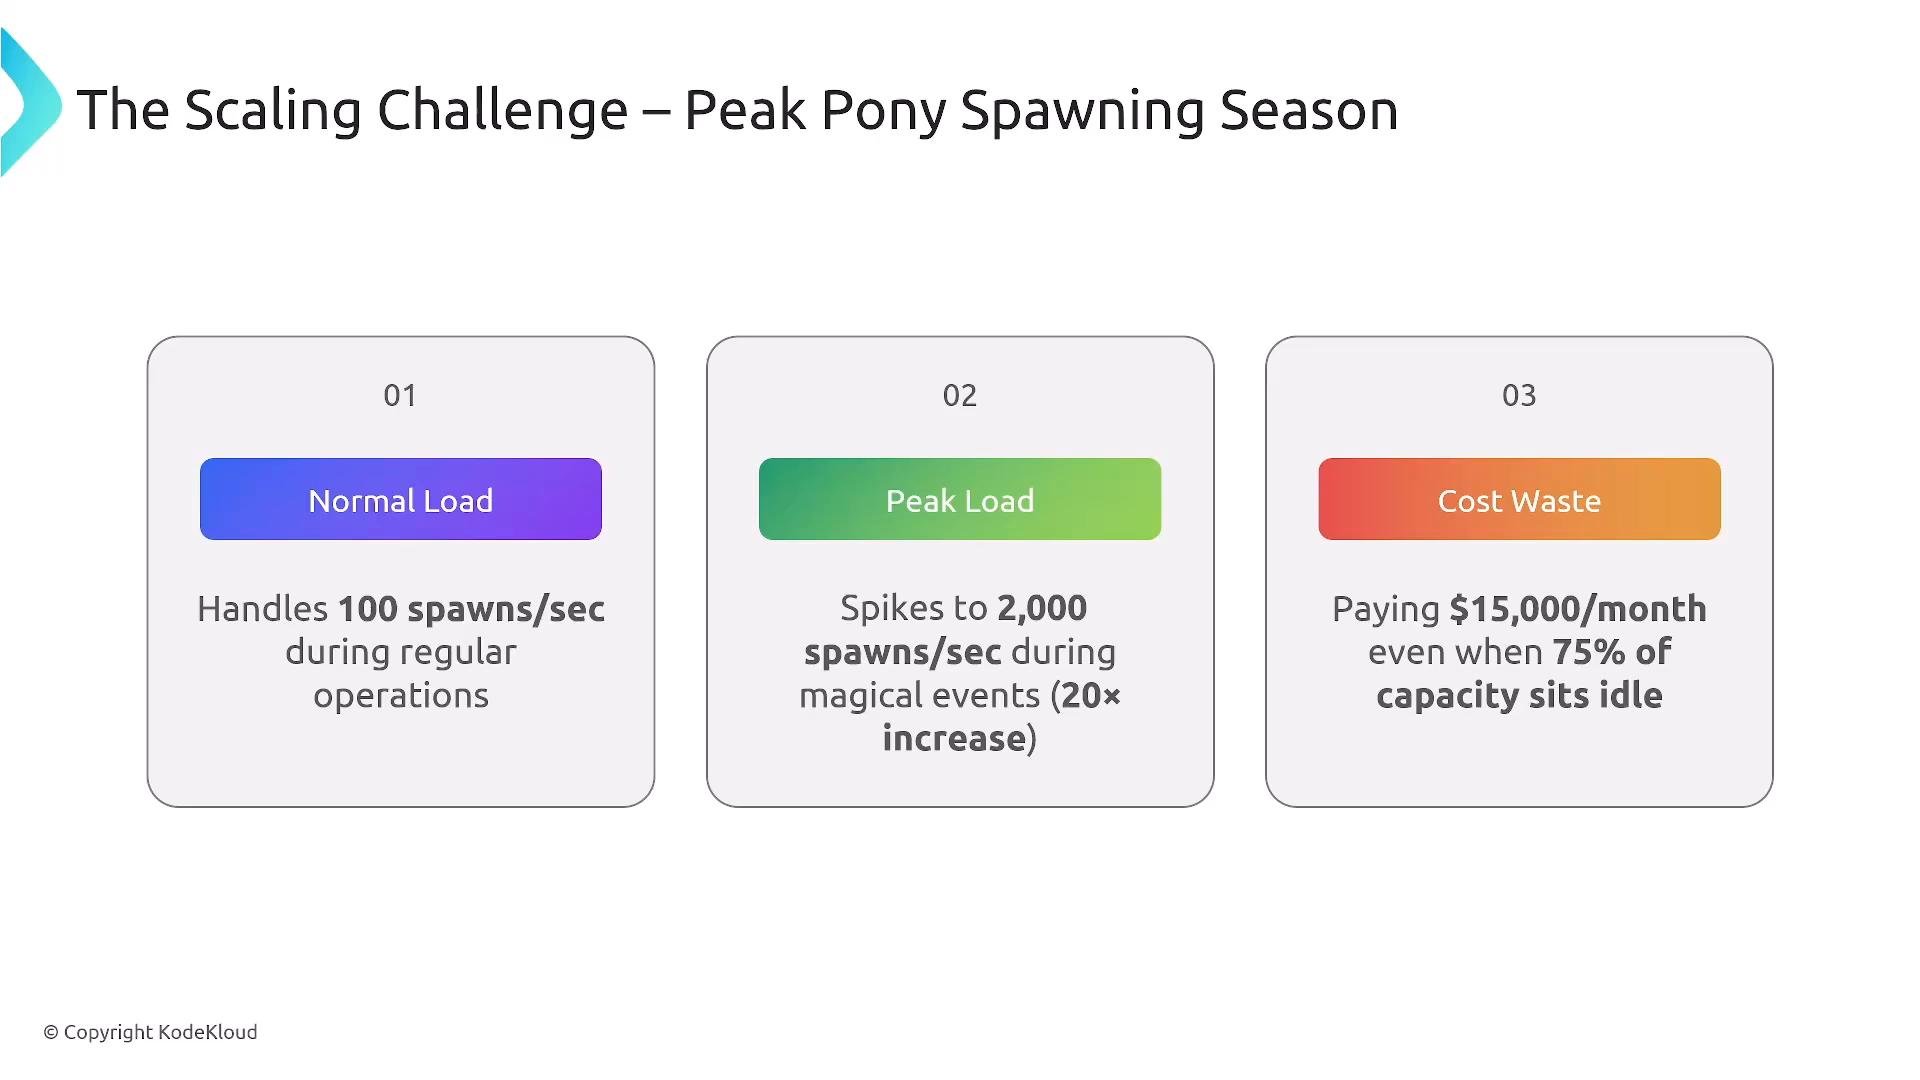
A presentation slide titled "The Scaling Challenge – Peak Pony Spawning Season" with three panels showing Normal Load (handles 100 spawns/sec), Peak Load (spikes to 2,000 spawns/sec), and Cost Waste (paying $15,000/month while 75% of capacity sits idle).
Platform goals (examples: Swati, Alan, Fong)
  • Support peak load without degrading UX.
  • Maintain cost/SLA balance.
  • Design predictable scaling behavior for applications.
Kubernetes primitives: Requests, Limits, and QoS
  • Requests: scheduler uses these to place pods — a guaranteed floor.
  • Limits: kubelet enforces these at runtime — a ceiling.
  • QoS classes: Guaranteed, Burstable, BestEffort — influence eviction order under node pressure.
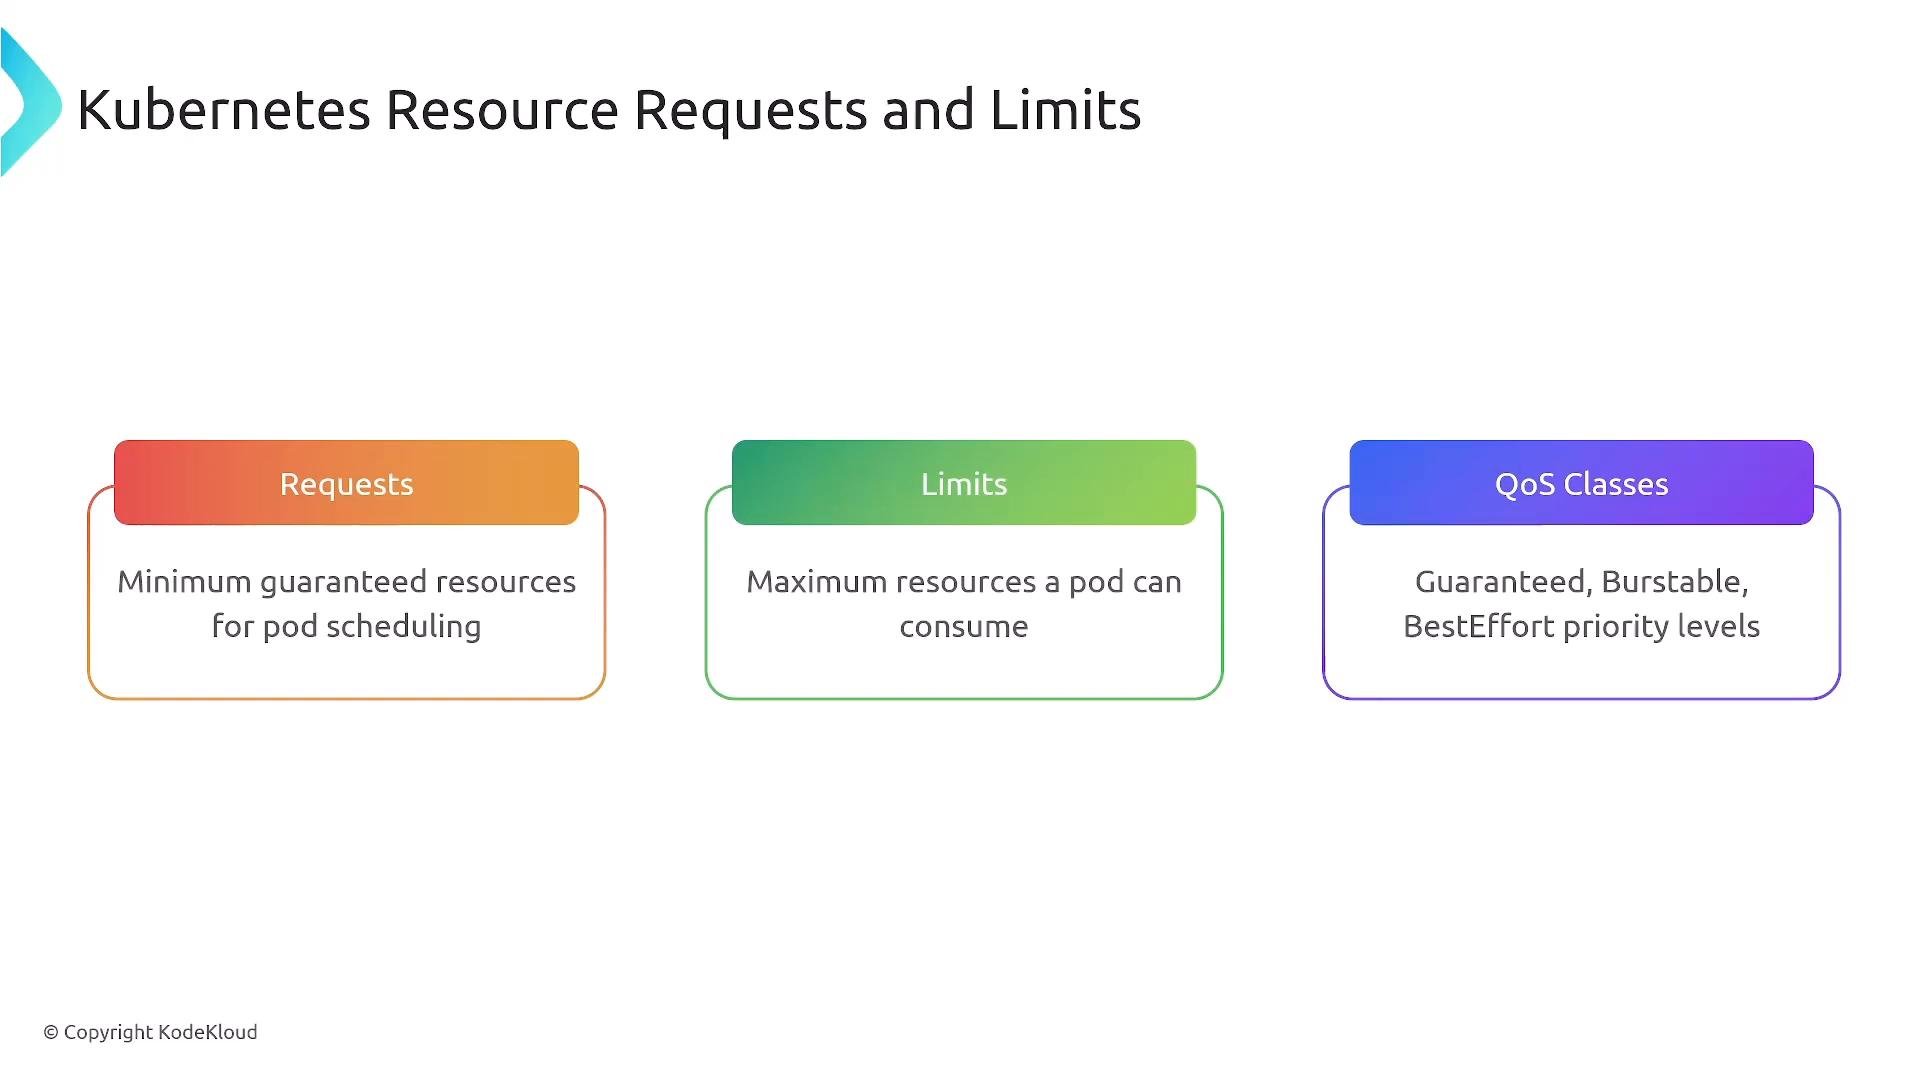
A presentation slide titled "Kubernetes Resource Requests and Limits" showing three colored panels. The panels summarize Requests (minimum guaranteed resources for pod scheduling), Limits (maximum resources a pod can consume), and QoS Classes (Guaranteed, Burstable, BestEffort).
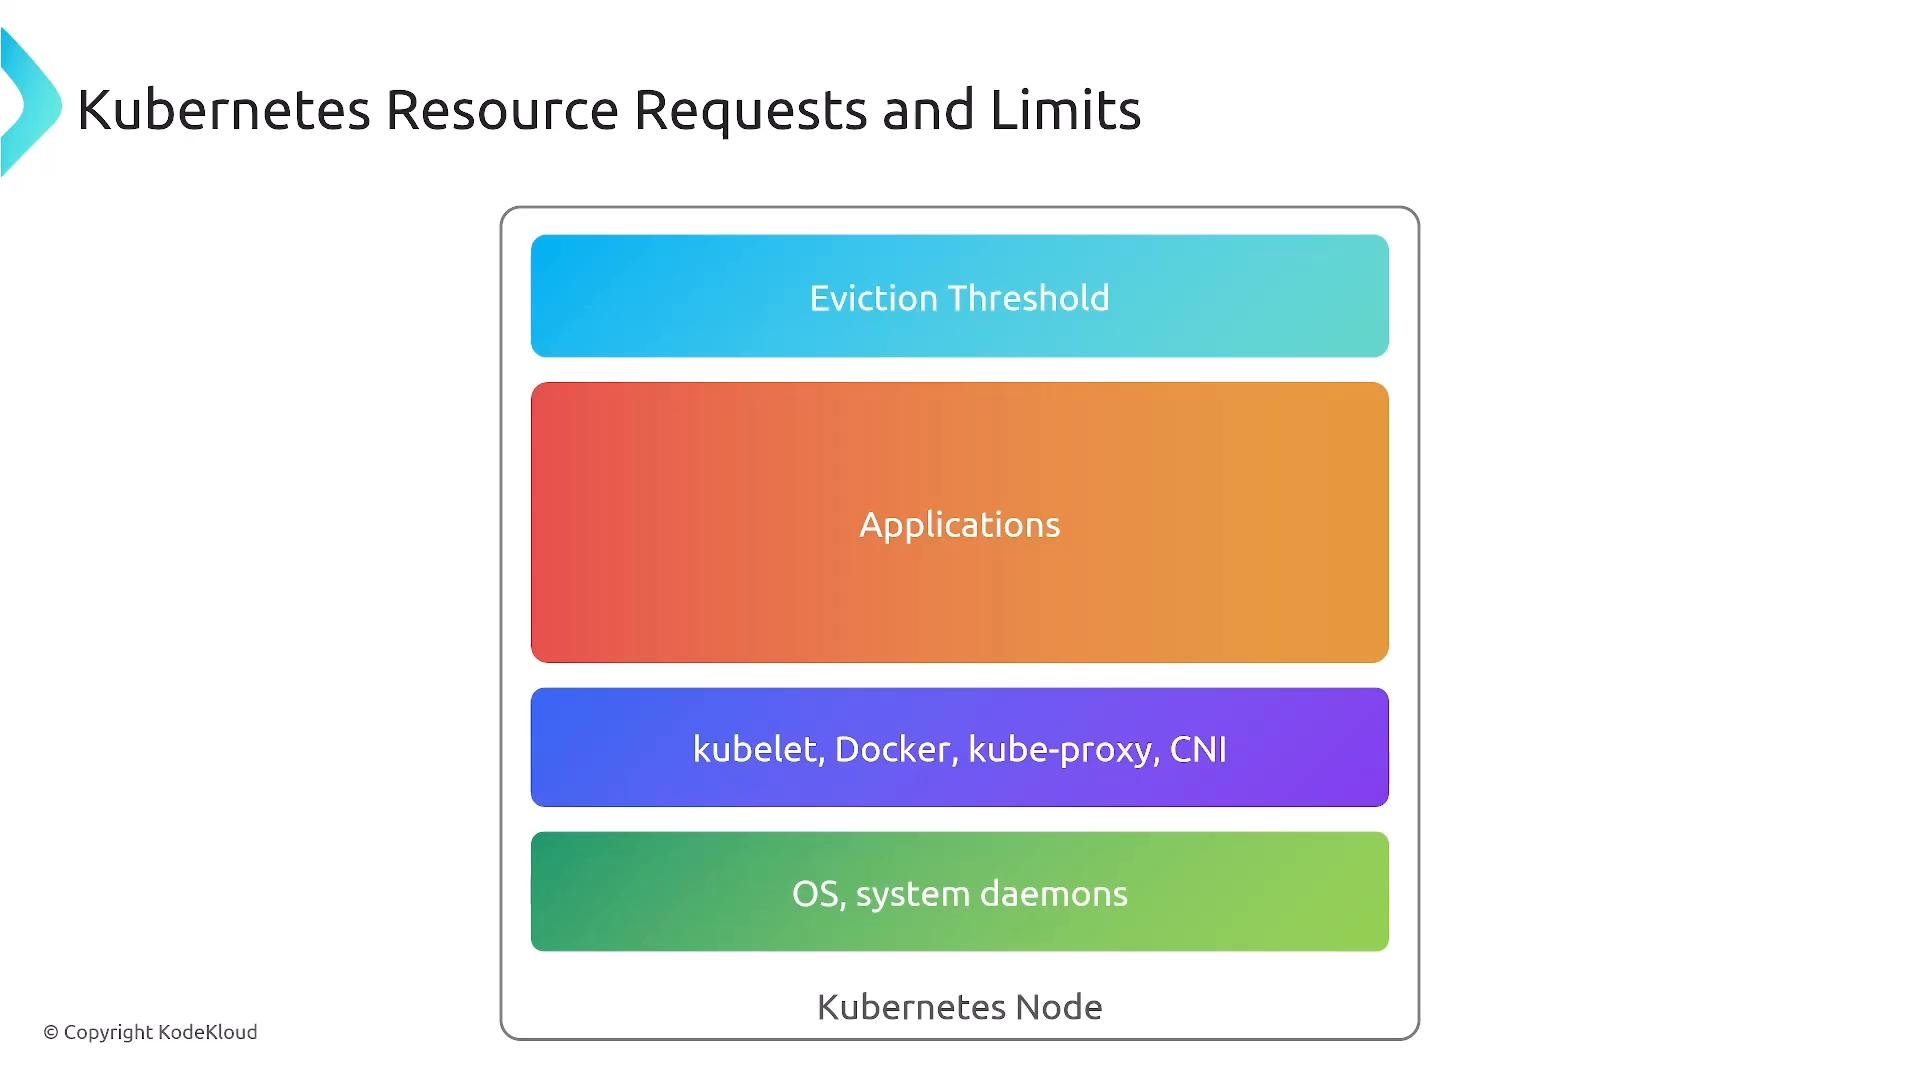
Node-level resource behavior and eviction When a node is constrained, kubelet applies eviction thresholds and uses QoS to choose which pods to evict first. Node resources include:
  • OS/system daemons
  • kubelet / container runtime / network plugins
  • Application workloads
A labeled layered diagram titled "Kubernetes Resource Requests and Limits" showing a Kubernetes Node with stacked colored blocks for Eviction Threshold, Applications, kubelet/Docker/kube-proxy/CNI, and OS system daemons. It illustrates resource allocation and eviction order within a Kubernetes node.
Example deployment with requests and limits
  • Use realistic values guided by load testing/profiling.
  • Prefer horizontal scaling (replicas) and leave some headroom for system processes (~20% is a common starting point).
Requests affect scheduling (the scheduler uses them). Limits affect runtime enforcement (the kubelet enforces them). This distinction is frequently tested on the CNPA exam.
Autoscaling layers — how they fit together Kubernetes and the surrounding ecosystem implement multiple complementary autoscaling layers: Horizontal Pod Autoscaler (HPA)
  • Uses metrics from the Metrics Server or external adapters.
  • Can scale on CPU, memory, or custom/pod/external metrics.
  • Samples at regular intervals and adjusts replicas between min/max.
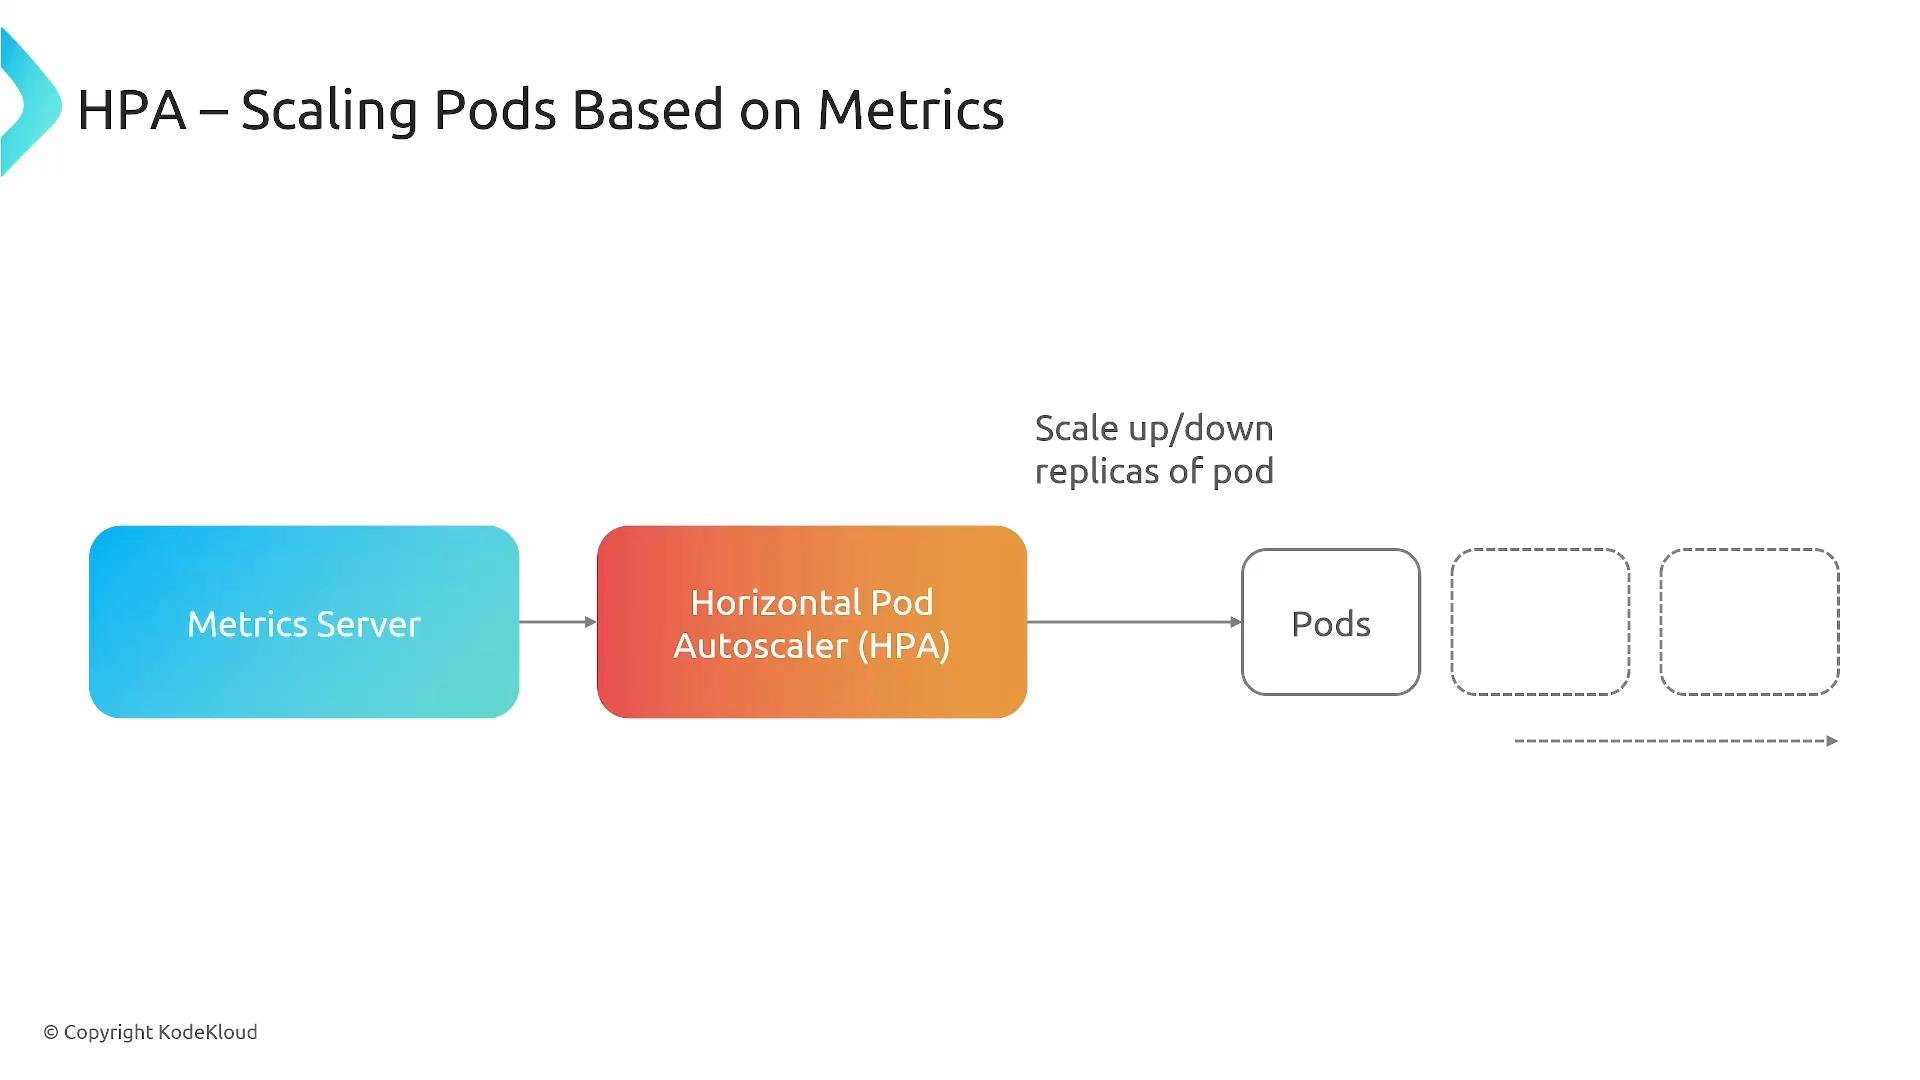
A diagram of Kubernetes Horizontal Pod Autoscaler: the Metrics Server feeds the Horizontal Pod Autoscaler (HPA), which then scales Pods. Dashed boxes and an arrow show scaling up/down additional pod replicas.
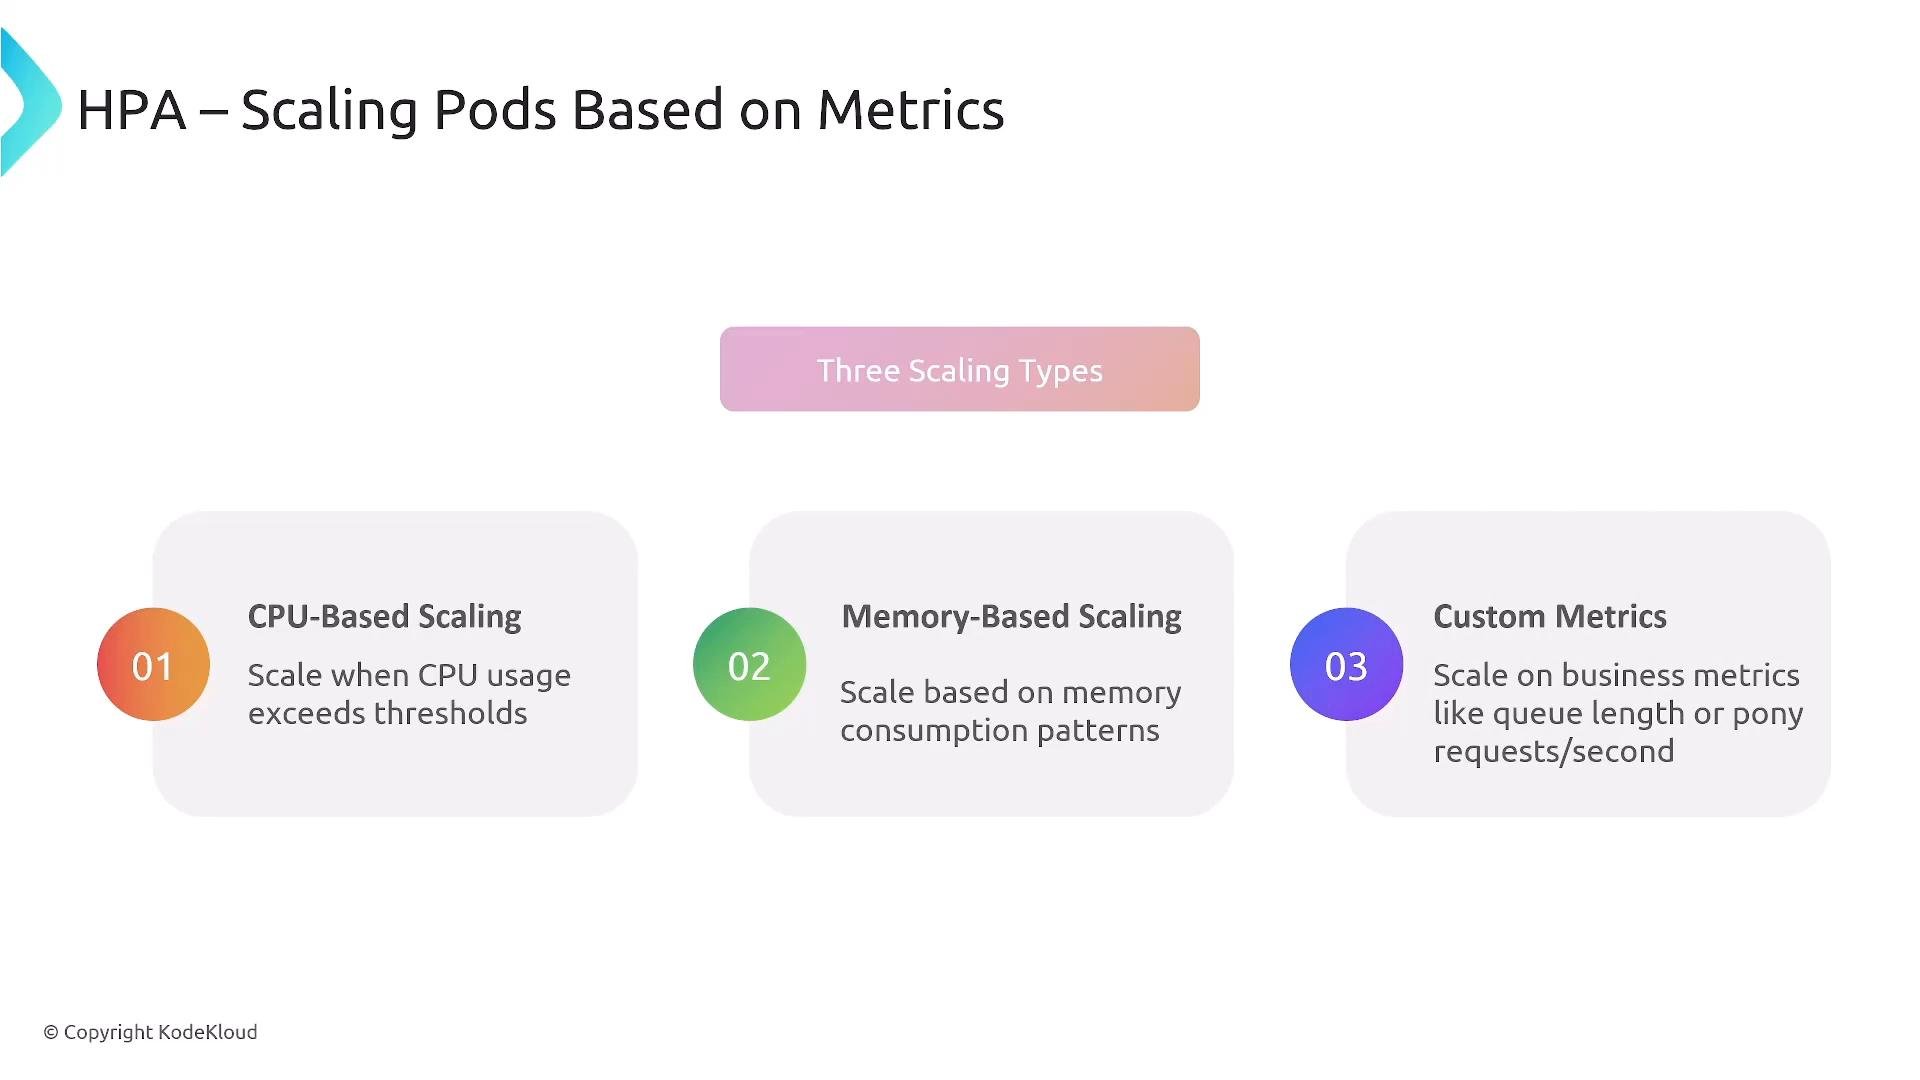
HPA scaling types: CPU, memory, and custom metrics
A presentation slide titled "HPA – Scaling Pods Based on Metrics" showing three scaling types: CPU-based, memory-based, and custom metrics. Each type has a short description about when to scale (CPU thresholds, memory consumption patterns, or business metrics like queue length).
HPA example (CPU + pod-level custom metric)
HPA behavior notes
  • Default evaluation frequency is frequent (often ~15s), configurable.
  • When multiple metrics exist, HPA uses the metric that recommends the highest replica count.
  • Scale-up tends to be faster; scale-down is conservative to avoid flapping.
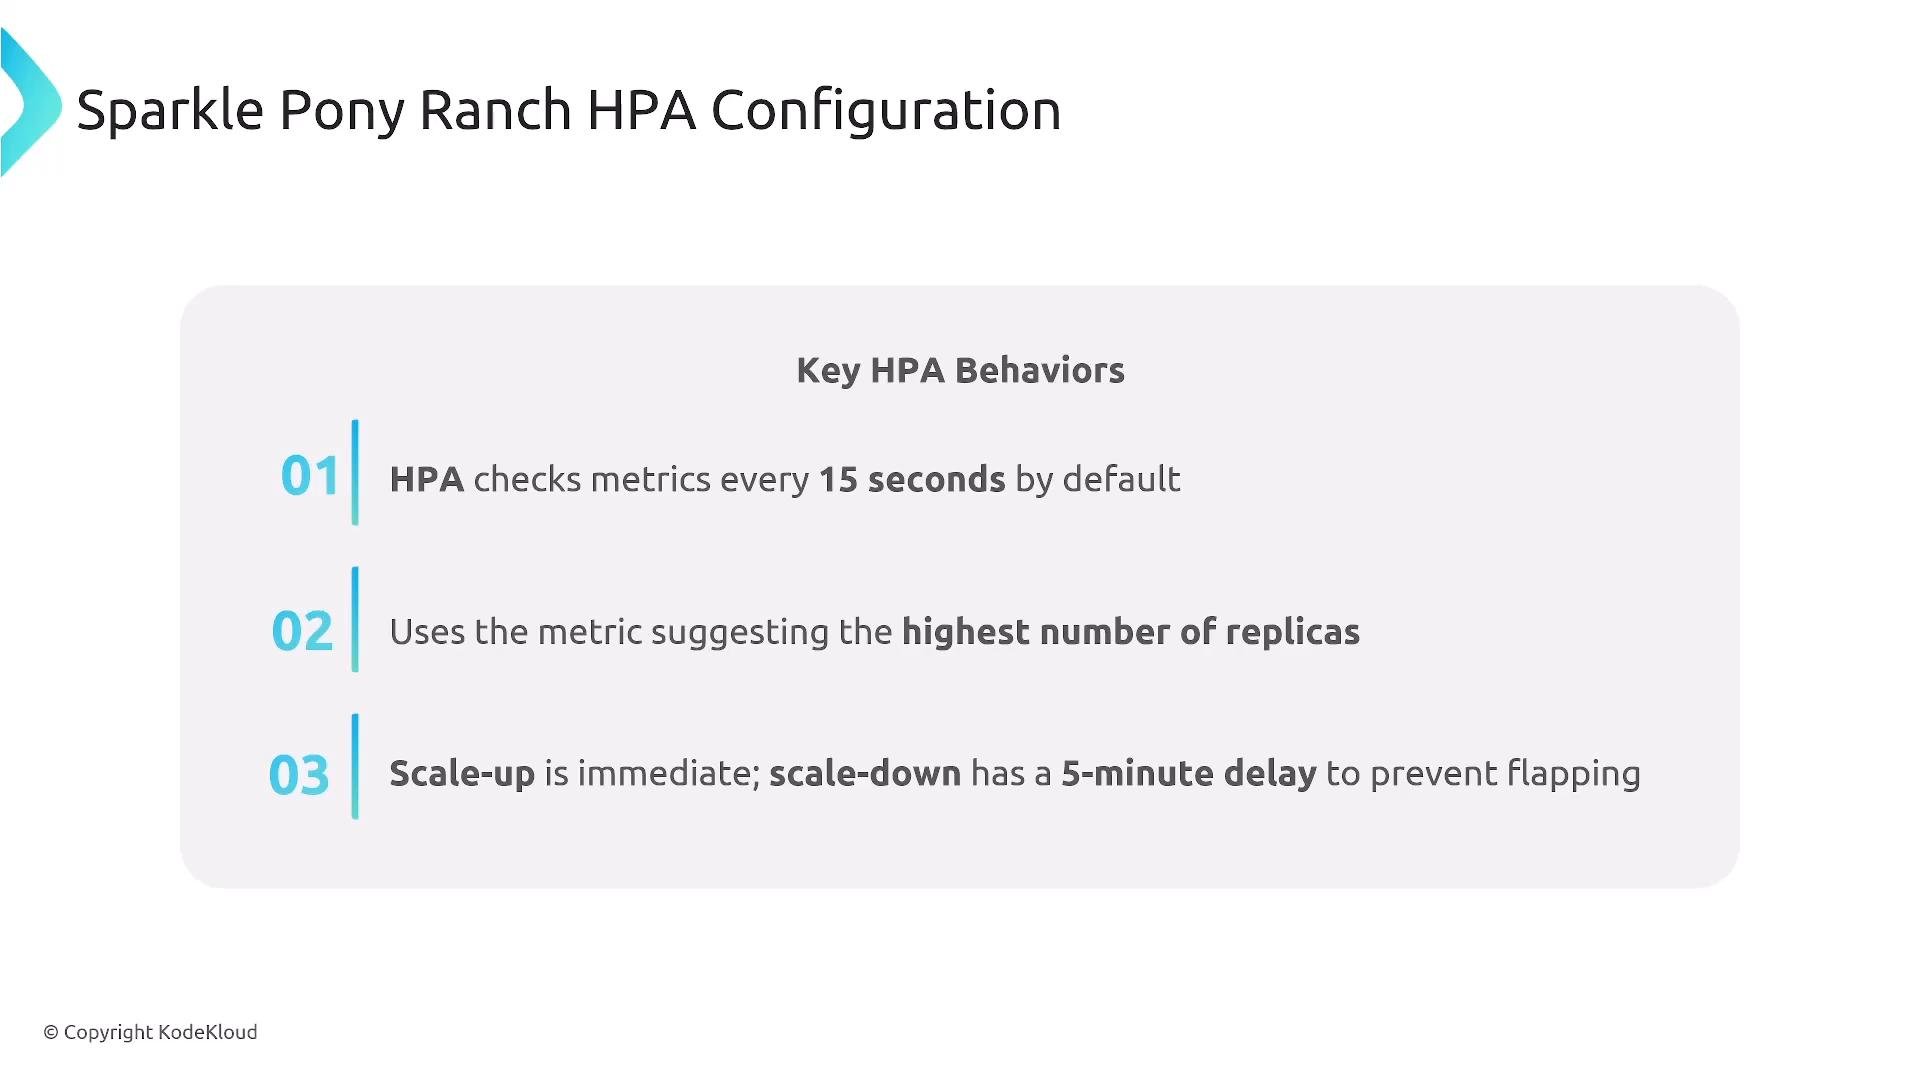
A presentation slide titled "Sparkle Pony Ranch HPA Configuration" summarizing key HPA behaviors. It states HPA checks metrics every 15 seconds, uses the metric suggesting the highest number of replicas, and scales up immediately while scale-down has a 5-minute delay.
Vertical Pod Autoscaler (VPA) and Dynamic Resource Allocation (DRA)
  • VPA can recommend or apply new CPU/memory requests; applying changes may restart pods.
  • Dynamic Resource Allocation (DRA) is an emerging approach that enables more flexible runtime changes (including specialized hardware like GPUs) in supported platforms without disruptive restarts.
Cluster Autoscaler (node-level)
  • Observes unschedulable pods and adjusts node pool size.
  • Scales down idle nodes while honoring PodDisruptionBudgets (PDBs).
  • Requires cloud permissions (e.g., IAM) to create/delete instances.
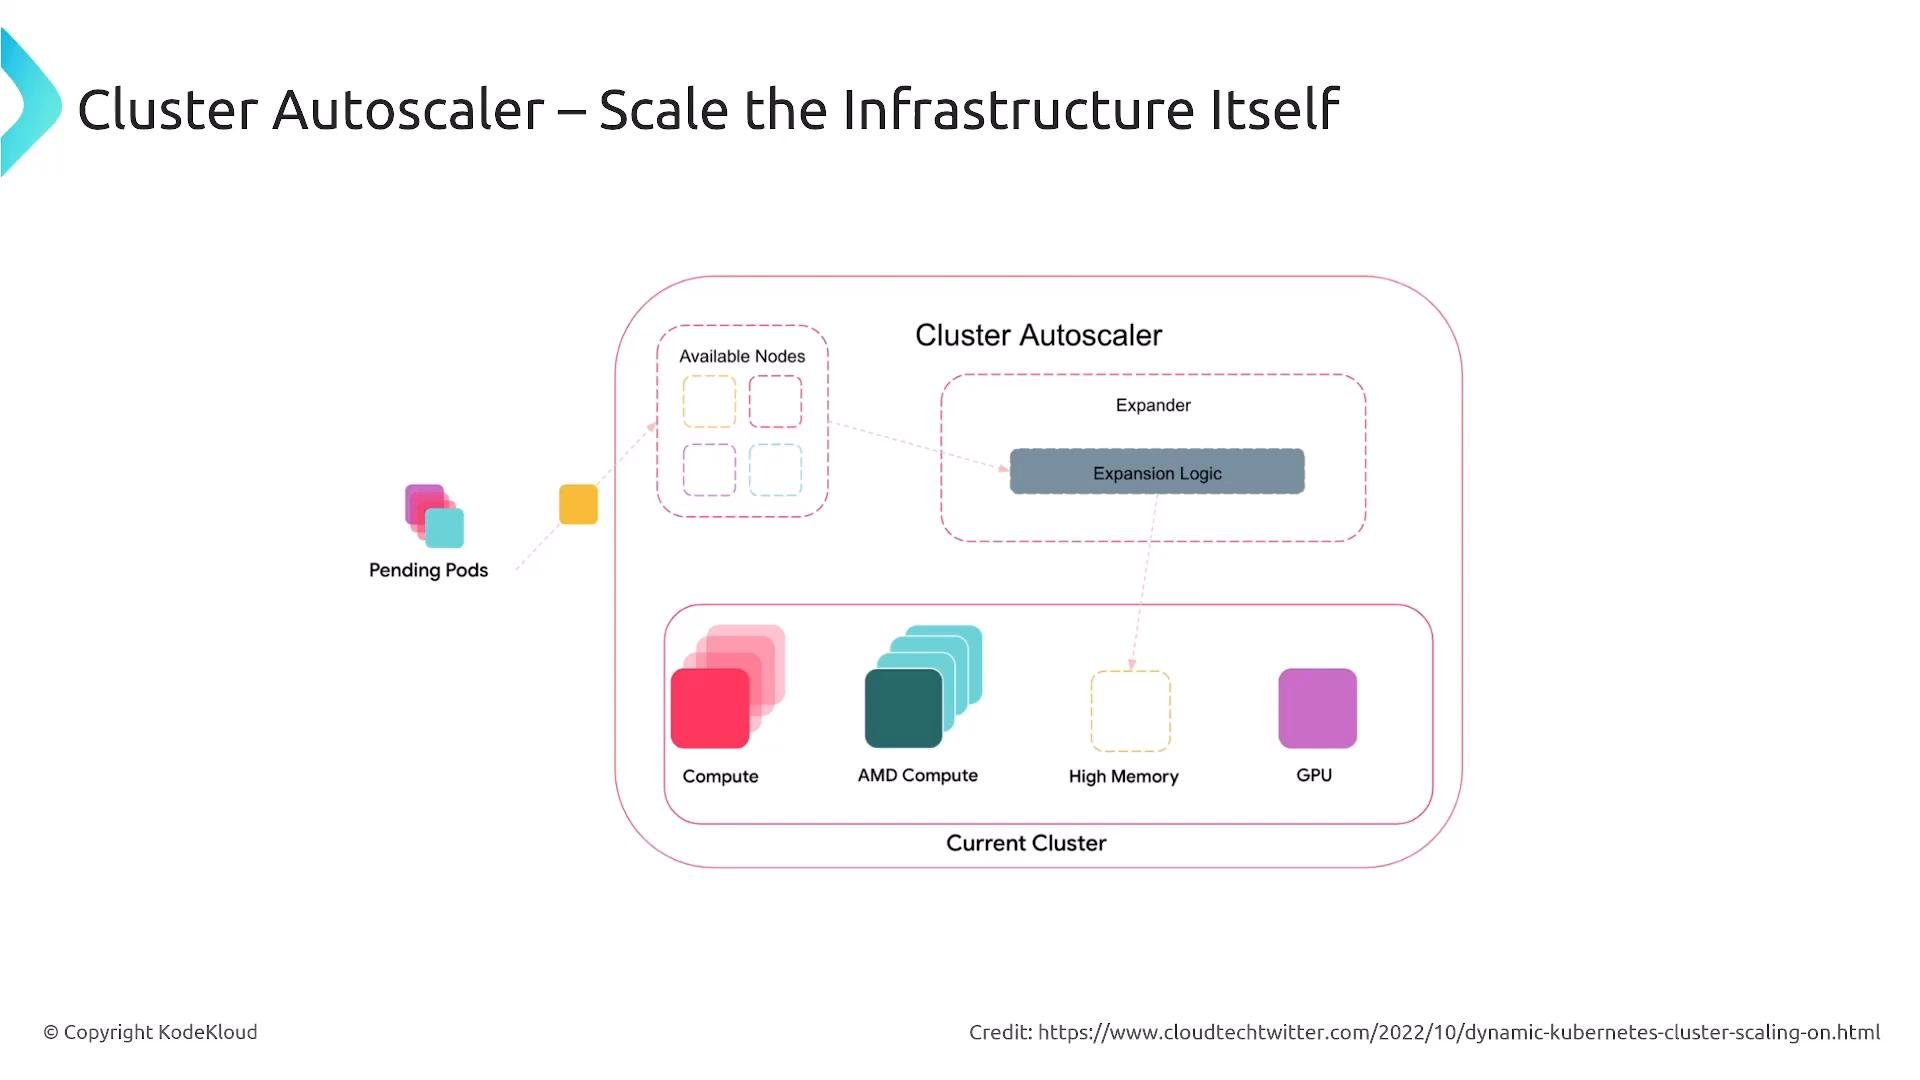
A diagram titled "Cluster Autoscaler – Scale the Infrastructure Itself" showing how pending pods trigger expansion logic to add available node types. It illustrates a current cluster with node pools like Compute, AMD Compute, High Memory, and GPU being scaled by the autoscaler.
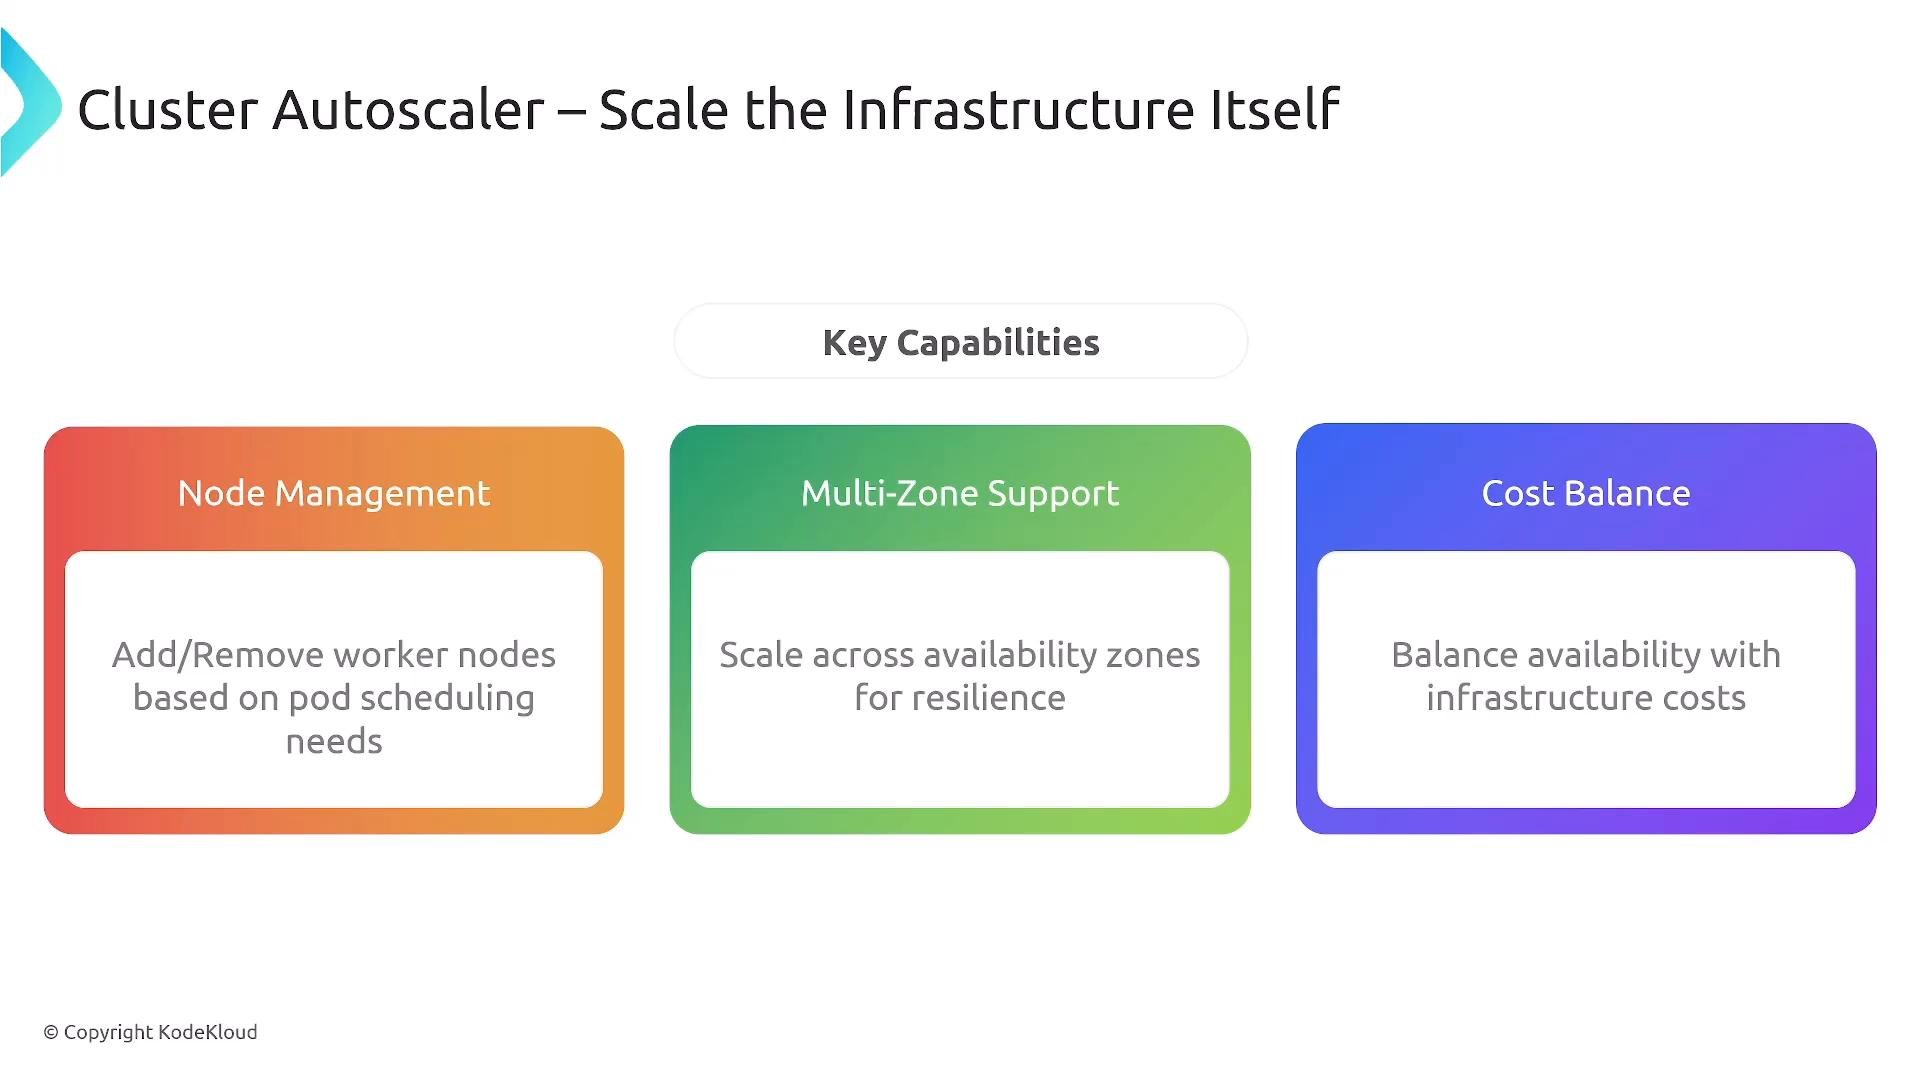
Cluster Autoscaler capabilities
A presentation slide titled "Cluster Autoscaler – Scale the Infrastructure Itself" showing three colored cards listing key capabilities: Node Management, Multi-Zone Support, and Cost Balance with brief descriptions of each.
Common pitfalls for Cluster Autoscaler
  • Pod requests may not match any available instance type — autoscaler cannot add an unsupported node type.
  • Autoscaler respects PDBs and will not scale in if it would violate them.
  • Missing or incorrect cloud permissions will block node operations.
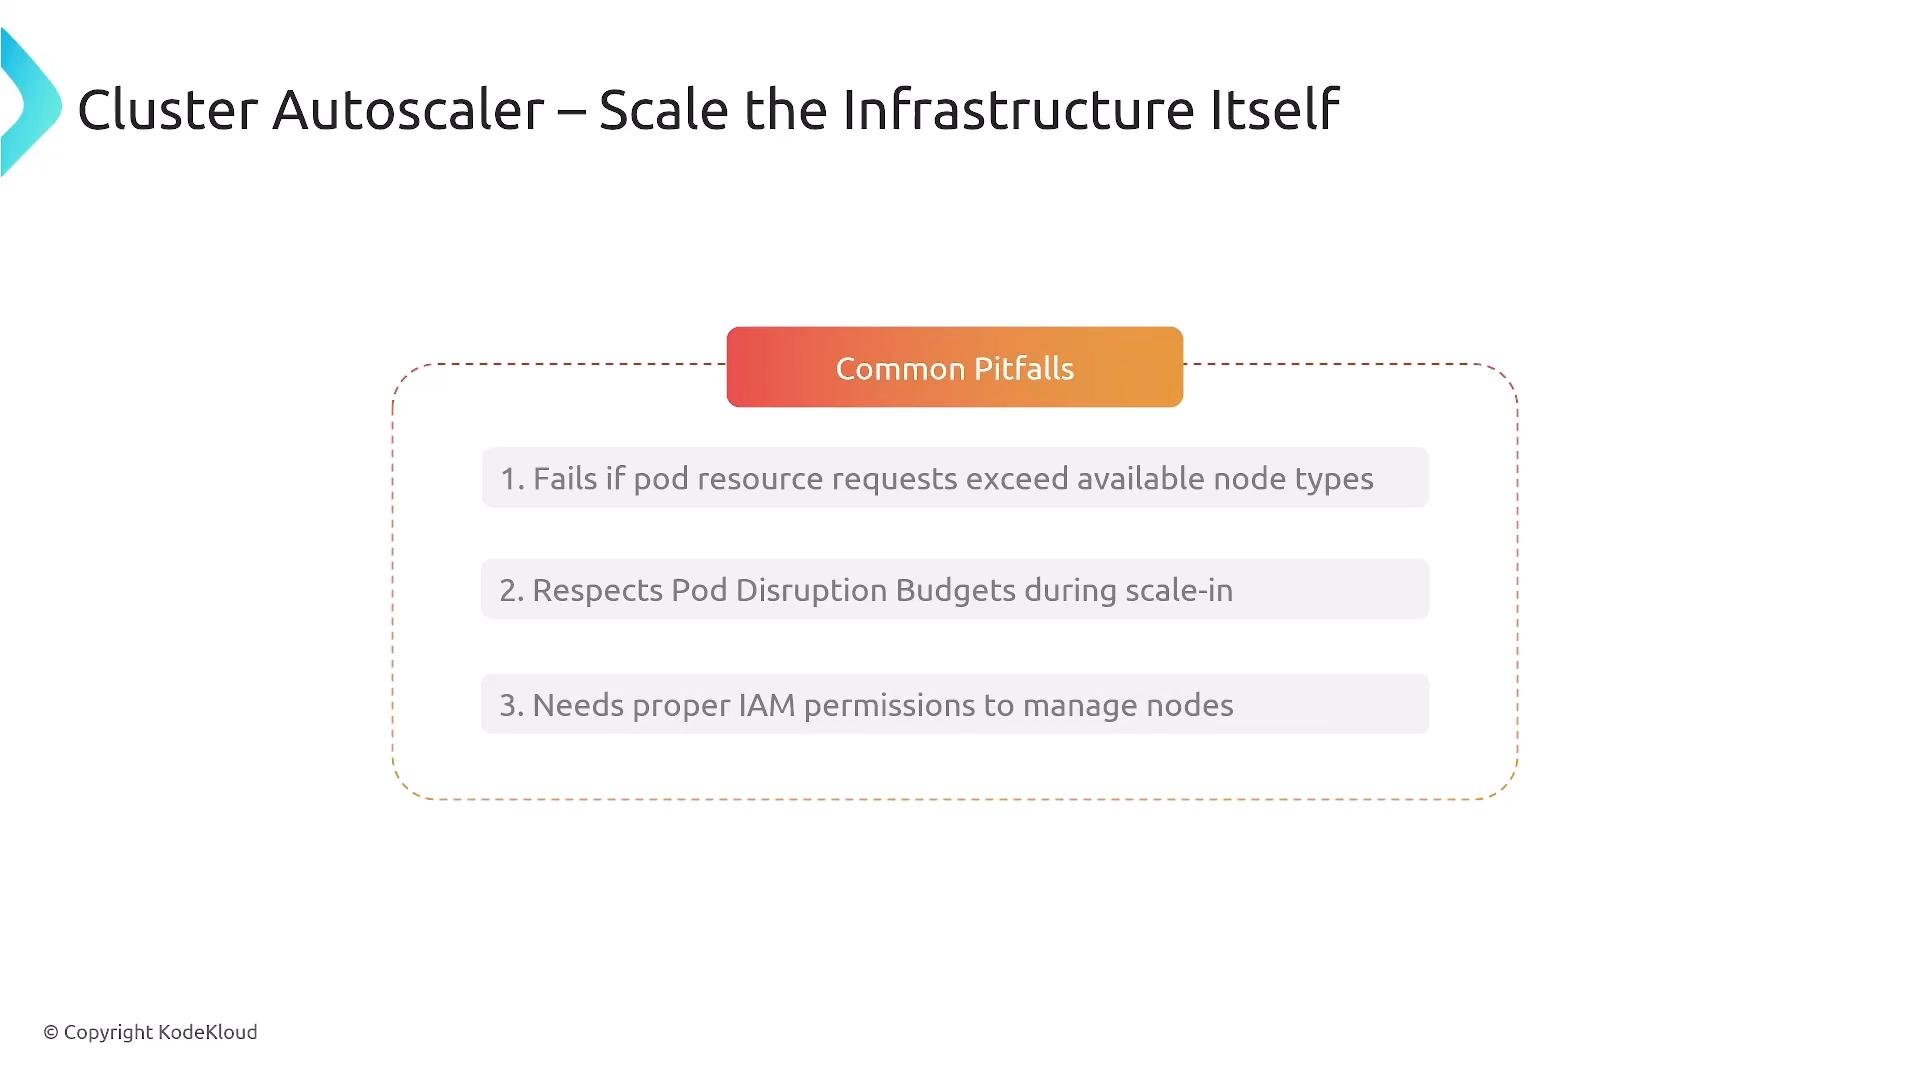
A presentation slide titled "Cluster Autoscaler – Scale the Infrastructure Itself" with a highlighted "Common Pitfalls" box. It lists three issues: pod requests may exceed available node types, the autoscaler respects Pod Disruption Budgets during scale‑in, and it requires proper IAM permissions to manage nodes.
KEDA — event-driven autoscaling
  • Scales on external signals: queue depth (Kafka, RabbitMQ), Prometheus, cloud metrics, or scheduled (cron) triggers.
  • Can scale to zero for idle workloads (serverless-style behavior).
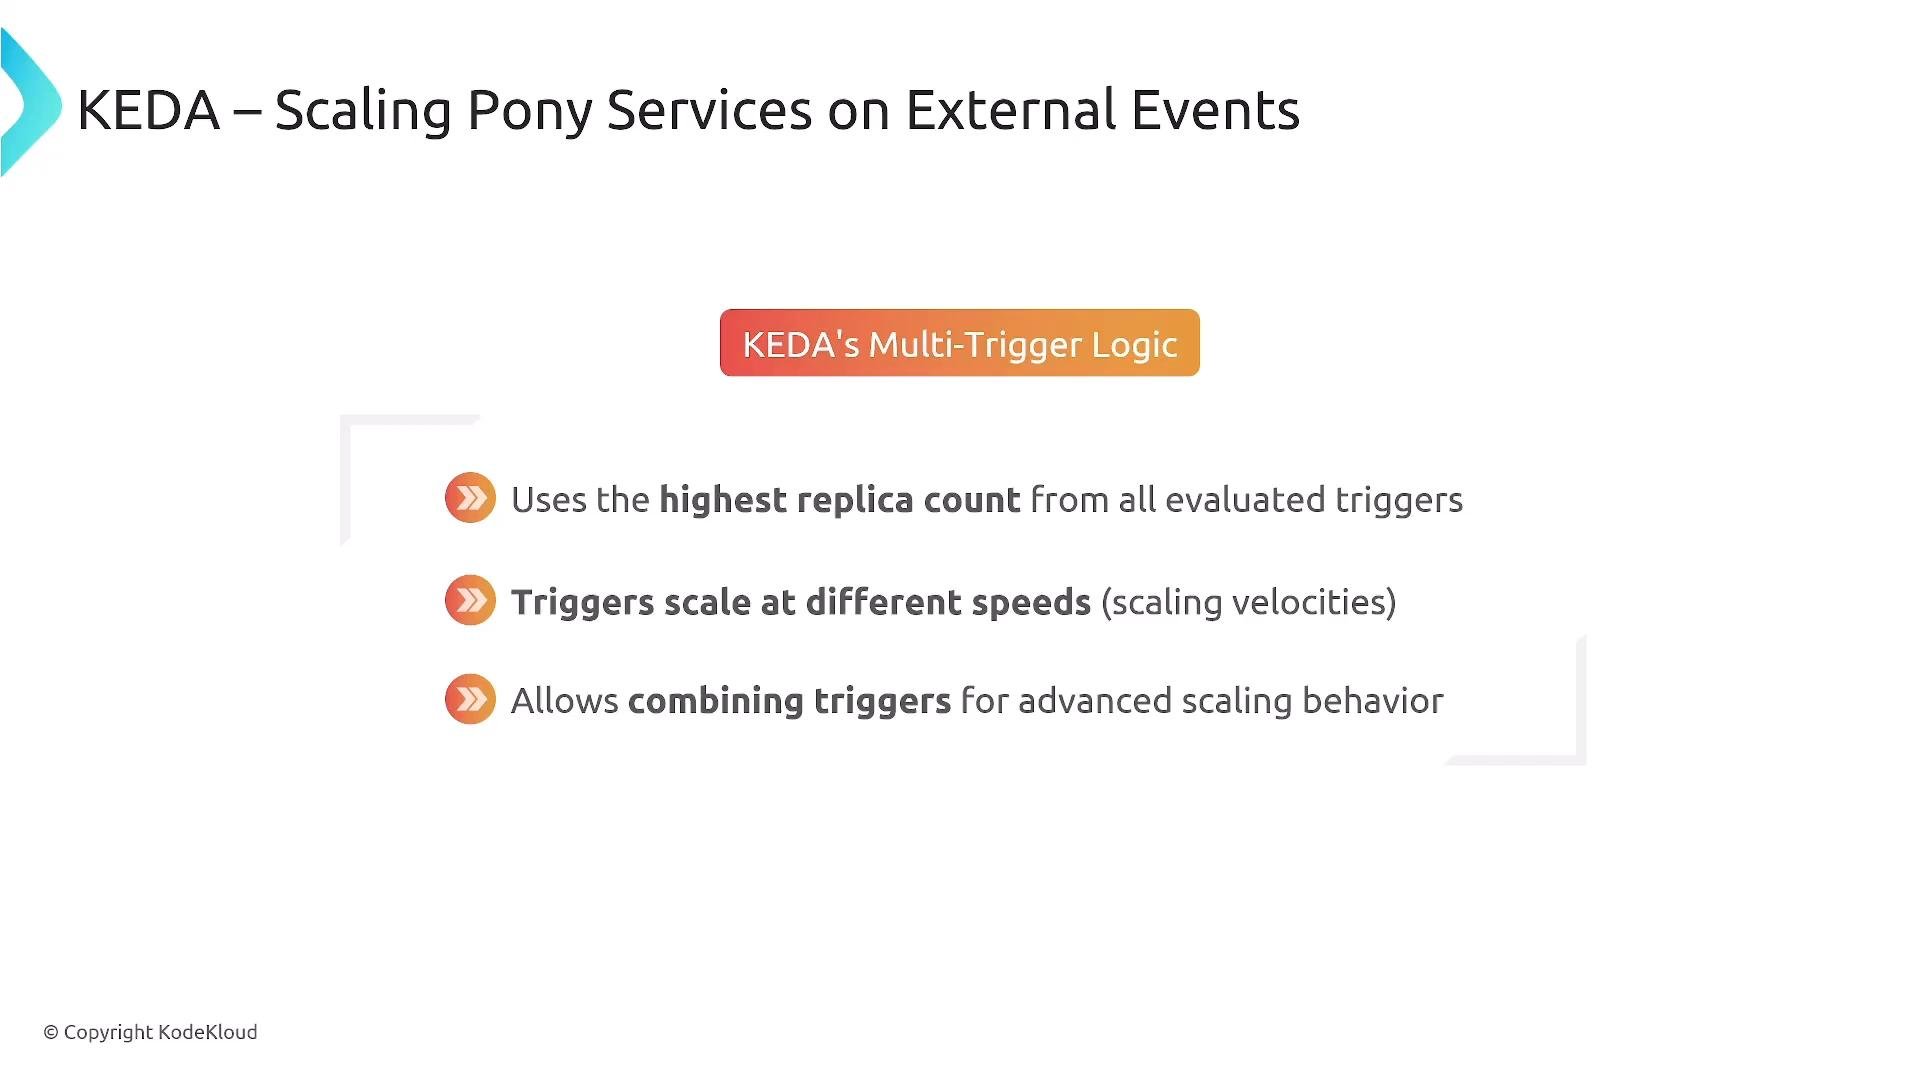
  • Supports multi-trigger logic and uses the trigger that yields the highest replica recommendation.
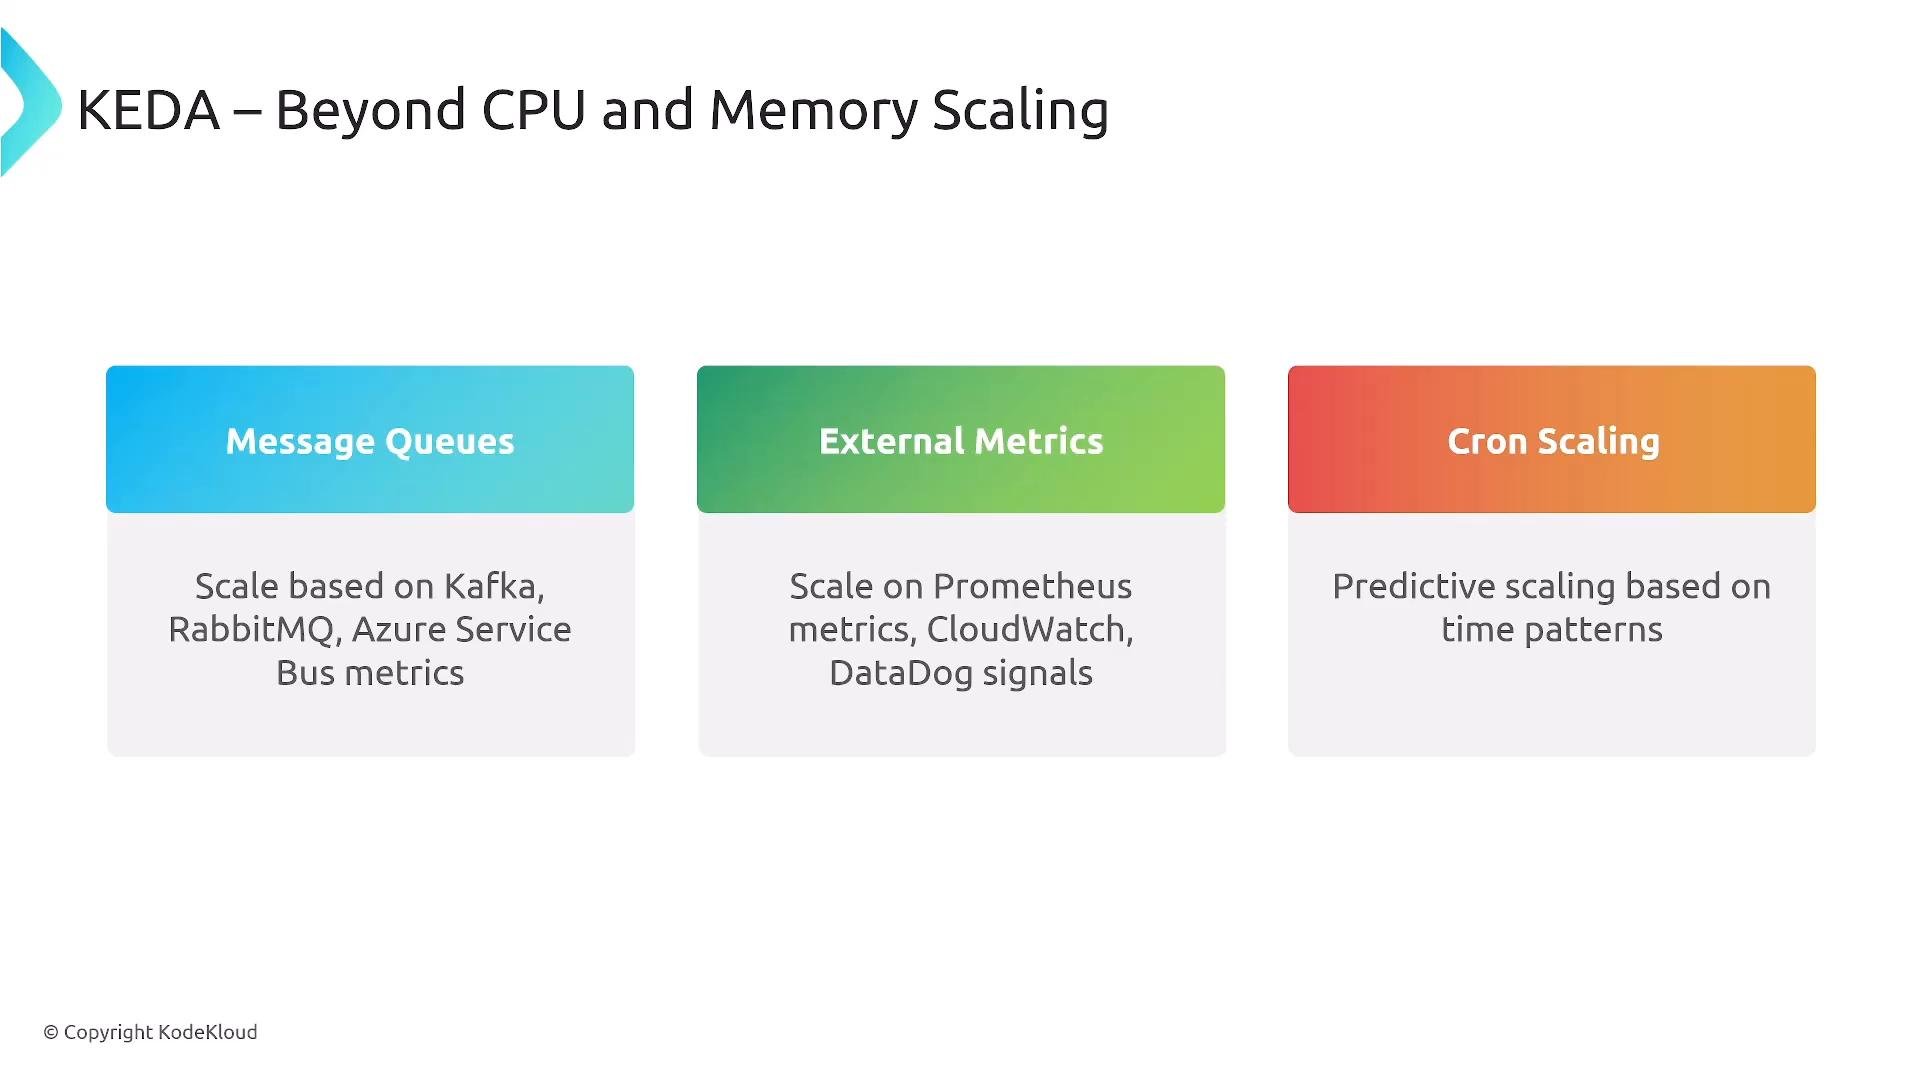
A slide titled "KEDA — Beyond CPU and Memory Scaling" showing three colored boxes: Message Queues, External Metrics, and Cron Scaling. Each box lists examples (Kafka/RabbitMQ/Azure Service Bus; Prometheus/CloudWatch/DataDog; and predictive time-based scaling).
KEDA use cases: business events, queue-driven processing, or time-based burst scaling.
A presentation slide titled "KEDA – Scaling Pony Services on External Events" showing "KEDA's Multi-Trigger Logic." It lists three points: use the highest replica count, triggers scale at different speeds, and allow combining triggers for advanced scaling.
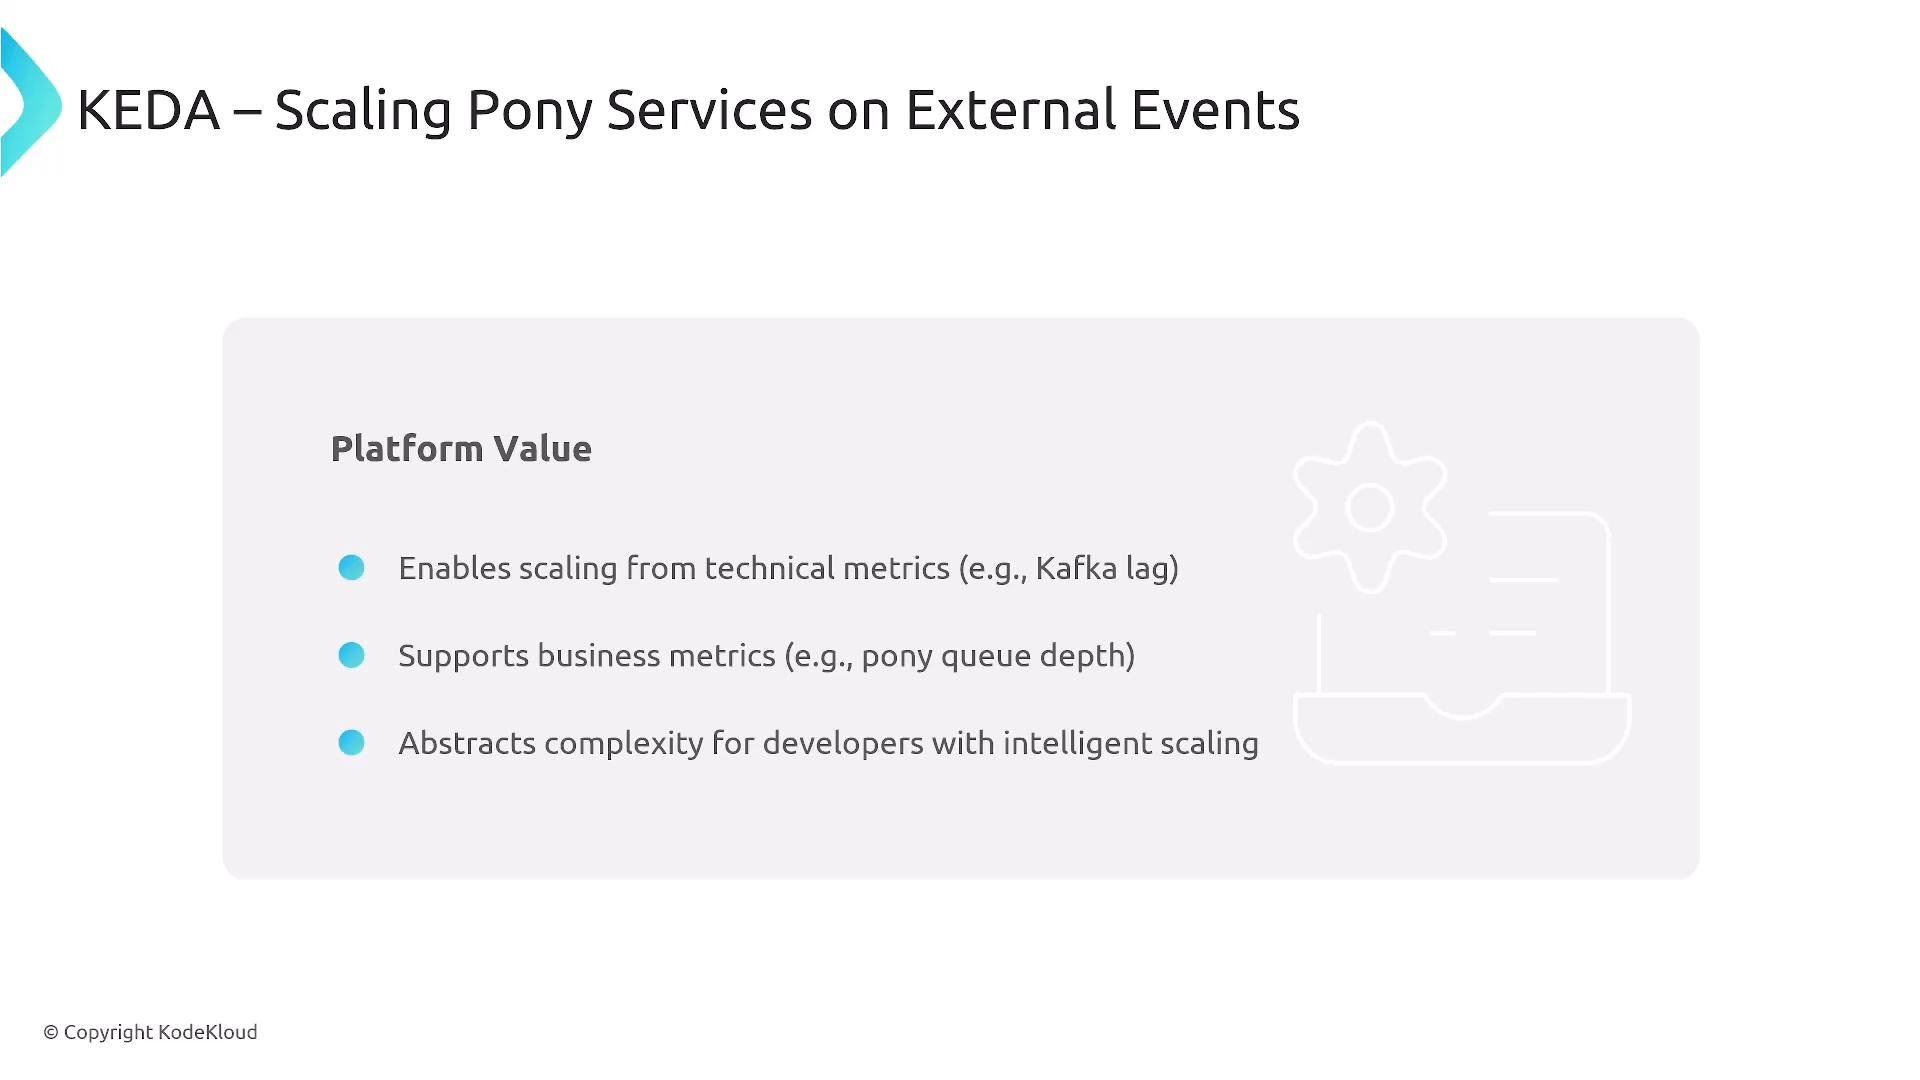
A presentation slide titled "KEDA – Scaling Pony Services on External Events." It lists platform value points: enabling scaling from technical metrics (e.g., Kafka lag), supporting business metrics (e.g., pony queue depth), and abstracting complexity for developers with intelligent scaling.
Karpenter and workload-aware node provisioning
  • Karpenter chooses instance types and provisions nodes just-in-time, mixing Spot and On-Demand where appropriate.
  • Reduces reliance on pre-defined Auto Scaling Groups and improves startup latency for nodes.
  • Cloud providers provide managed variants (GKE Autopilot, AKS virtual nodes).
Dynamic Resource Allocation (DRA) — beyond CPU/memory DRA extends resource management to GPUs, custom hardware, and finer-grained resource shares (in implementations that support fractional GPU sharing). It can allow:
  • Declarative claims for specialized hardware (pattern similar to PersistentVolumeClaims).
  • Runtime flexibility in supported environments (less disruptive than restarts).
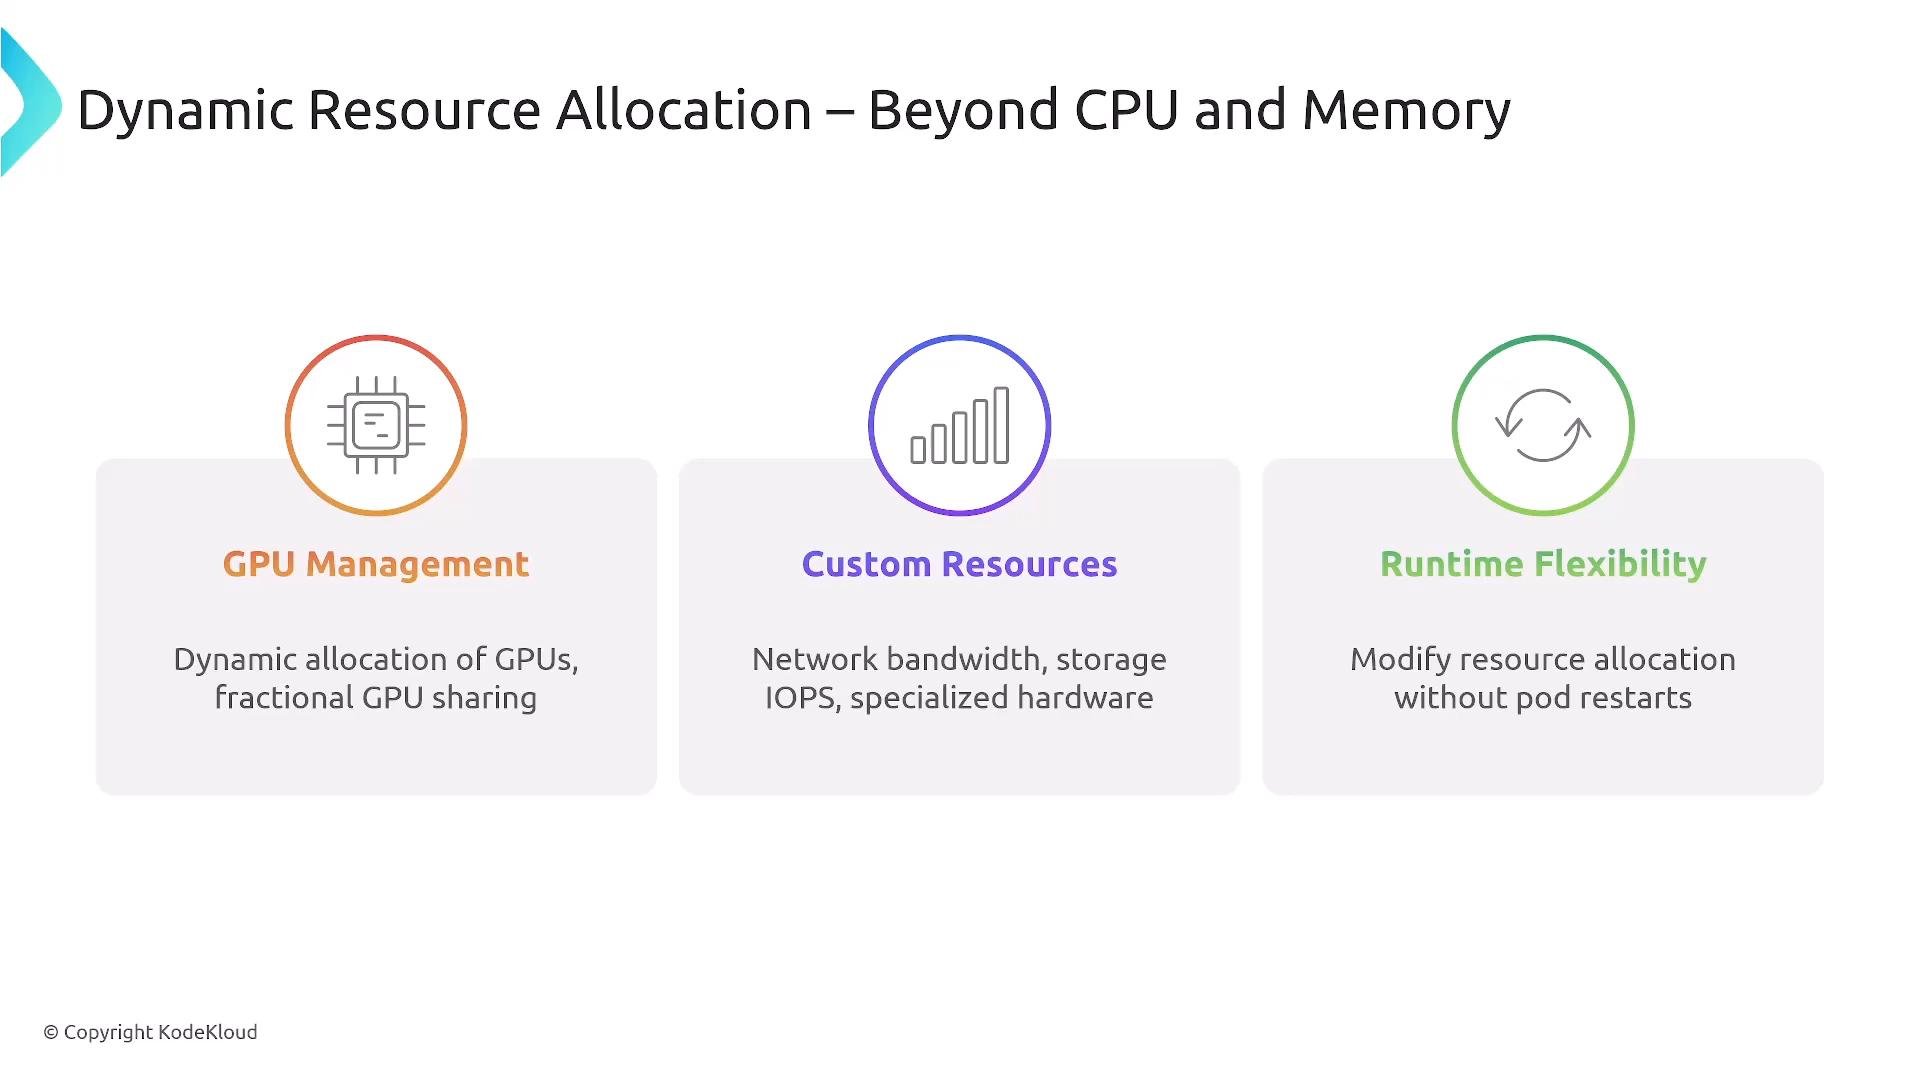
A presentation slide titled "Dynamic Resource Allocation – Beyond CPU and Memory" highlighting three features. It lists GPU Management (dynamic/fractional GPU sharing), Custom Resources (network bandwidth, storage IOPS, specialized hardware), and Runtime Flexibility (modify allocations without pod restarts).
Platform value for DRA
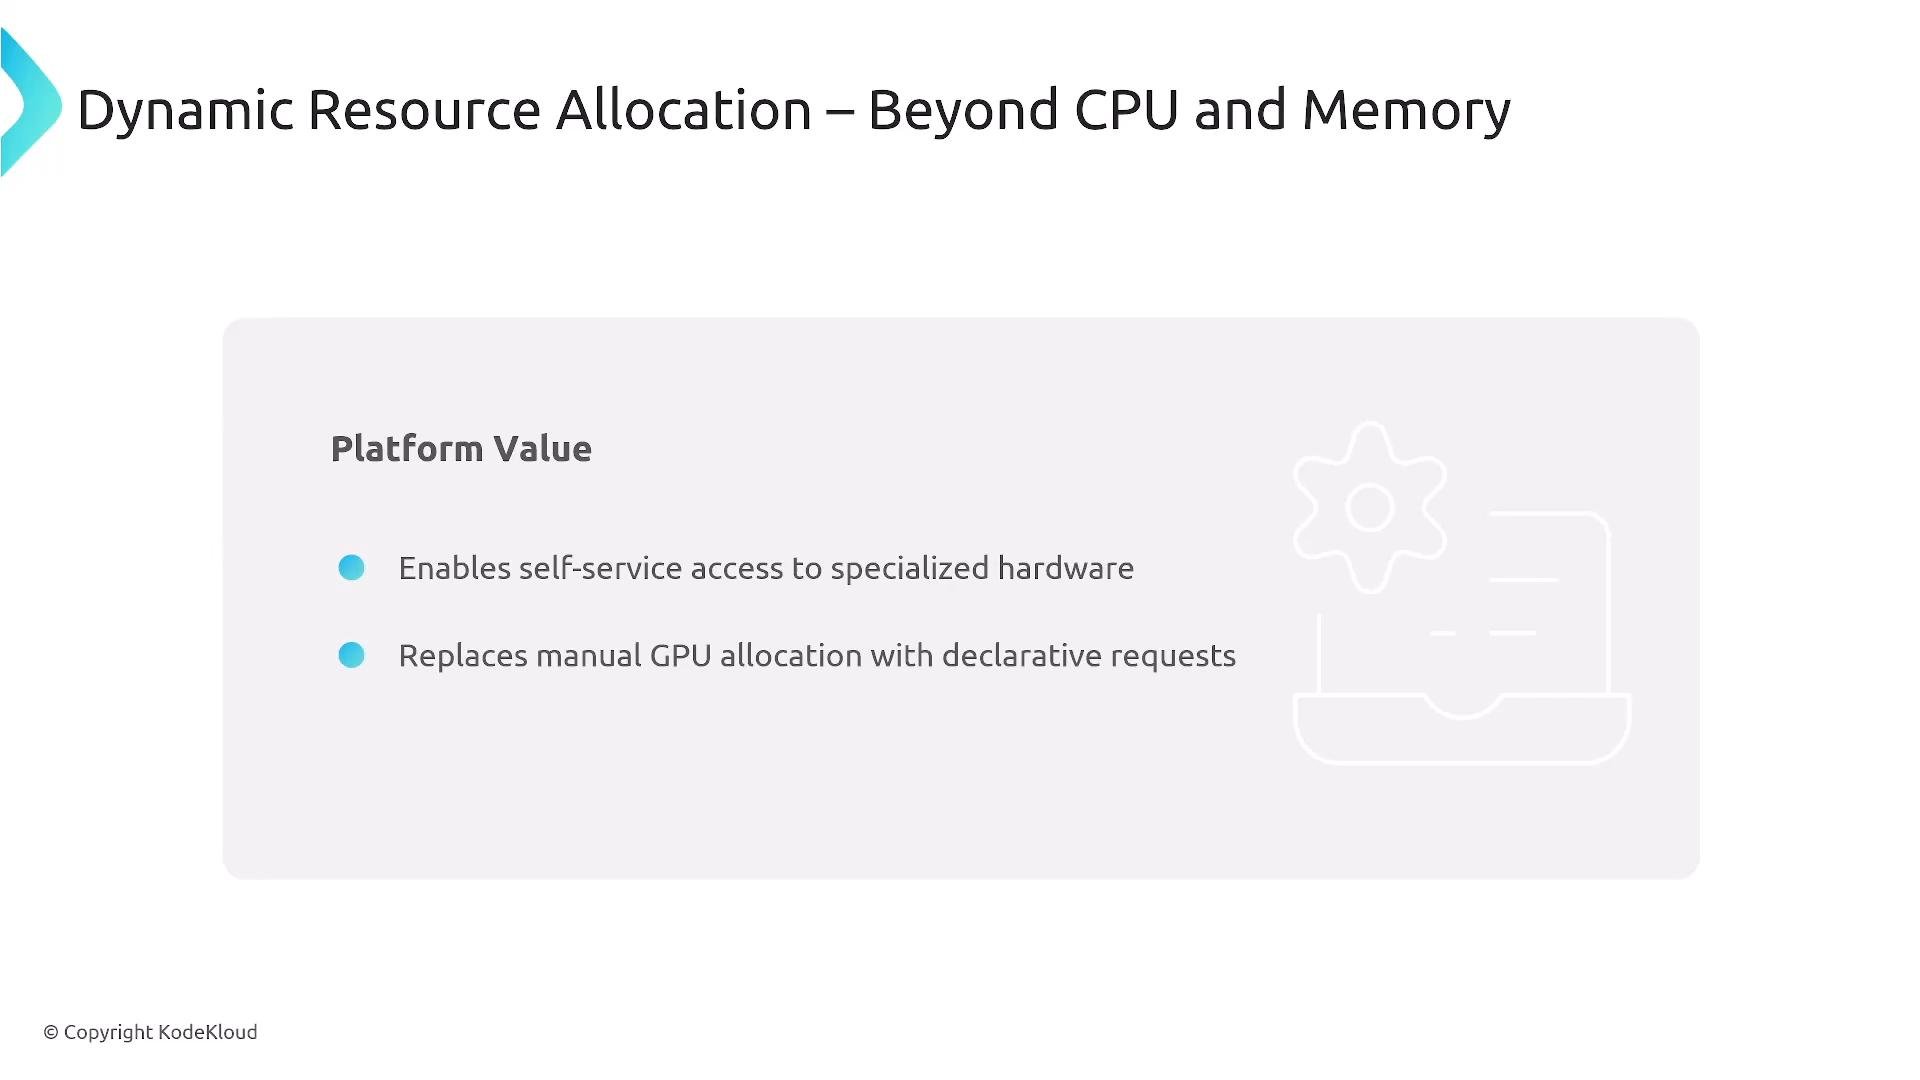
A presentation slide titled "Dynamic Resource Allocation – Beyond CPU and Memory" showing a "Platform Value" box with two bullets: "Enables self-service access to specialized hardware" and "Replaces manual GPU allocation with declarative requests." The slide also shows a faint gear/server illustration and a © Copyright KodeKloud note.
DRA example: resource claim + pod reference
  • The platform defines the resource class and parameters; workloads create claims and reference them from pods.
DRA benefits (where supported): fractional GPU sharing, automatic cleanup, and self-service access to expensive resources for complex workloads. Ecosystem autoscalers for specialized workloads
  • Database autoscalers for stateful workloads.
  • Batch schedulers and job managers (e.g., Volcano).
  • Multi-cluster autoscalers (e.g., Admiralty).
  • Predictive autoscalers using historical patterns (custom operators, Kueue-like controllers).
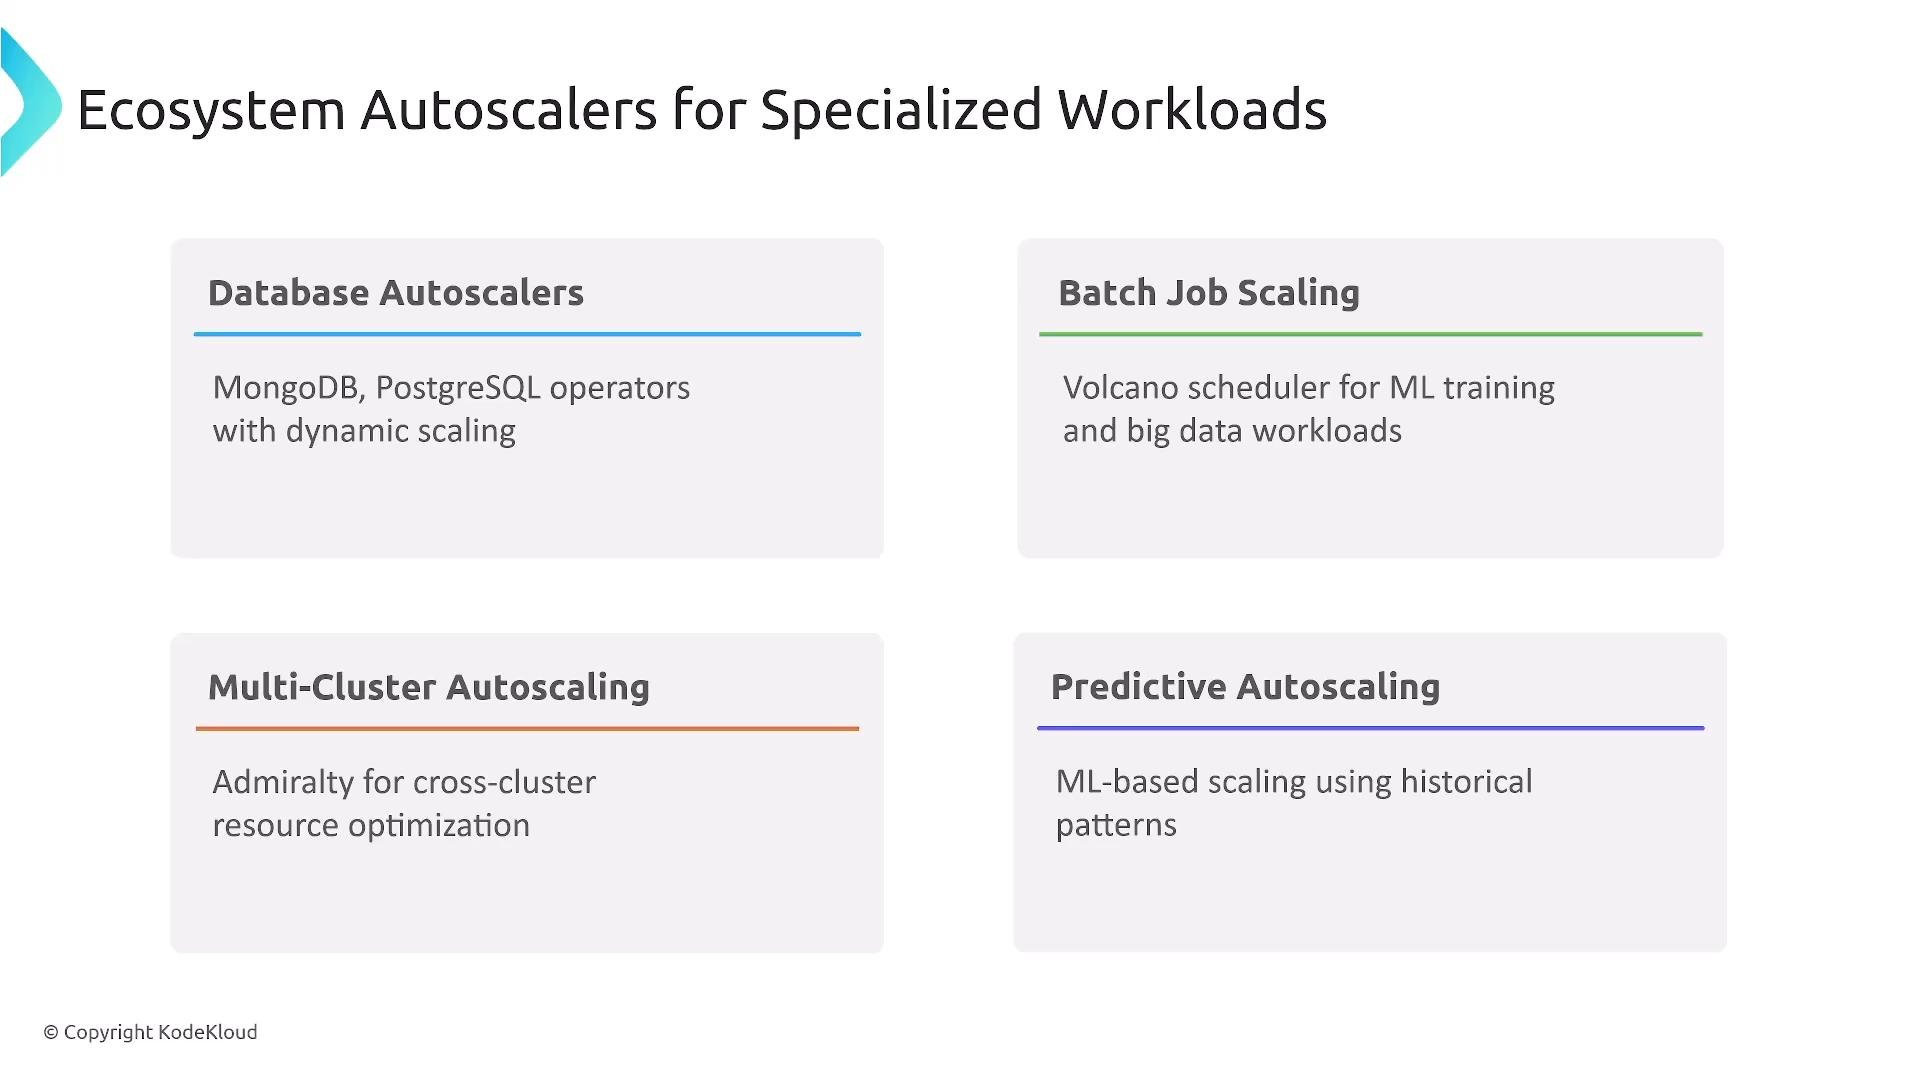
A presentation slide titled "Ecosystem Autoscalers for Specialized Workloads" showing four labeled boxes describing Database Autoscalers, Batch Job Scaling, Multi-Cluster Autoscaling, and Predictive Autoscaling with brief notes on each. The slide also includes a small copyright notice for KodeKloud.
Troubleshooting common scaling problems
  • Missing/incorrect metrics (e.g., HPA not scaling because Metrics Server is down).
  • Pods stuck in Pending (requests exceed available node types, quotas, or constraints).
  • Cluster Autoscaler issues (permissions/roles or wrong node pools).
  • DRA/VPA recommendations not applied due to policies or constraints.
When troubleshooting, verify:
  • Cloud credentials and IAM permissions for autoscalers that manage nodes.
  • Health of metric pipeline (Metrics Server, Prometheus, external metrics adapter).
  • PodDisruptionBudgets, resource quotas, and namespace/cluster policies.
  • Pod scheduling constraints and node selectors/taints/tolerations.
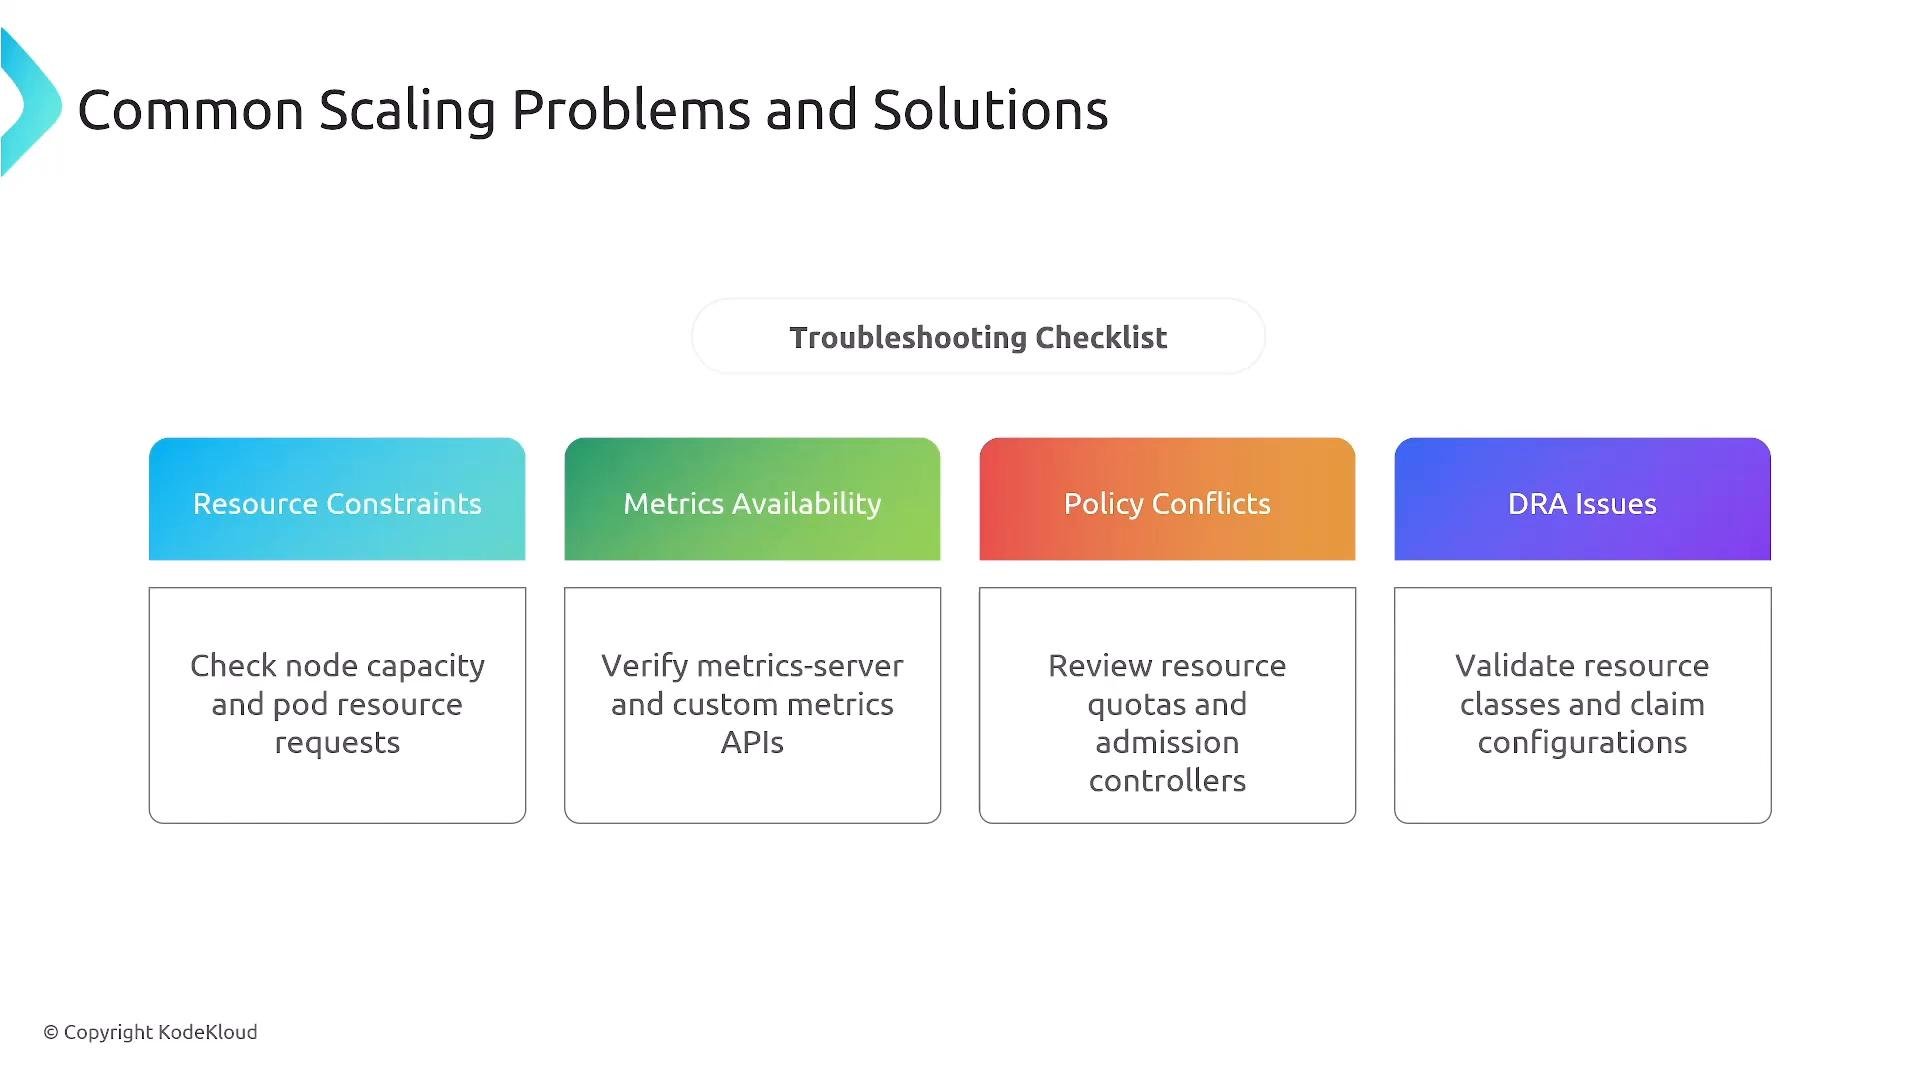
A presentation slide titled "Common Scaling Problems and Solutions" with a "Troubleshooting Checklist" header. Four colored boxes list issues—Resource Constraints, Metrics Availability, Policy Conflicts, and DRA Issues—each paired with a short recommended check or fix.
Common symptom examples
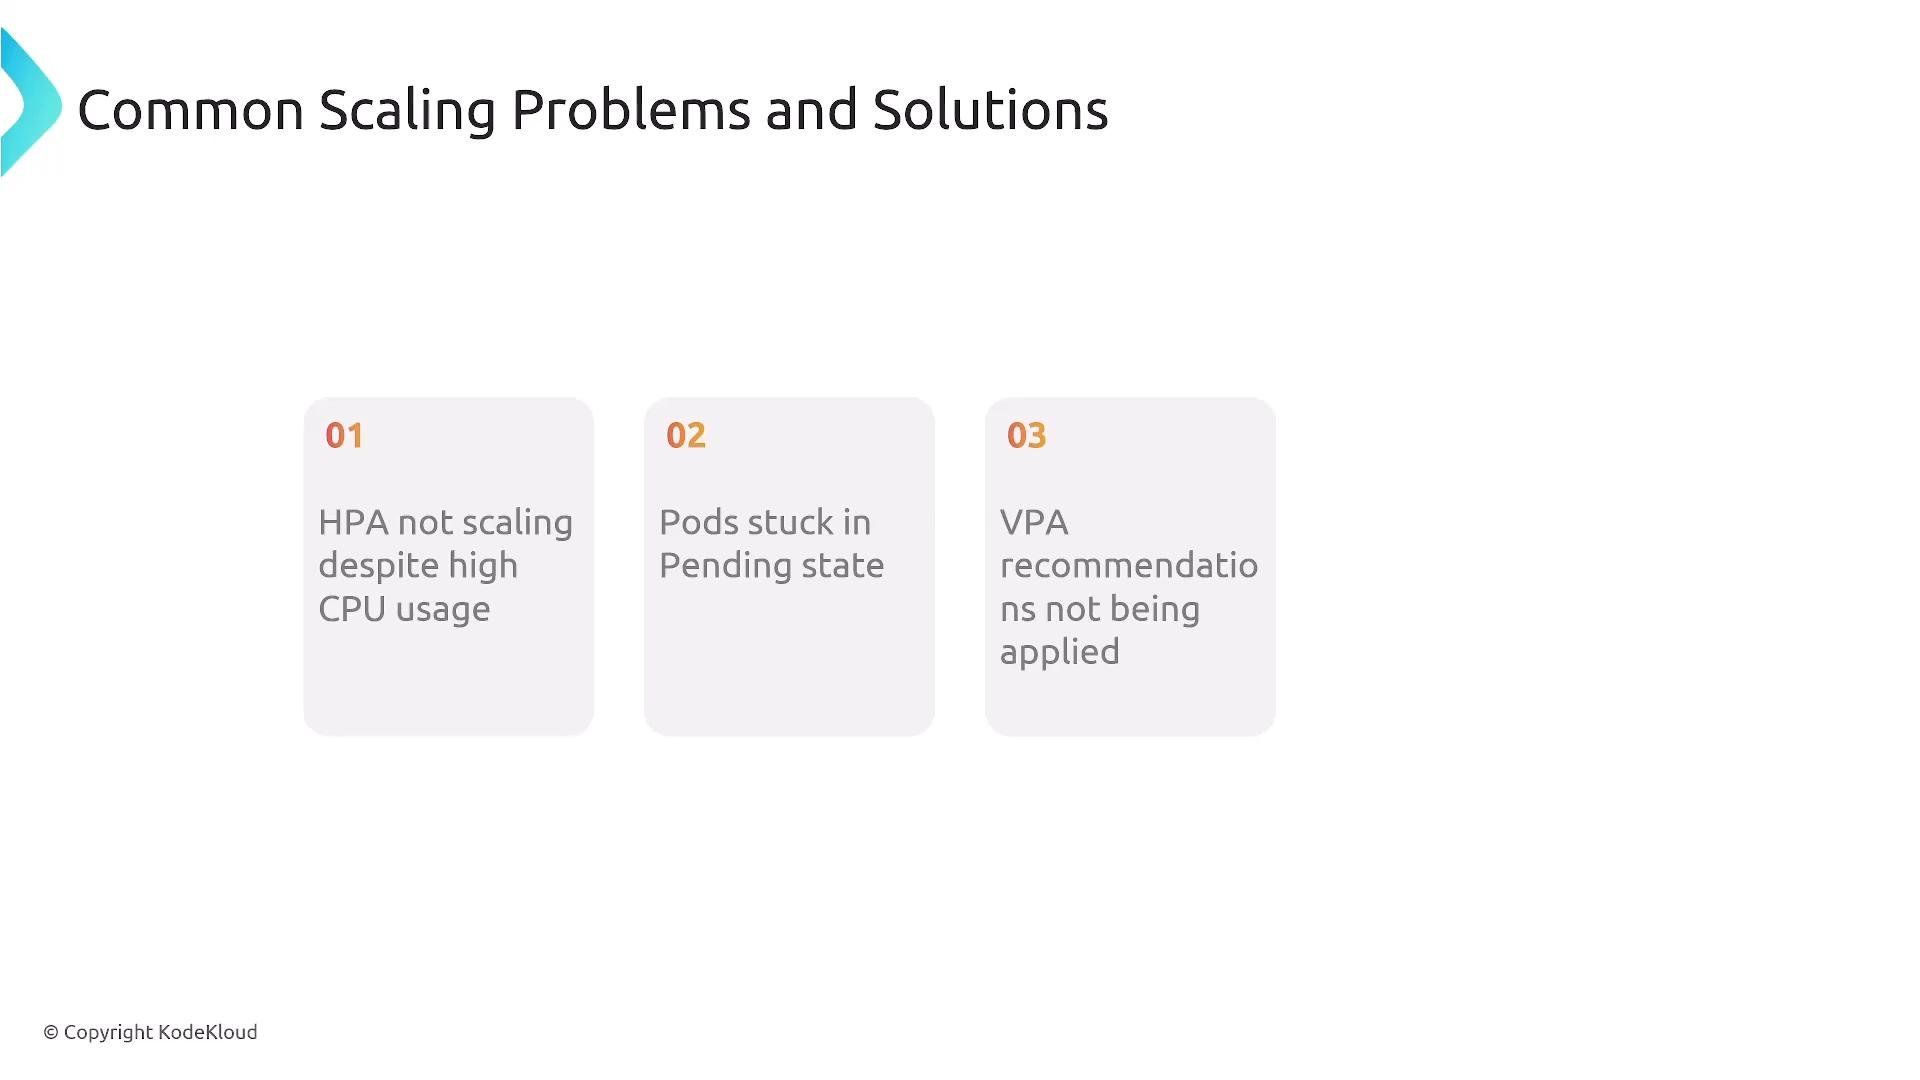
A presentation slide titled "Common Scaling Problems and Solutions" showing three numbered rounded boxes listing: 01 HPA not scaling despite high CPU usage, 02 Pods stuck in Pending state, and 03 VPA recommendations not being applied. The slide has a simple white layout with a small "© Copyright KodeKloud" footer.
Best practices for platform engineers
  • Monitor the scaling control plane (HPA, Cluster Autoscaler, Karpenter, metrics exporters).
  • Test scaling behavior in staging/non-production using load tests.
  • Document runbooks and common troubleshooting steps for operators and developers.
  • Implement health checks for scaling components (startup, readiness, liveness probes).
  • Use resource quotas and limit ranges to prevent noisy neighbors and runaway requests.
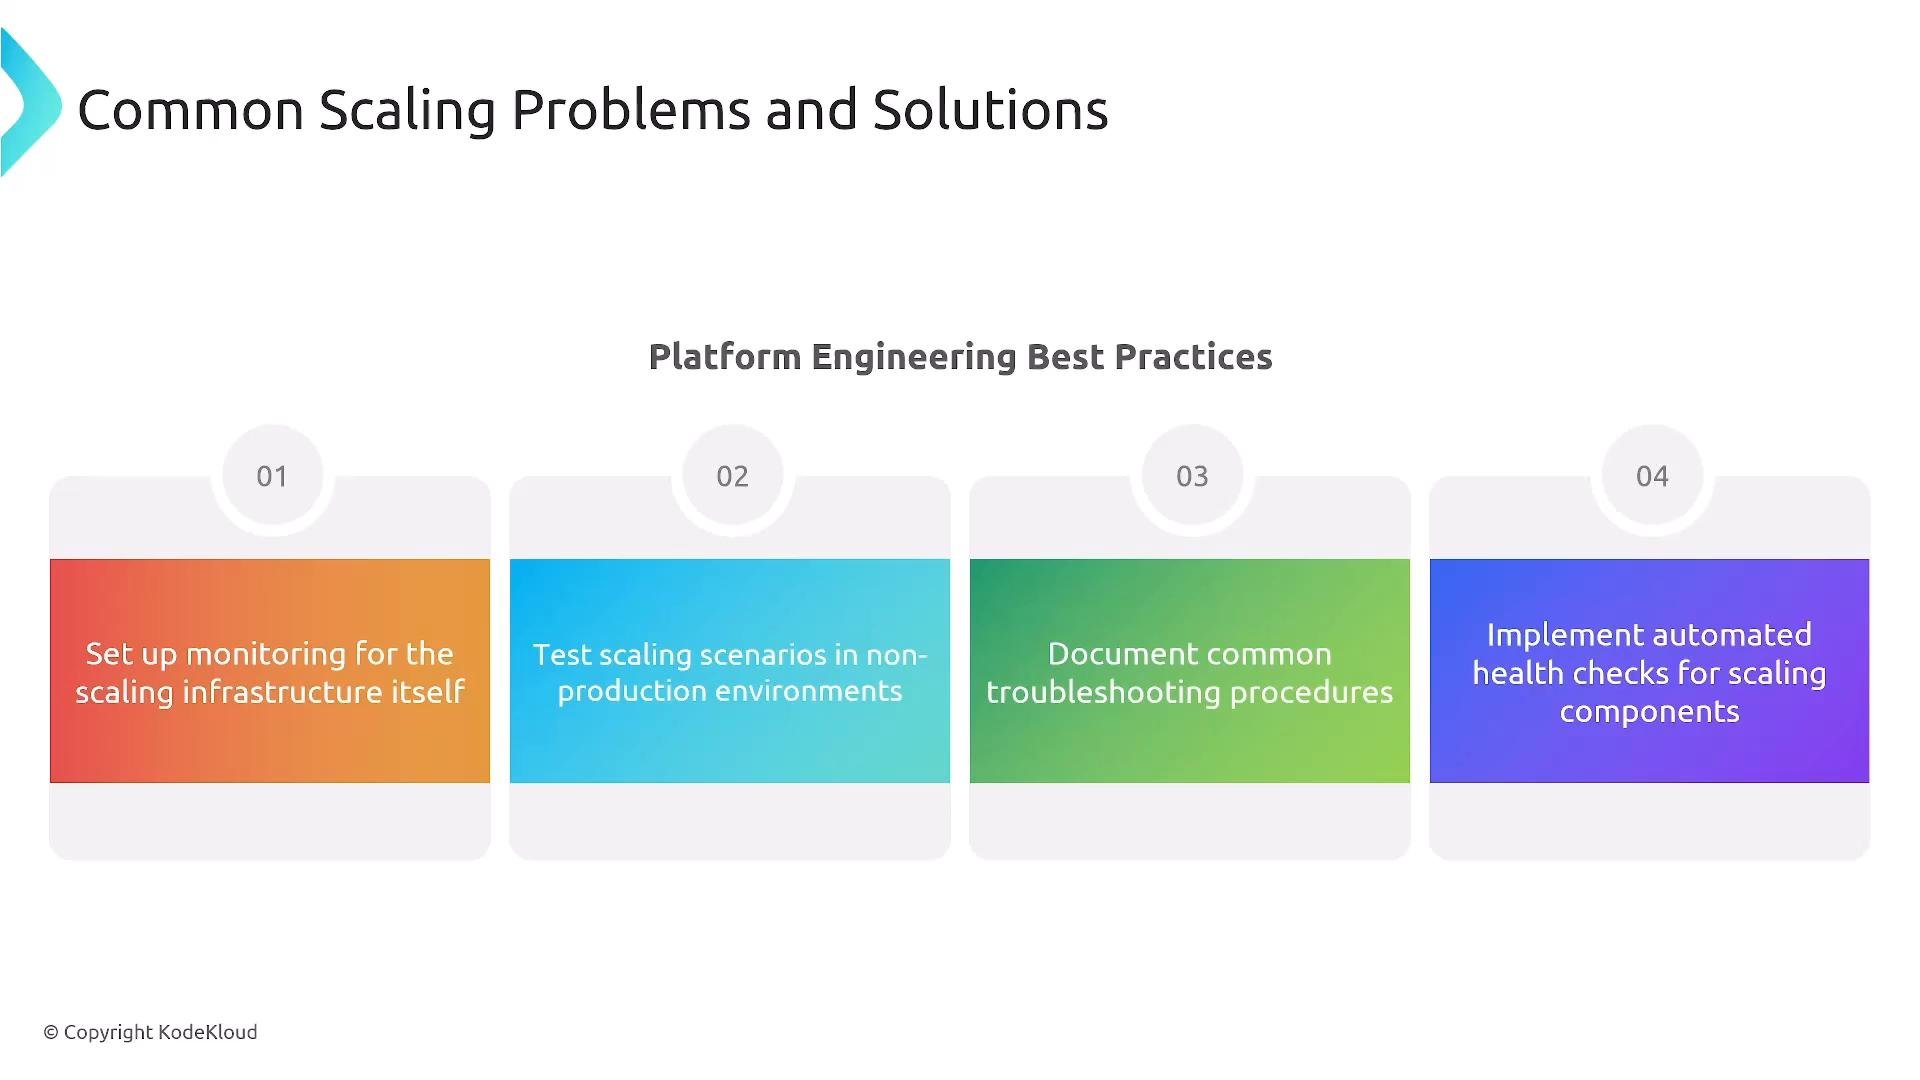
A slide titled "Common Scaling Problems and Solutions" / "Platform Engineering Best Practices" showing four numbered, colored boxes. They list best practices: set up monitoring for scaling infrastructure, test scaling in non-production, document troubleshooting procedures, and implement automated health checks for scaling components.
Key takeaways
  • Resource fundamentals: requests determine scheduling; limits determine runtime enforcement.
  • Multi-layer scaling: HPA for stateless pods, Cluster Autoscaler/Karpenter for node capacity, KEDA for event-driven/business metrics, and DRA/VPA for dynamic resource sizing where supported.
  • Troubleshooting usually involves metrics, permissions, scheduling constraints, or policy conflicts — validate these first.
  • Test scaling behavior before production use and automate monitoring + runbooks to reduce incident MTTR.
Be sure autoscalers have correct cloud provider permissions and your metric pipeline is healthy. Missing IAM roles or a downed metrics server are common root causes of autoscaling failures.
Further reading and references Intelligent resource management lets teams scale reliably, control costs, and deliver consistent user experiences. Thanks for reading this lesson.

Watch Video