

Foundational signals and categories
- Core signals: metrics, logs, and traces. Alerts are built on these signals (for example, Prometheus + Alertmanager) and events are typically annotations referencing those signals.
- The majority of tooling in modern platforms is CNCF/open source, though commercial SaaS and cloud-native managed services are common alternatives.
OpenTelemetry (OTel)
OpenTelemetry is a CNCF project and a central piece of modern observability for platform engineering. It supports multi-signal telemetry (metrics, logs, traces), provides SDKs and auto-instrumentation for many runtimes, and includes the OpenTelemetry Collector to receive, transform, and export telemetry to many backends. OTel is vendor-agnostic and helps avoid vendor lock-in through standardized instrumentation.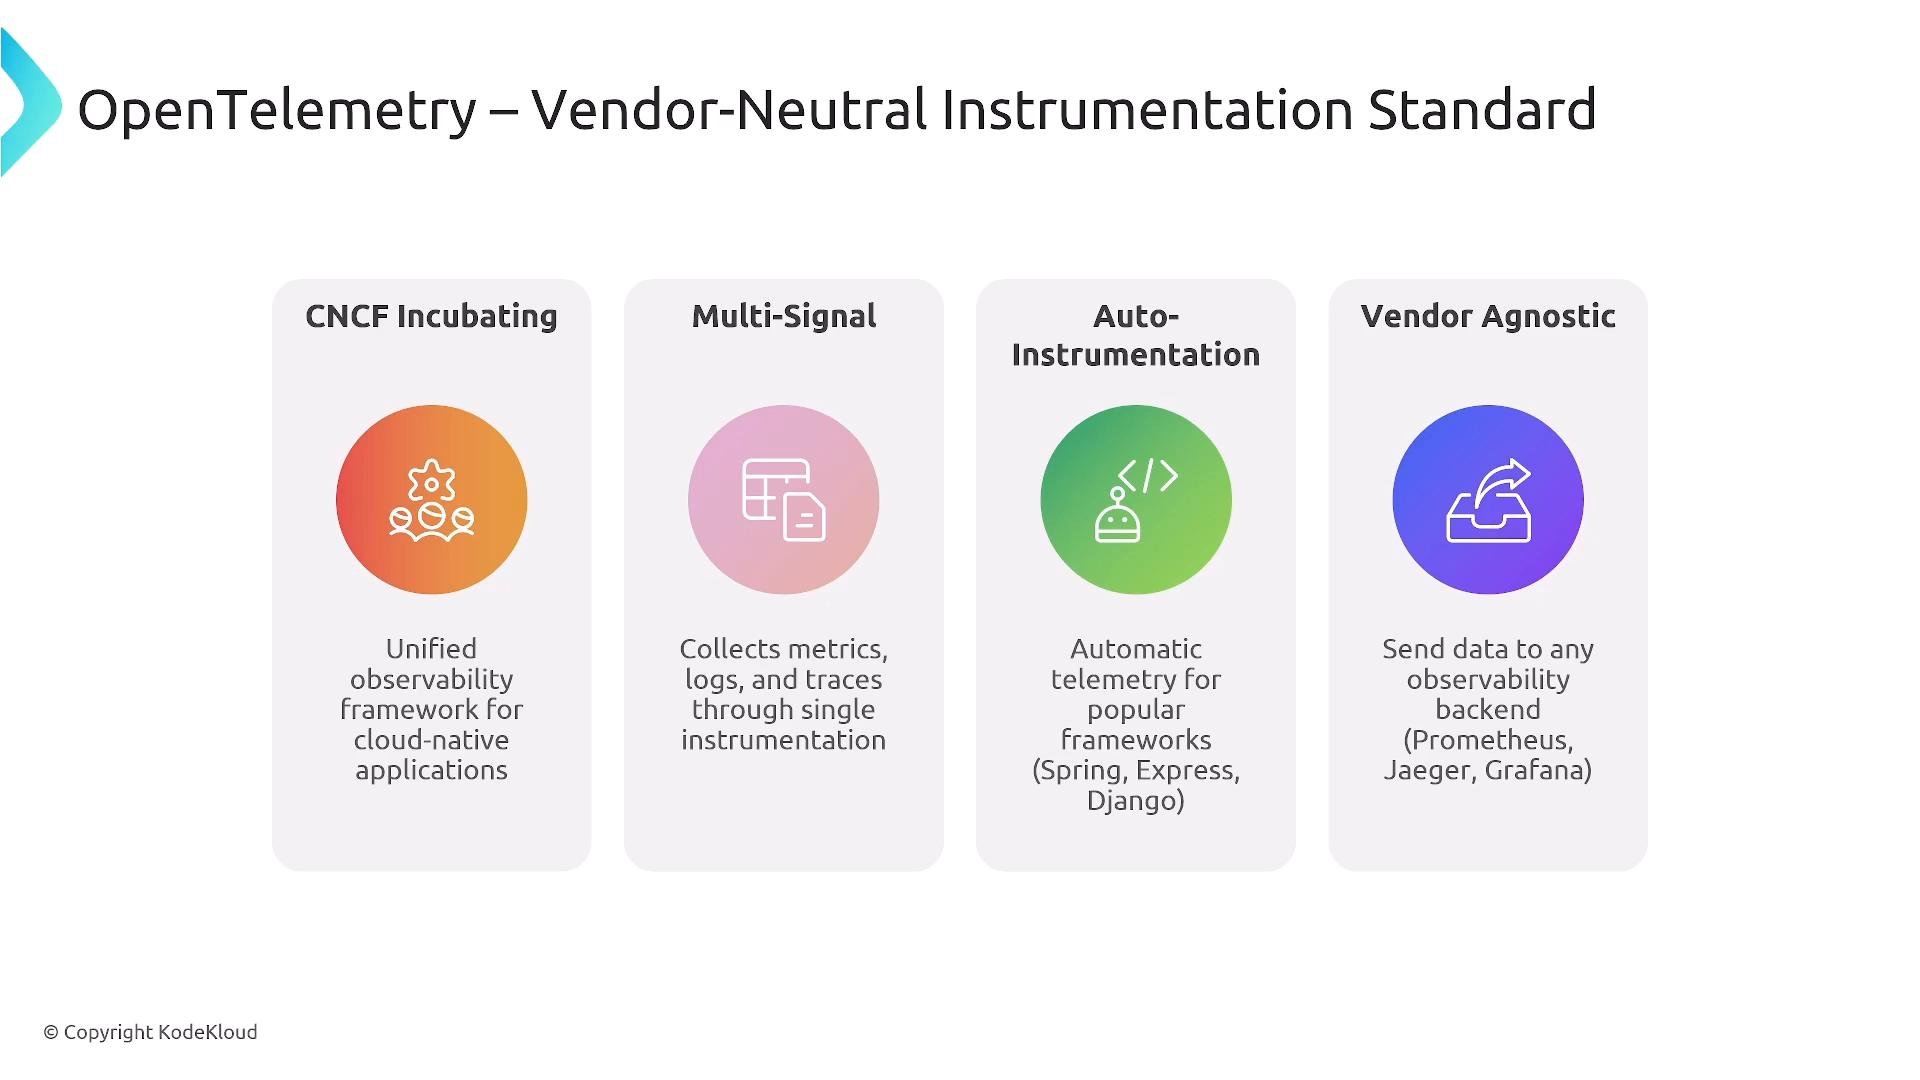
OpenTelemetry enables an “instrument once, export anywhere” model: auto-instrumentation and collectors let platform teams provide telemetry automatically while keeping the backend flexible.
Metrics: Prometheus and the metrics ecosystem
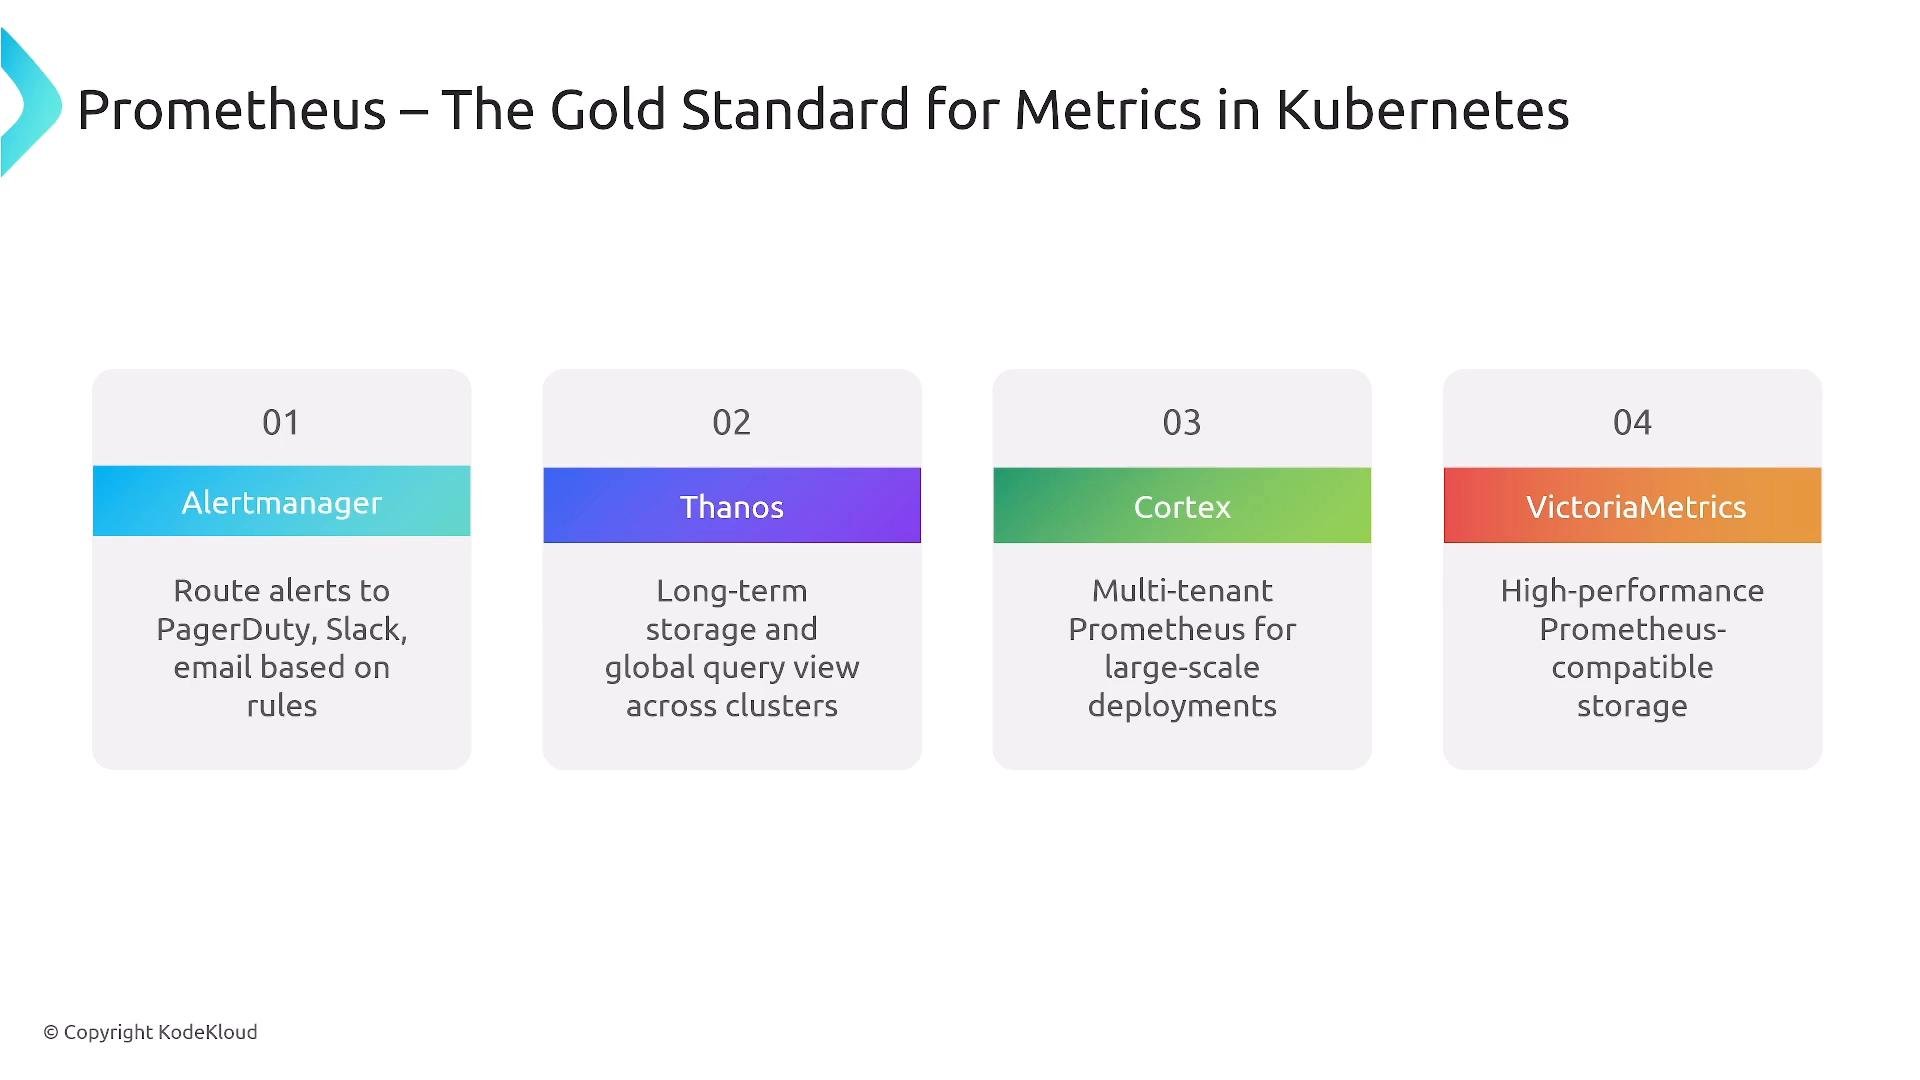
Prometheus is the de facto metrics system in Kubernetes ecosystems. Prometheus primarily uses a pull model (with Pushgateway for short-lived jobs), scrapes targets discovered by service discovery, stores time-series data, and exposes PromQL for powerful queries. For scaling and long-term storage look at projects such as Thanos and Cortex. VictoriaMetrics is another performant storage option. Key endpoints and integrations:- Alerts: Alertmanager
- Long-term/global queries: Thanos
- Multi-tenant/large scale: Cortex
Visualization: Grafana
Grafana is the common choice for dashboards and visualization. It integrates with many backends (Prometheus, Loki, Elasticsearch/OpenSearch, commercial providers), supports rich visualizations (time series, heatmaps, tables), and offers unified alerting and team/permission management. Grafana is widely used across cloud-native environments even though it is not part of CNCF.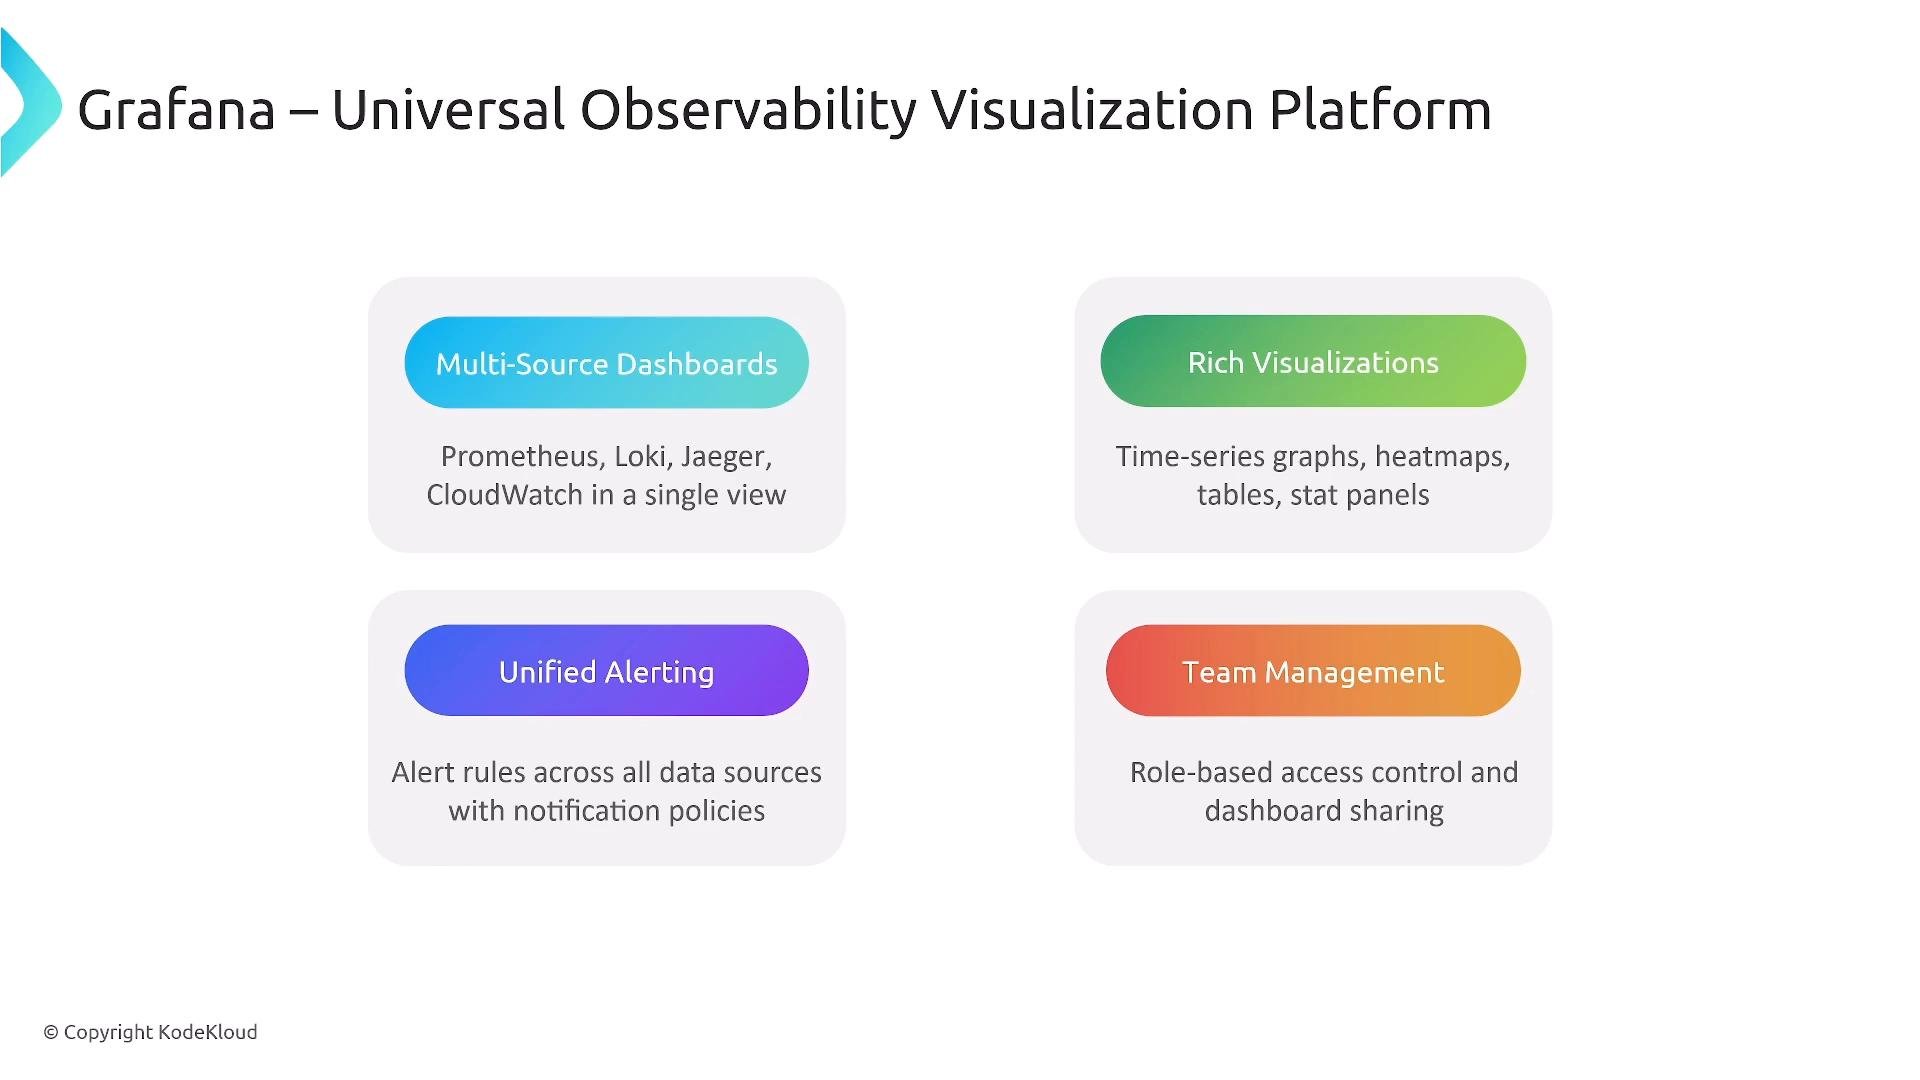
Logging: ELK/EFK, Fluentd/Fluent Bit, Loki, OpenSearch
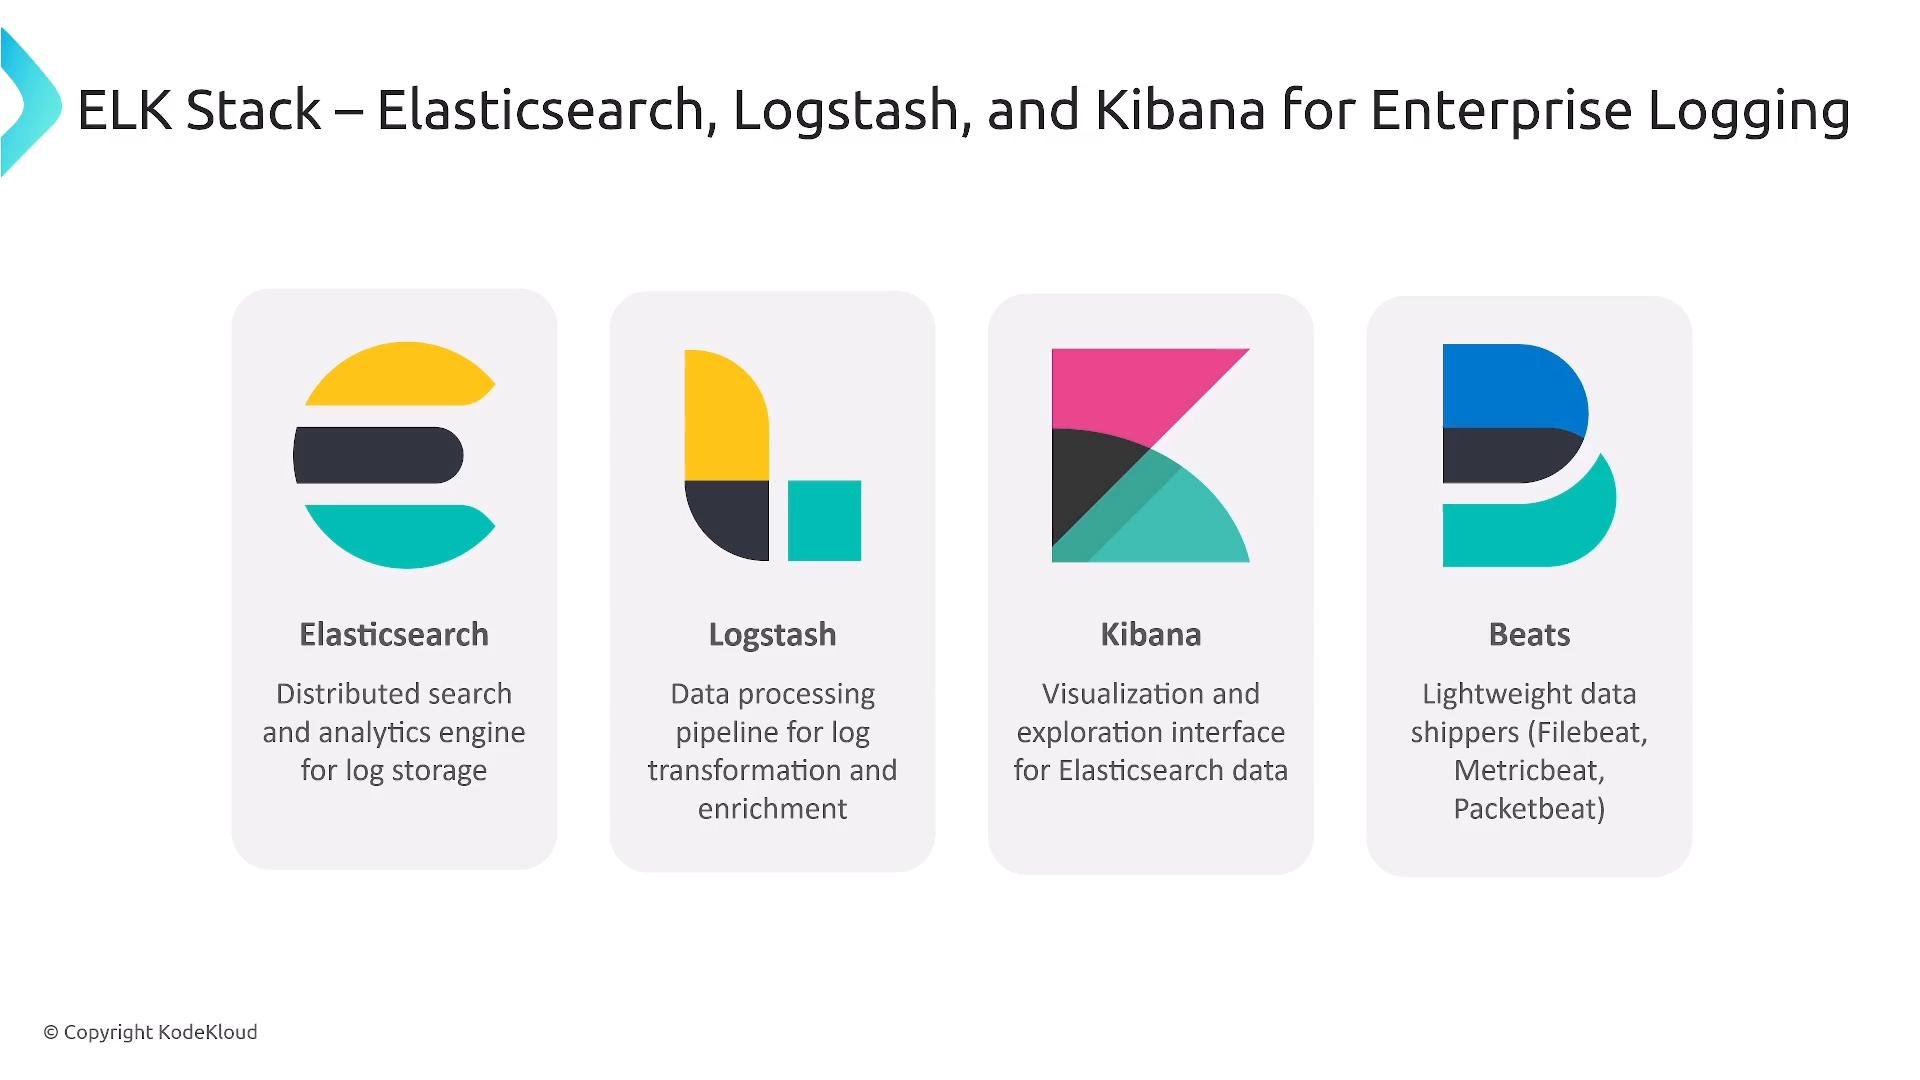
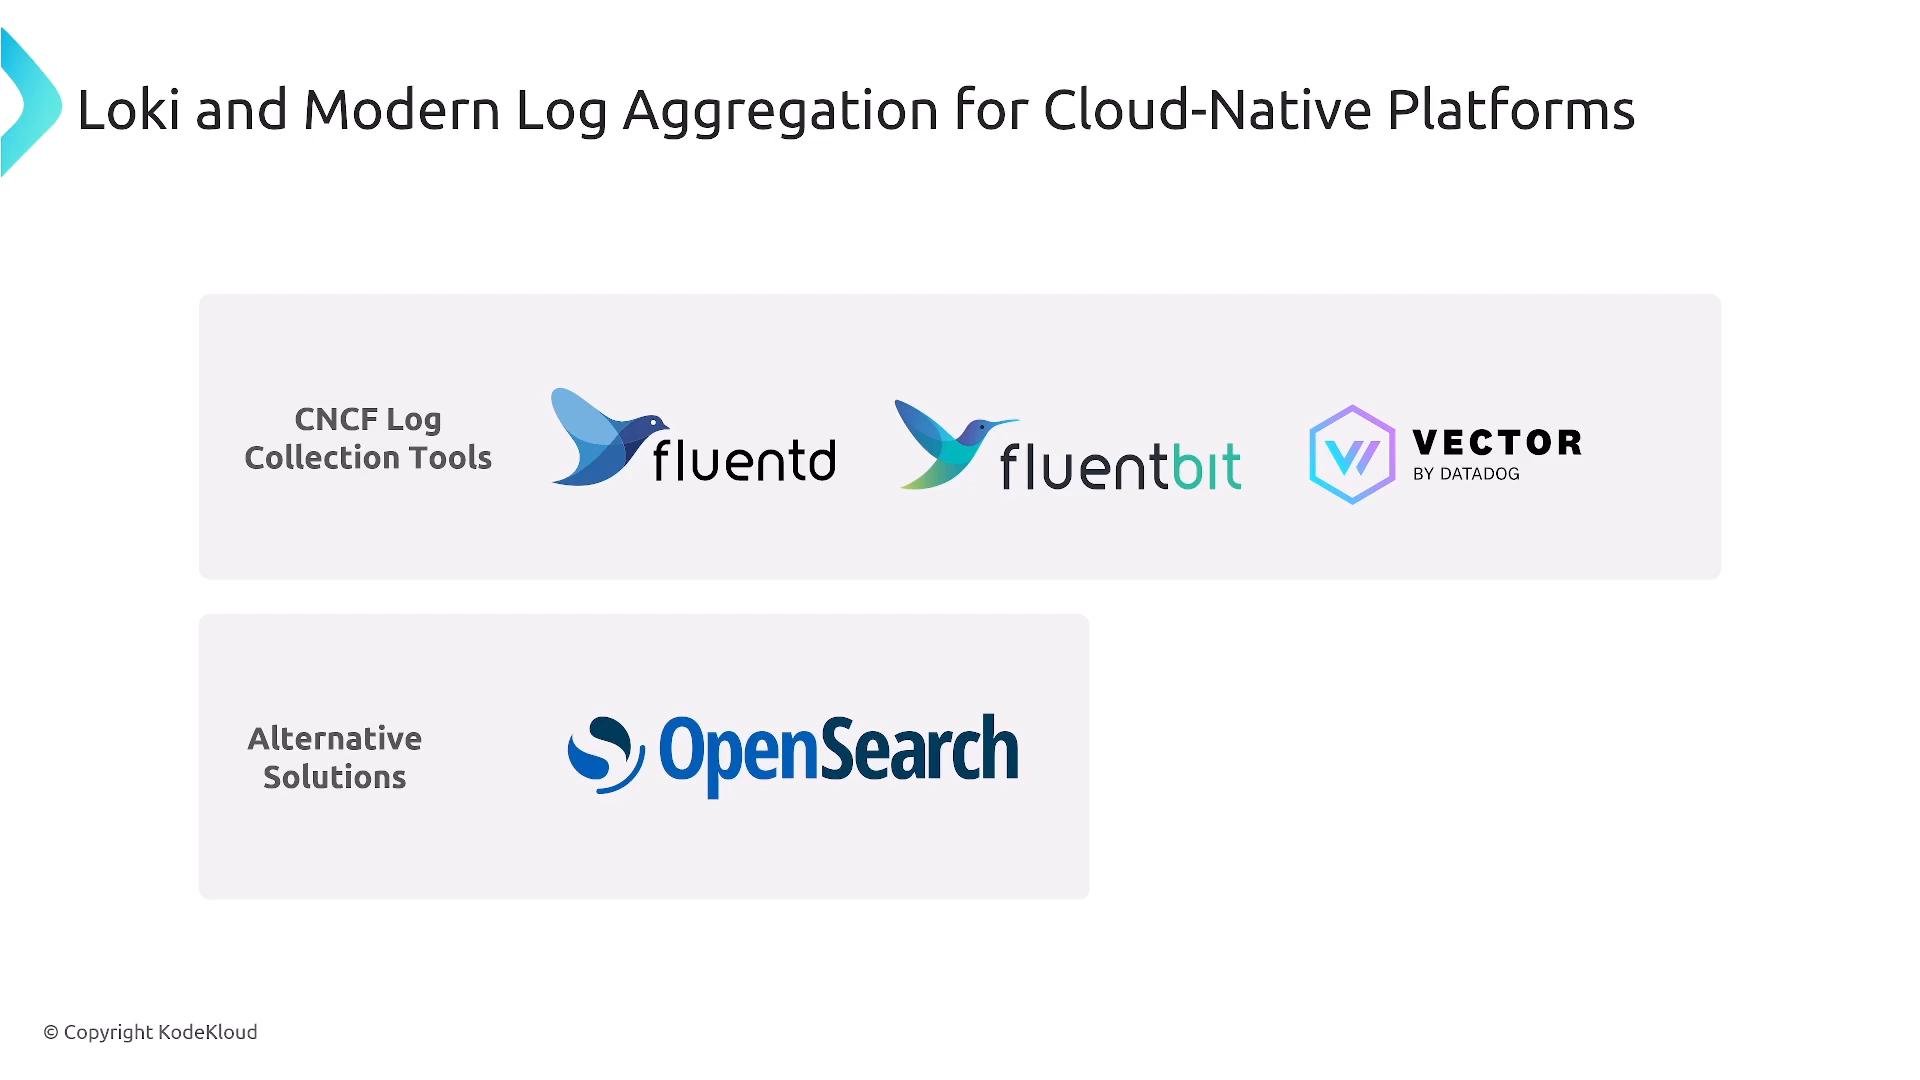
For logs, many platforms use the Elastic Stack (Elasticsearch, Logstash, Kibana — ELK; EFK when Filebeat/Beats is used). Logstash processes and ships logs into Elasticsearch and Kibana provides visualization. Beats are lightweight shippers. Alternatives and collectors:- Fluentd / Fluent Bit (CNCF projects)
- Vector (high-performance router)
- OpenTelemetry Collector (centralized telemetry routing)
- Storage/search:
ElasticsearchorOpenSearch(community-driven fork)
Tracing: Jaeger, Zipkin, and APM
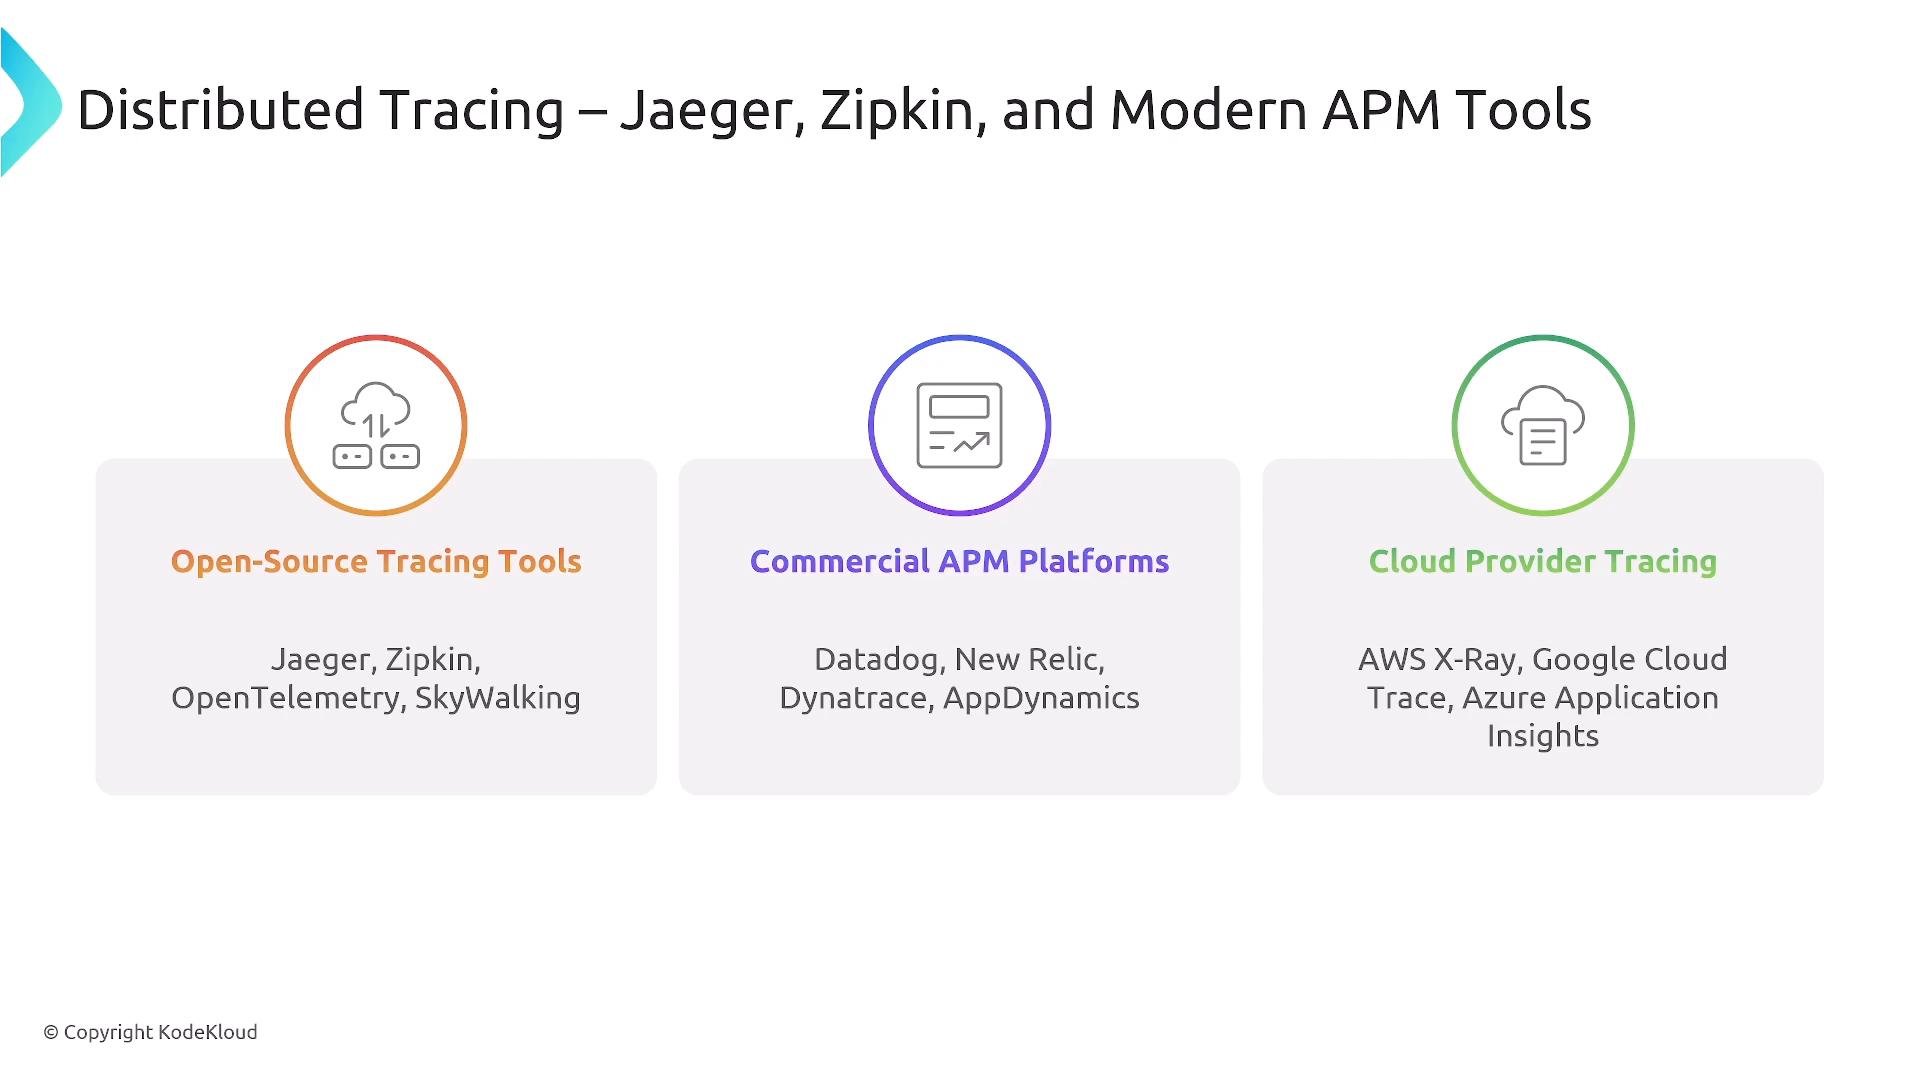
Distributed tracing helps answer “where is latency happening?” Common choices:- Open-source:
Jaeger,Zipkin, instrumented viaOpenTelemetry - Commercial APMs: Datadog, New Relic, Dynatrace, AppDynamics
- Cloud-provider tracing: AWS X‑Ray, Google Cloud Trace, Azure Application Insights
Commercial and cloud offerings
Commercial APMs and observability platforms bundle metrics, traces, and logs with analytics, incident integrations, and advanced UIs. Examples: Datadog, New Relic, Dynatrace, Splunk, Honeycomb, LightStep. Cloud-managed offerings (AWS, GCP, Azure) integrate tightly with their ecosystems and are attractive for teams committed to a single cloud provider.eBPF and kernel-level observability
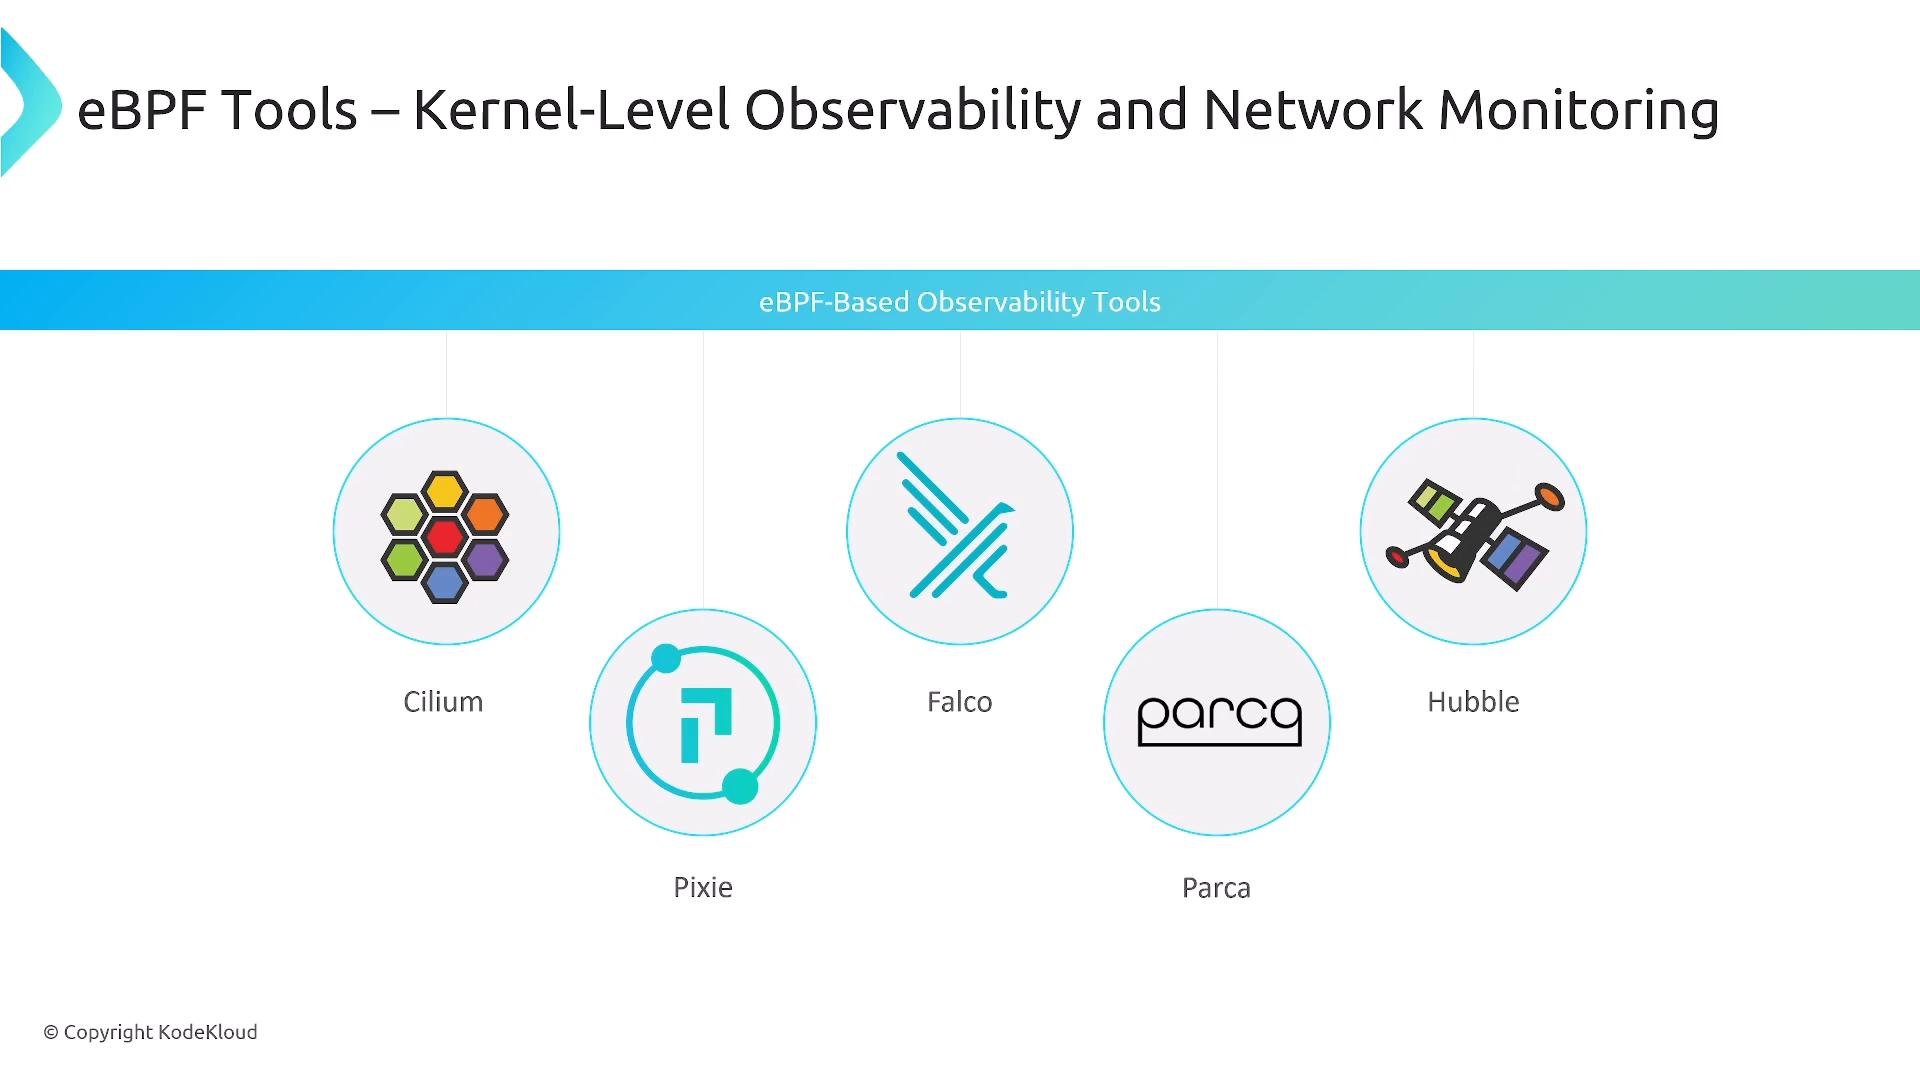
eBPF enables low-overhead kernel instrumentation for networking, tracing, and security. It powers solutions that provide deep visibility without modifying application code. Notable projects and capabilities:- Cilium (CNI + network observability + Hubble)
- Falco (runtime security)
- Parca (continuous profiling)
- Pixie (agentless eBPF-based observability; licensing/status may vary)
Plan for cost and data lifecycle: long retention windows, high-cardinality metrics, and full-text log storage can increase operational cost. Use downsampling, aggregation, and retention policies (e.g., Thanos/VictoriaMetrics retention tiers) to balance observability needs and budget.
SRE, profiling, and user monitoring
- eBPF is highly valued by SREs and platform engineers for lightweight, deep visibility into production systems.
- Continuous profiling tools (Parca, Pyroscope) reveal CPU/memory/latency hotspots over time.
- RUM (Real User Monitoring) and client-side telemetry help understand user journeys and geographic latency.
Putting the pieces together (platform integration)
A well-designed platform ingests telemetry from multiple sources, correlates across signals, and presents unified dashboards and alerts. Common stack combinations: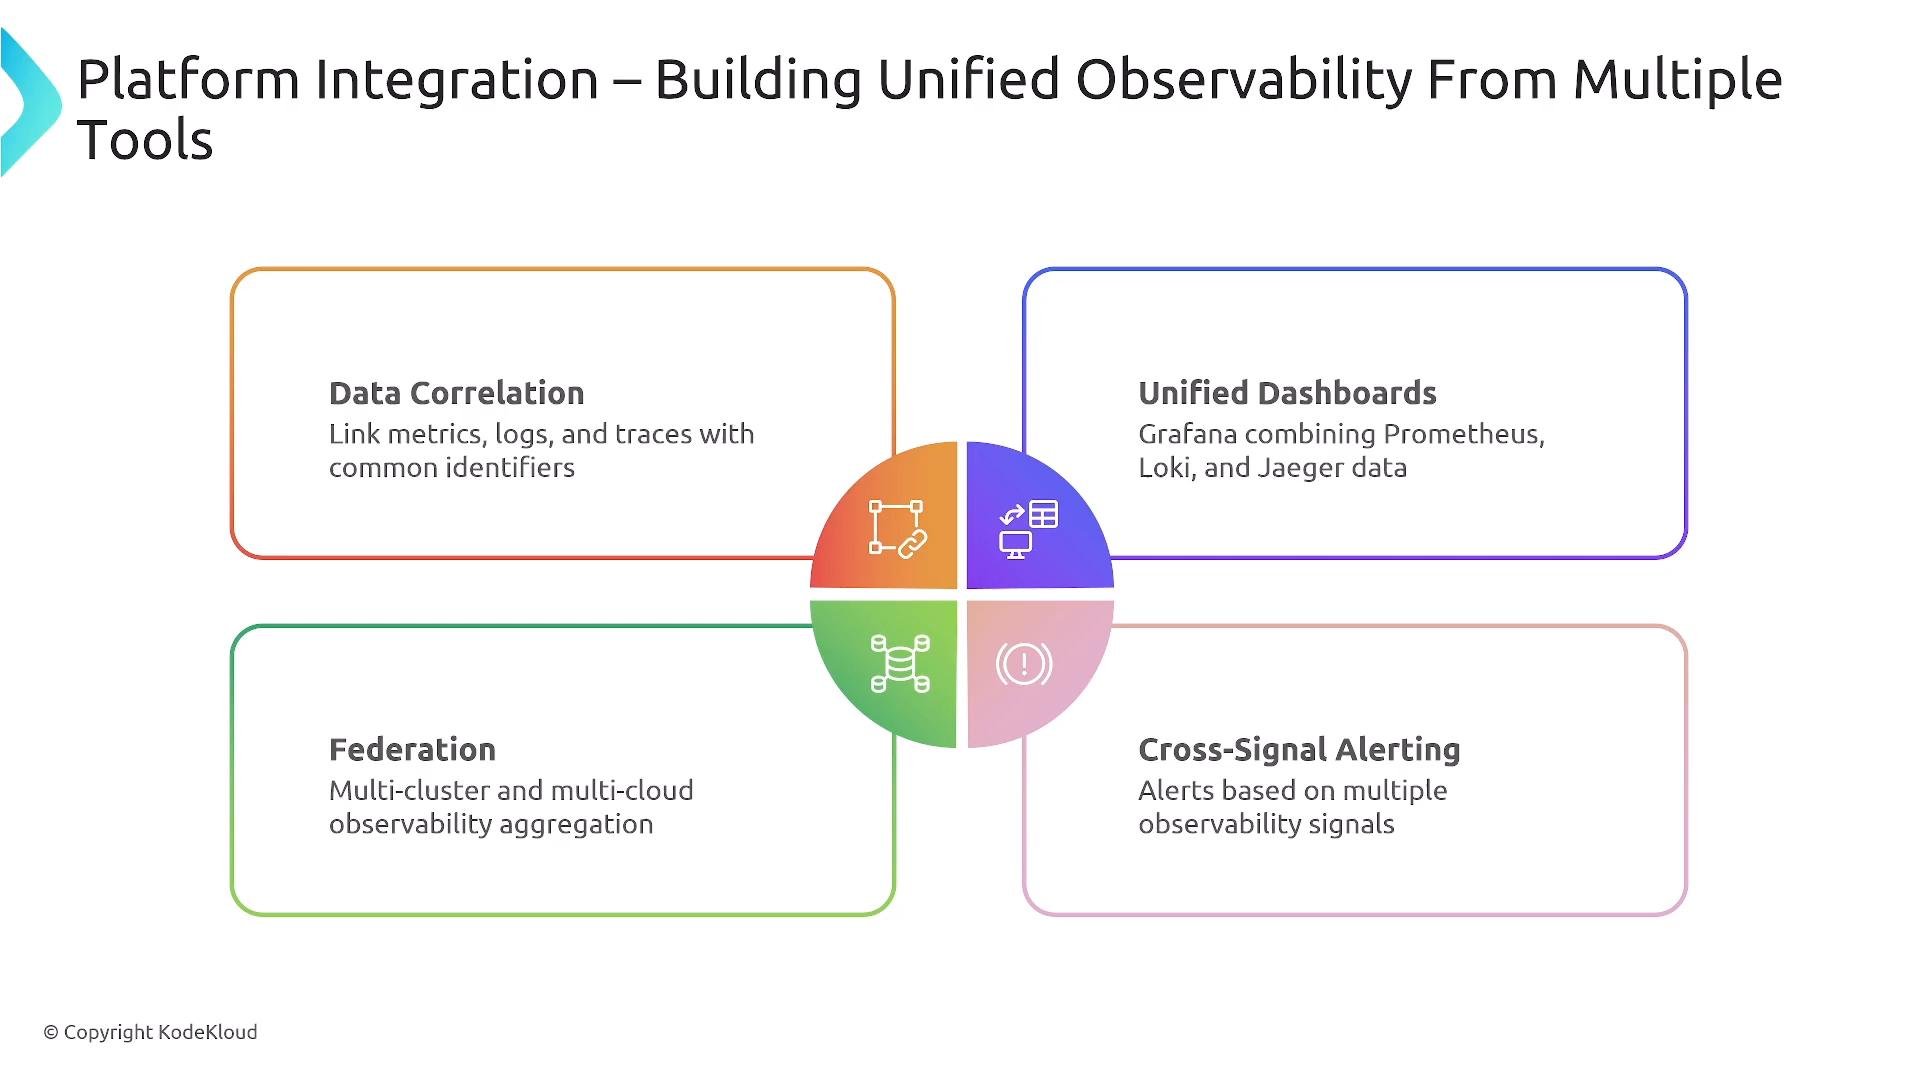
Choosing a tooling approach
Typical approaches (trade-offs summarized):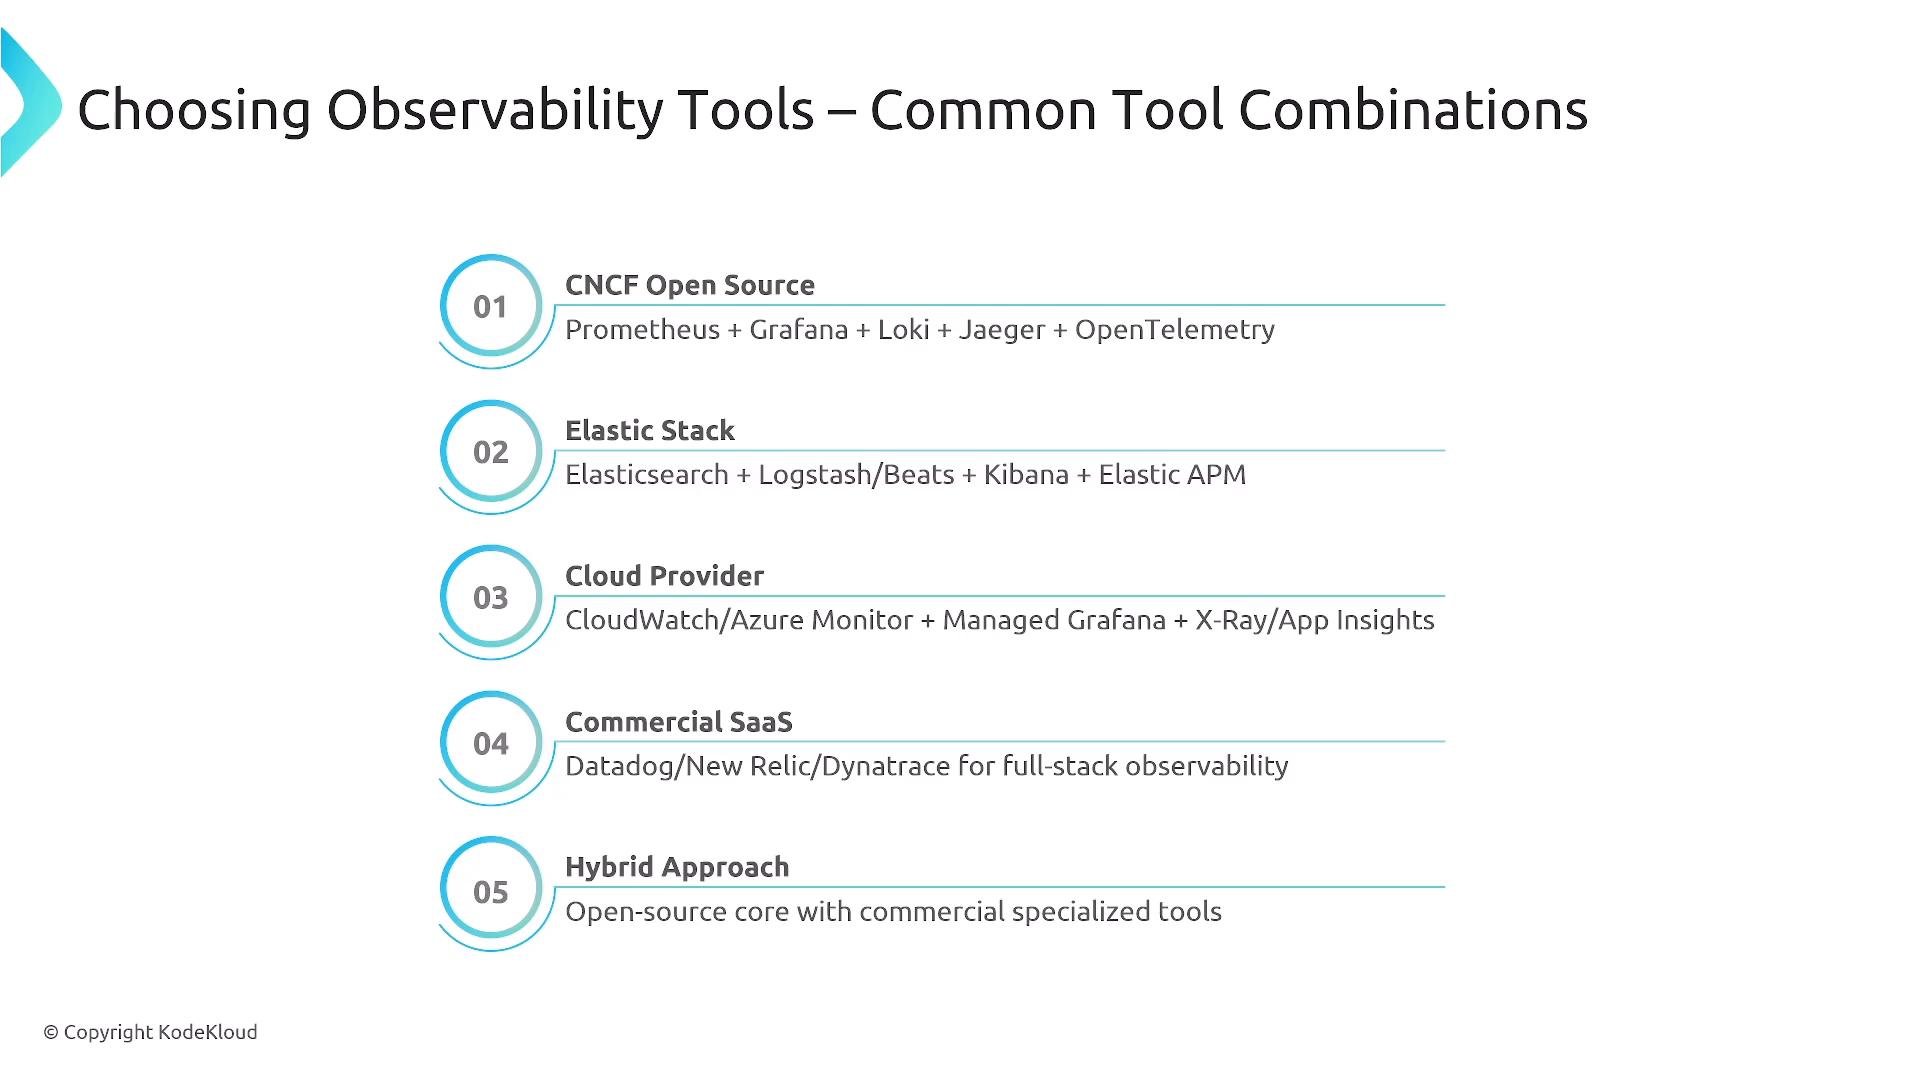
- Scale and multi-tenancy requirements
- Cost and retention policies
- Team skills and operational overhead
- Need for full-text search vs label-indexed logs
- Desire to avoid vendor lock-in (favor OTel + open components)
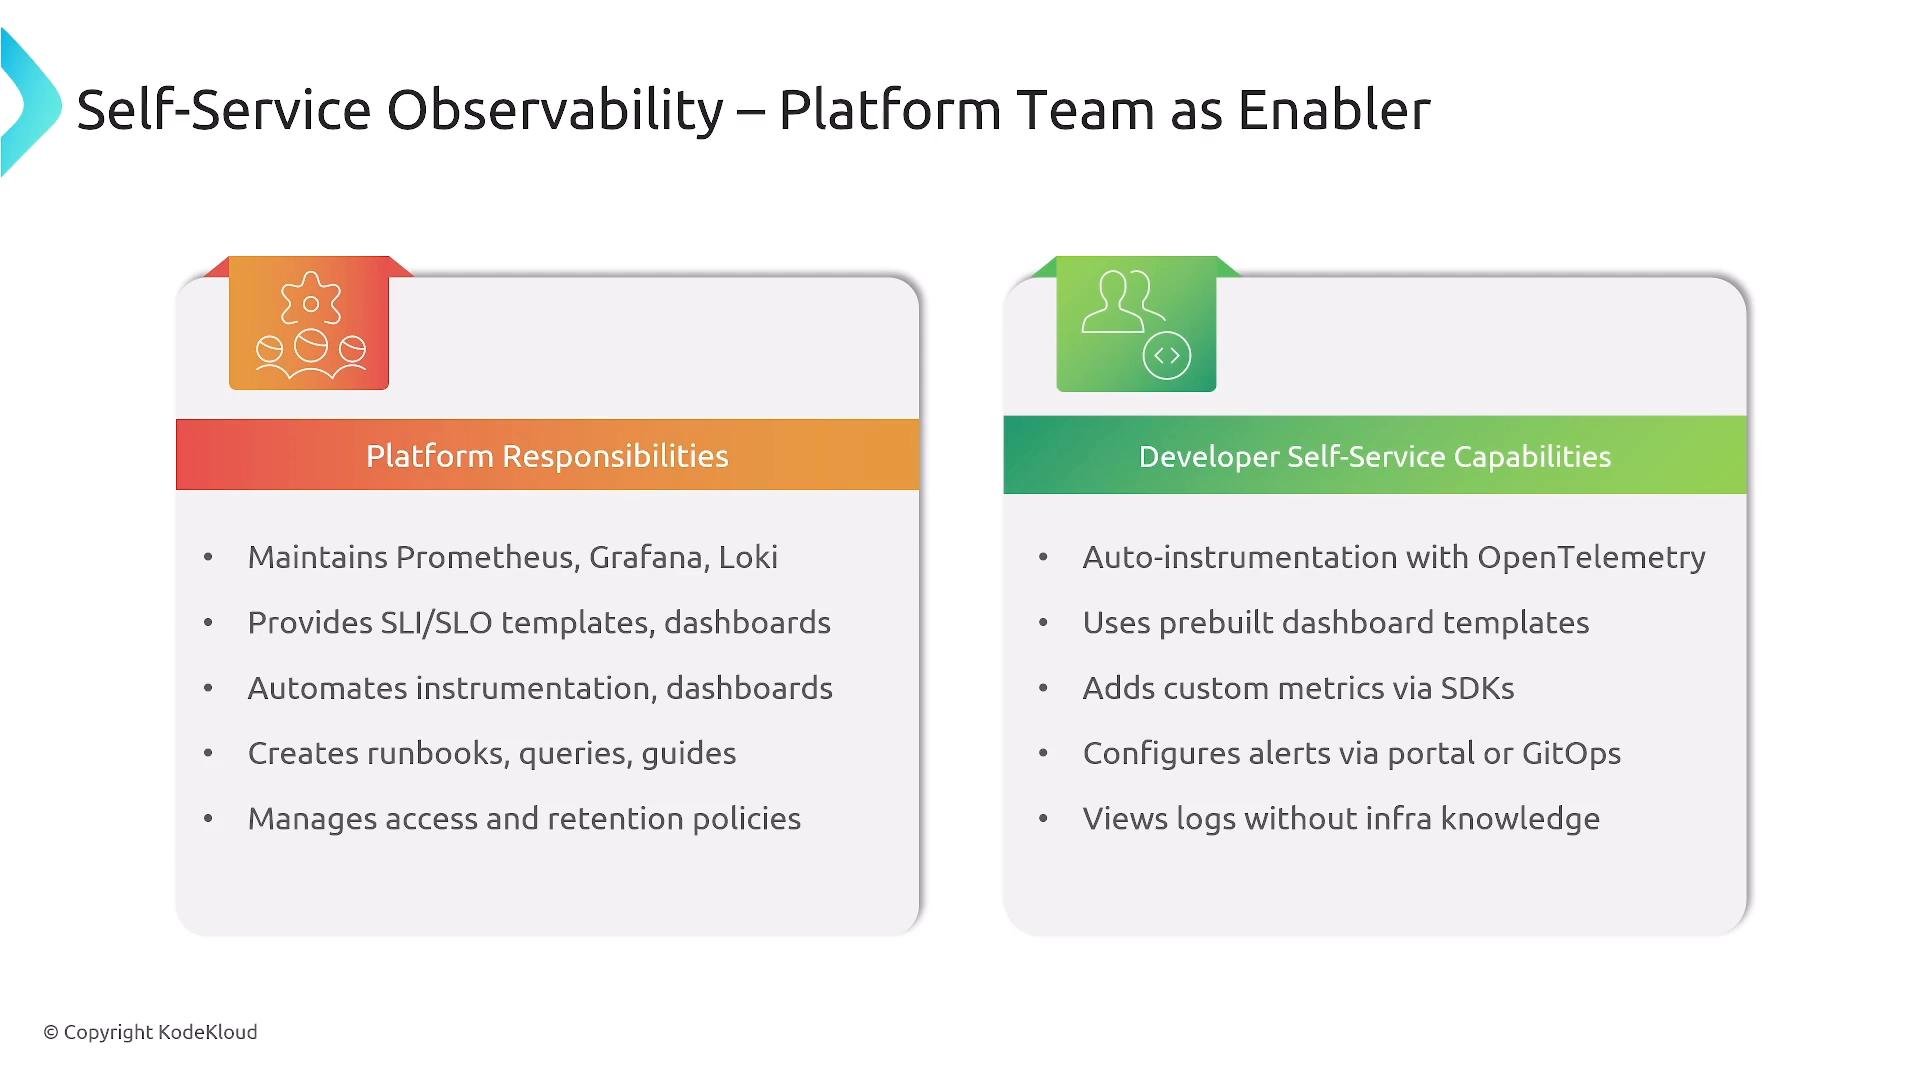
Self-service observability: platform responsibilities vs developer capabilities
Platform engineering enables developer self-service so teams can observe and operate their services independently. Platform responsibilities:- Run and maintain core services (Prometheus, Grafana, Loki, Jaeger, OTel Collector)
- Provide SLI/SLO templates, runbooks, and guardrails
- Manage retention, storage, and secure access controls
- Offer cataloged dashboards, alerting rule templates, and onboarding docs
- Auto-instrumentation (OpenTelemetry agents and SDKs)
- Access to prebuilt dashboards and templates
- Ability to define custom metrics and alerts via UI or GitOps (
YAML/JSON) without platform team intervention - Log views and trace exploration in self-service dashboards
Key takeaways
- OpenTelemetry, Prometheus, Grafana, Loki, and Jaeger are core components in most cloud-native observability platforms and are essential to platform engineering knowledge.
- Use collectors and shippers (Fluentd, Fluent Bit, Vector, OpenTelemetry Collector) to centralize telemetry and route it to appropriate storage backends.
- Choose storage and analytics components (Elasticsearch/OpenSearch, VictoriaMetrics, Thanos, Cortex) based on scale, multi-tenancy, and retention needs.
- eBPF (Cilium, Falco, Pixie, Parca) adds kernel-level observability for networking, security, and profiling with low overhead.
- Platform engineering should provide standards, templates (SLIs/SLOs), and self-service tooling so developers can instrument and observe applications with minimal friction.
Links and references
- OpenTelemetry: https://opentelemetry.io/
- Prometheus docs: https://prometheus.io/docs/
- Grafana docs: https://grafana.com/docs/
- Loki docs: https://grafana.com/oss/loki
- Jaeger tracing: https://www.jaegertracing.io/
- eBPF resources: https://ebpf.io/
- Elastic Stack: https://www.elastic.co/
- OpenSearch: https://opensearch.org/