

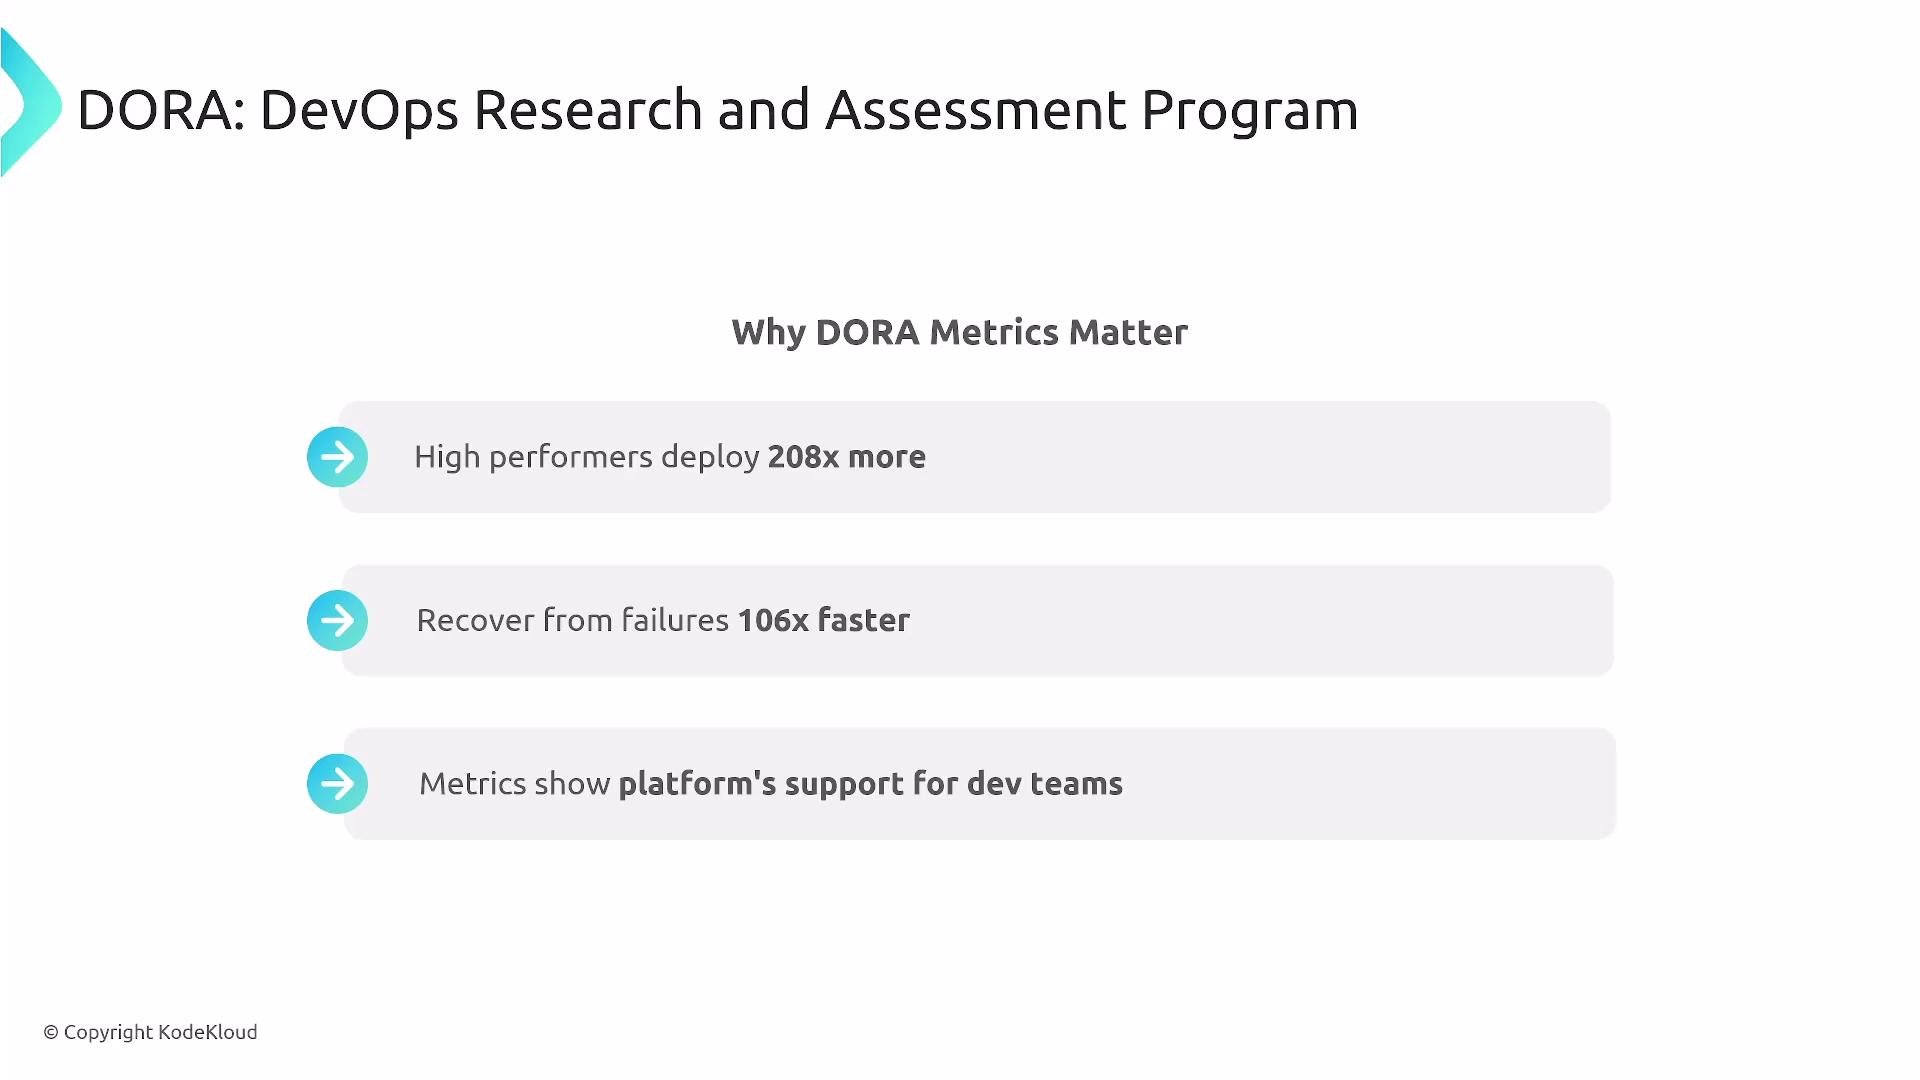
- DORA (DevOps Research and Assessment) defined these metrics and publishes an annual report with research-backed thresholds (since 2018).
- Teams are classified into Elite, High, Medium, or Low performance based on these metrics.
- DORA metrics balance velocity and stability and are a standard way to quantify platform-enableddeveloper performance and production reliability.
- Deployment Frequency (velocity)
- Lead Time for Changes (commit → production latency; velocity)
- Change Failure Rate (stability / quality)
- Mean Time to Recovery (MTTR; stability)
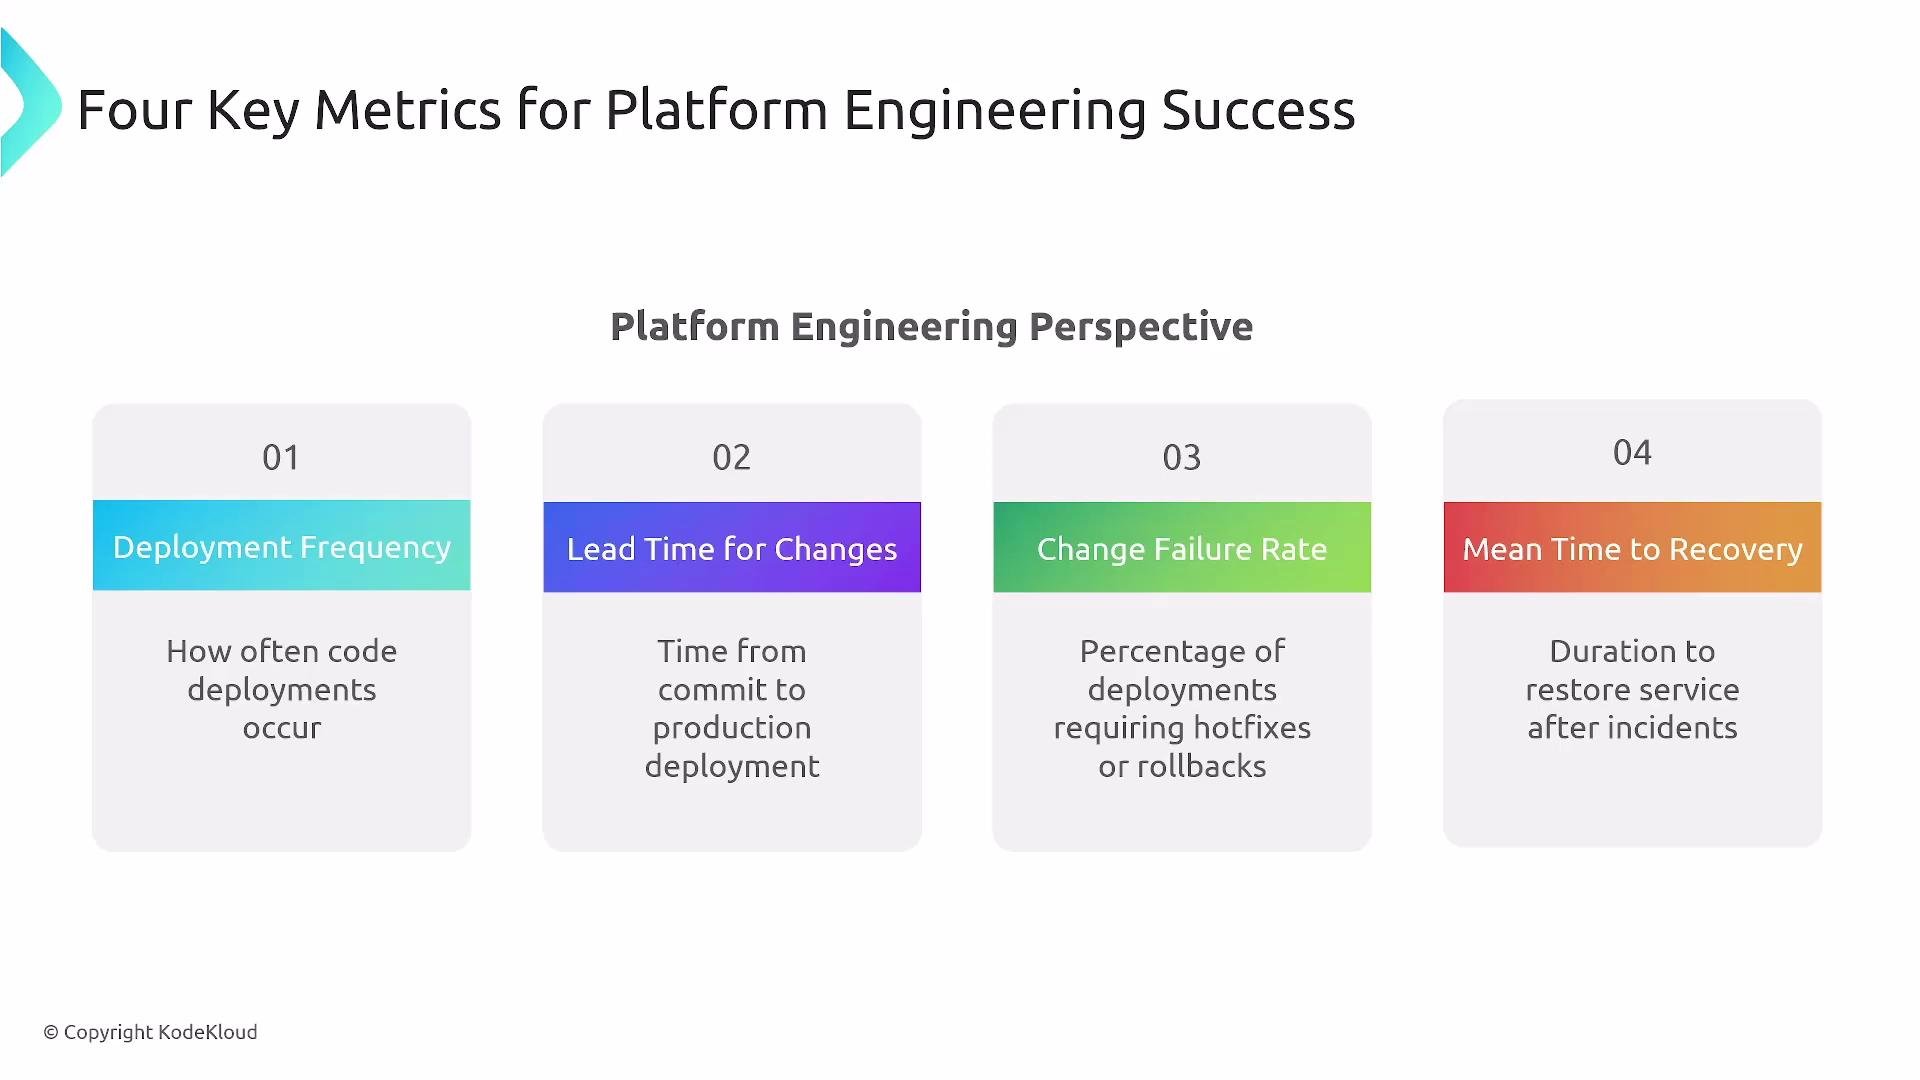
Memorize the four DORA metrics and their intent for certification: they quantify platform-enabled developer performance and production stability.
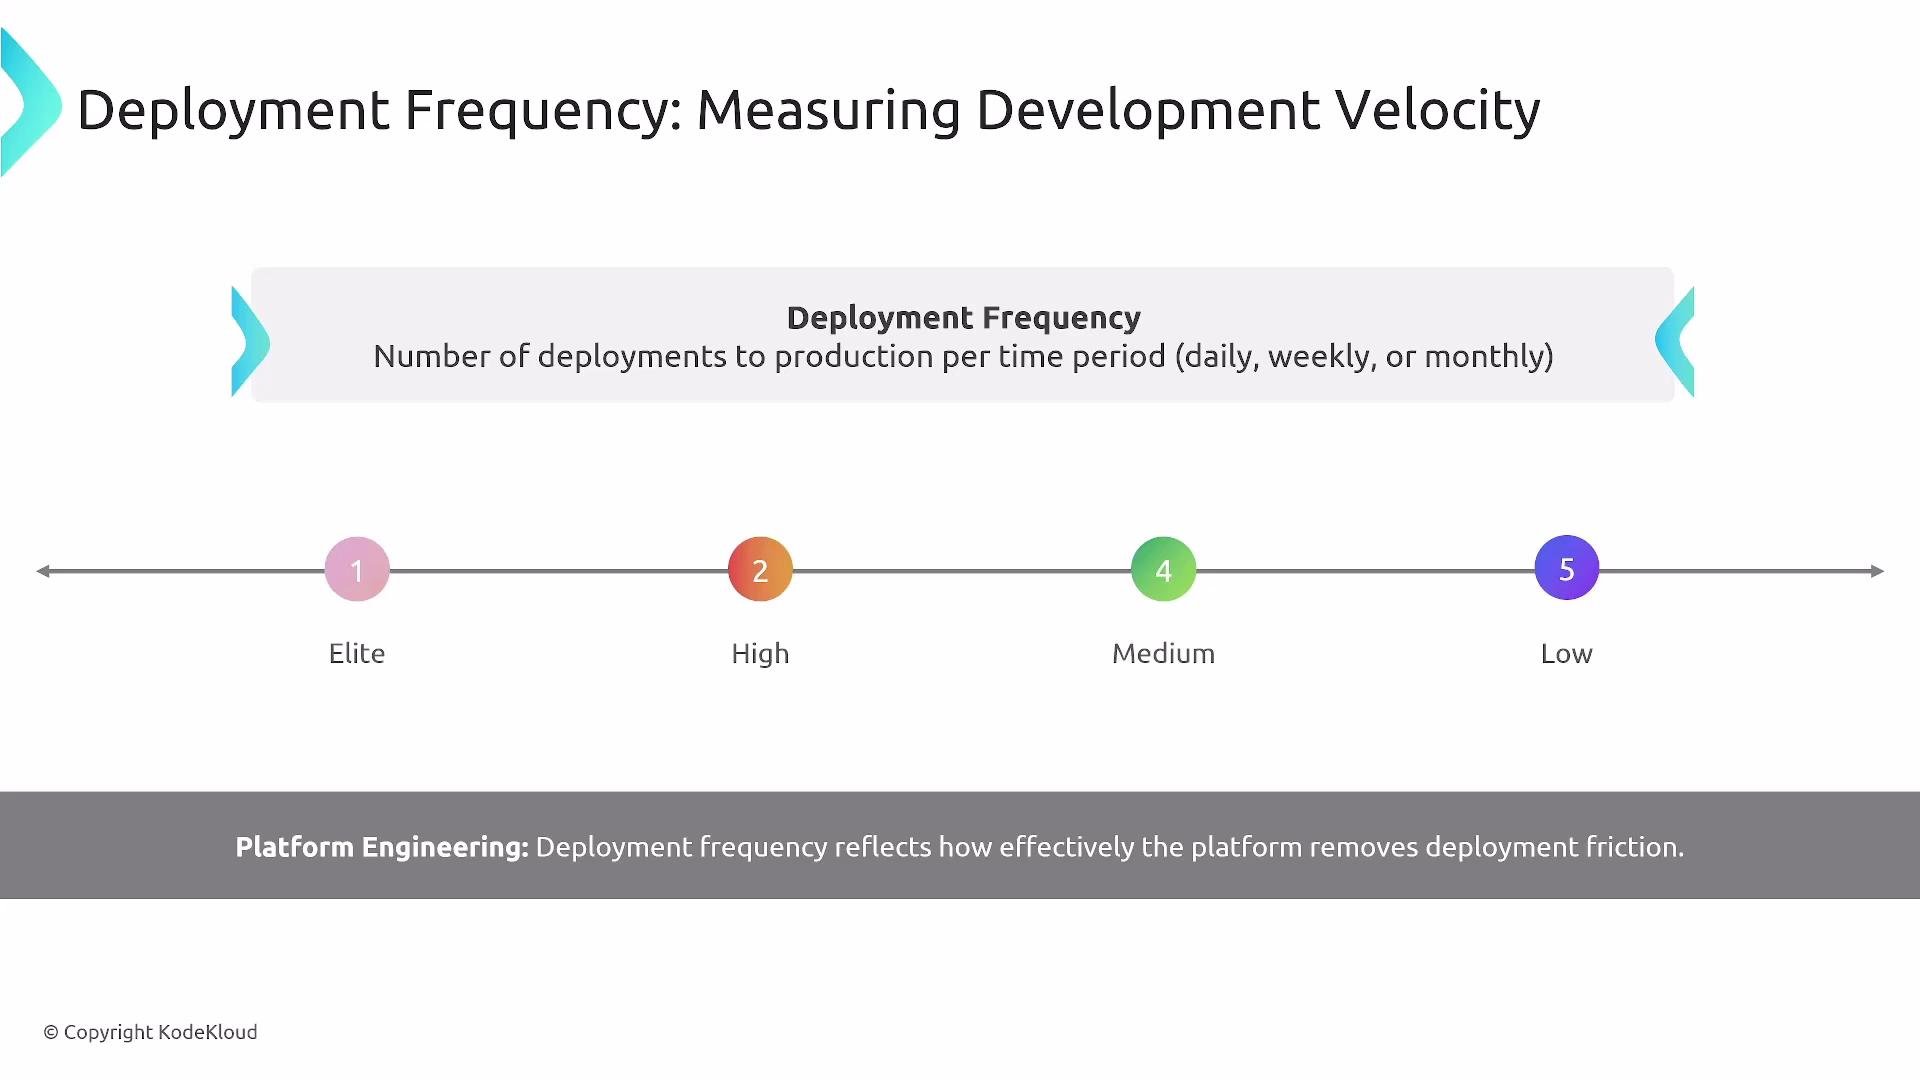
- What it measures: how often your team deploys to production — a direct indicator of platform friction or enablement.
- Typical thresholds:
- Elite: multiple deploys per day
- High: daily to weekly
- Medium: weekly to monthly
- Low: monthly to once every several months
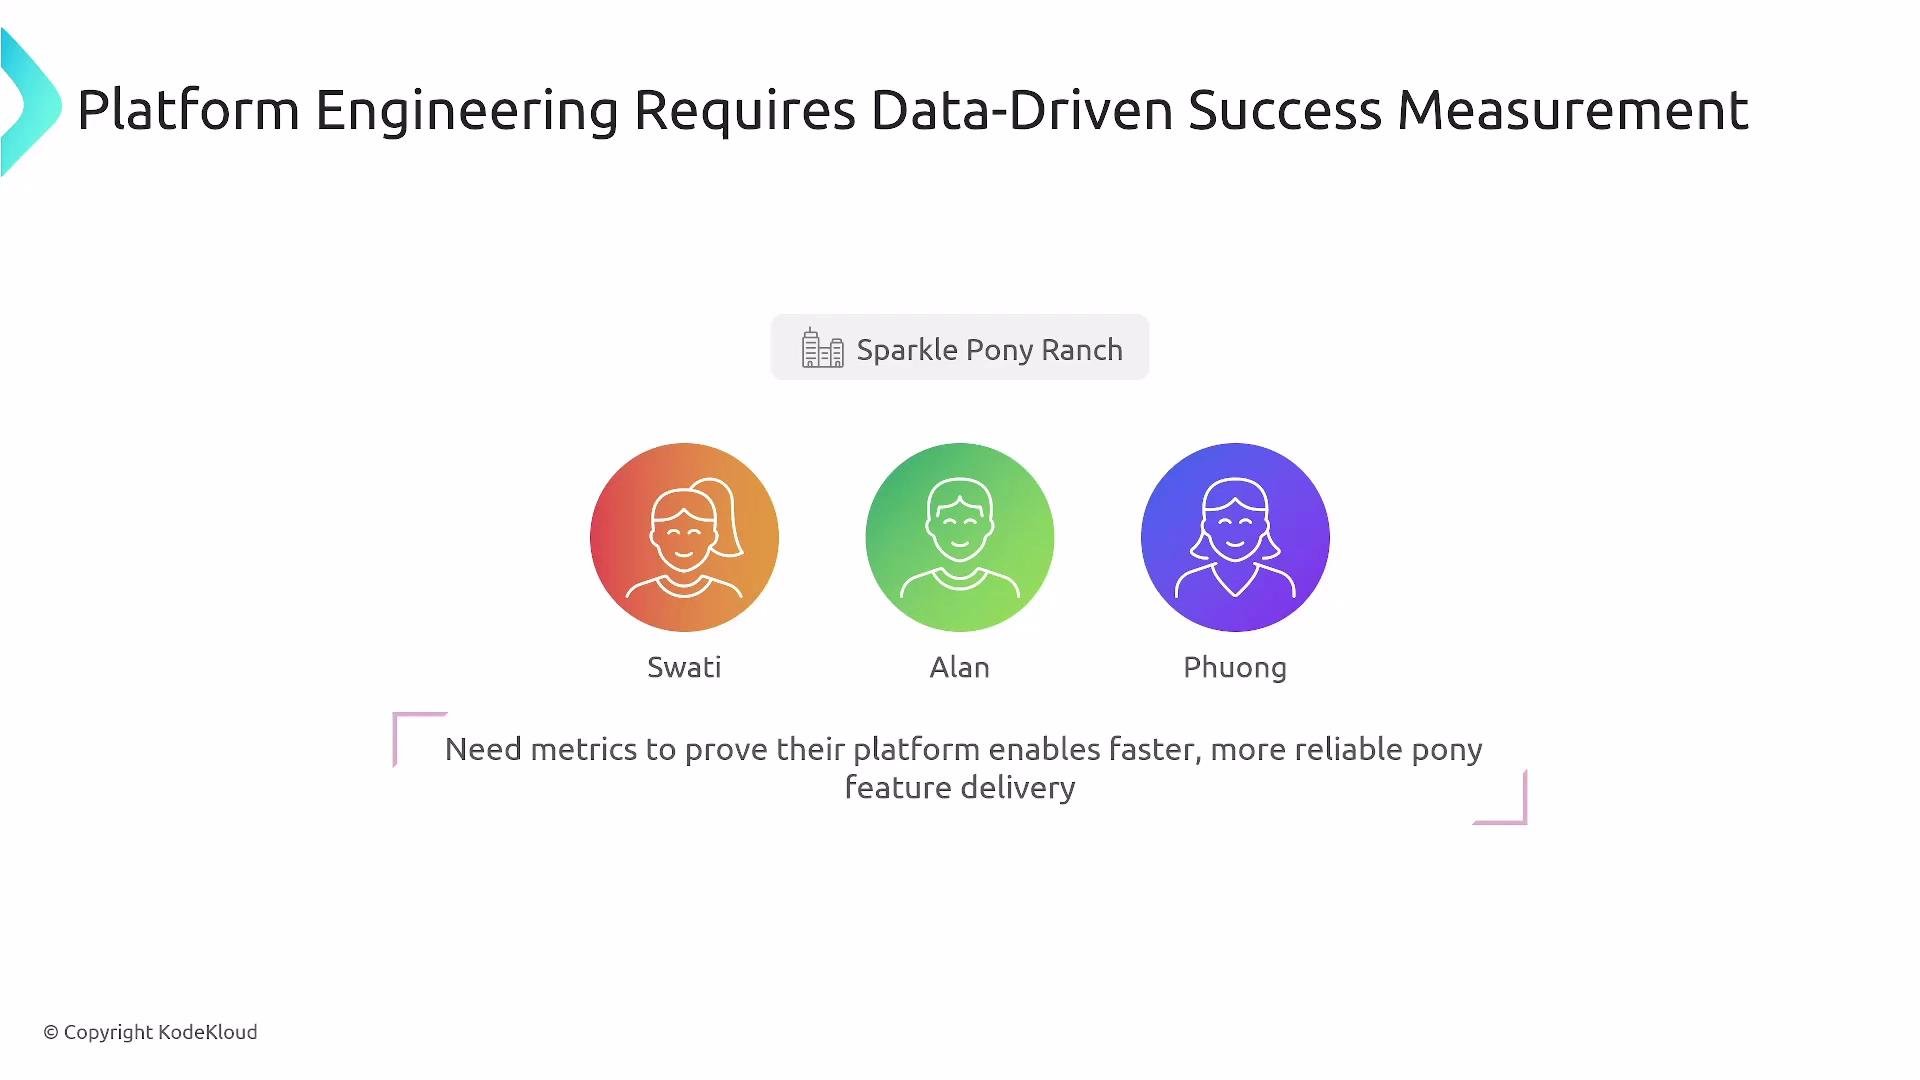
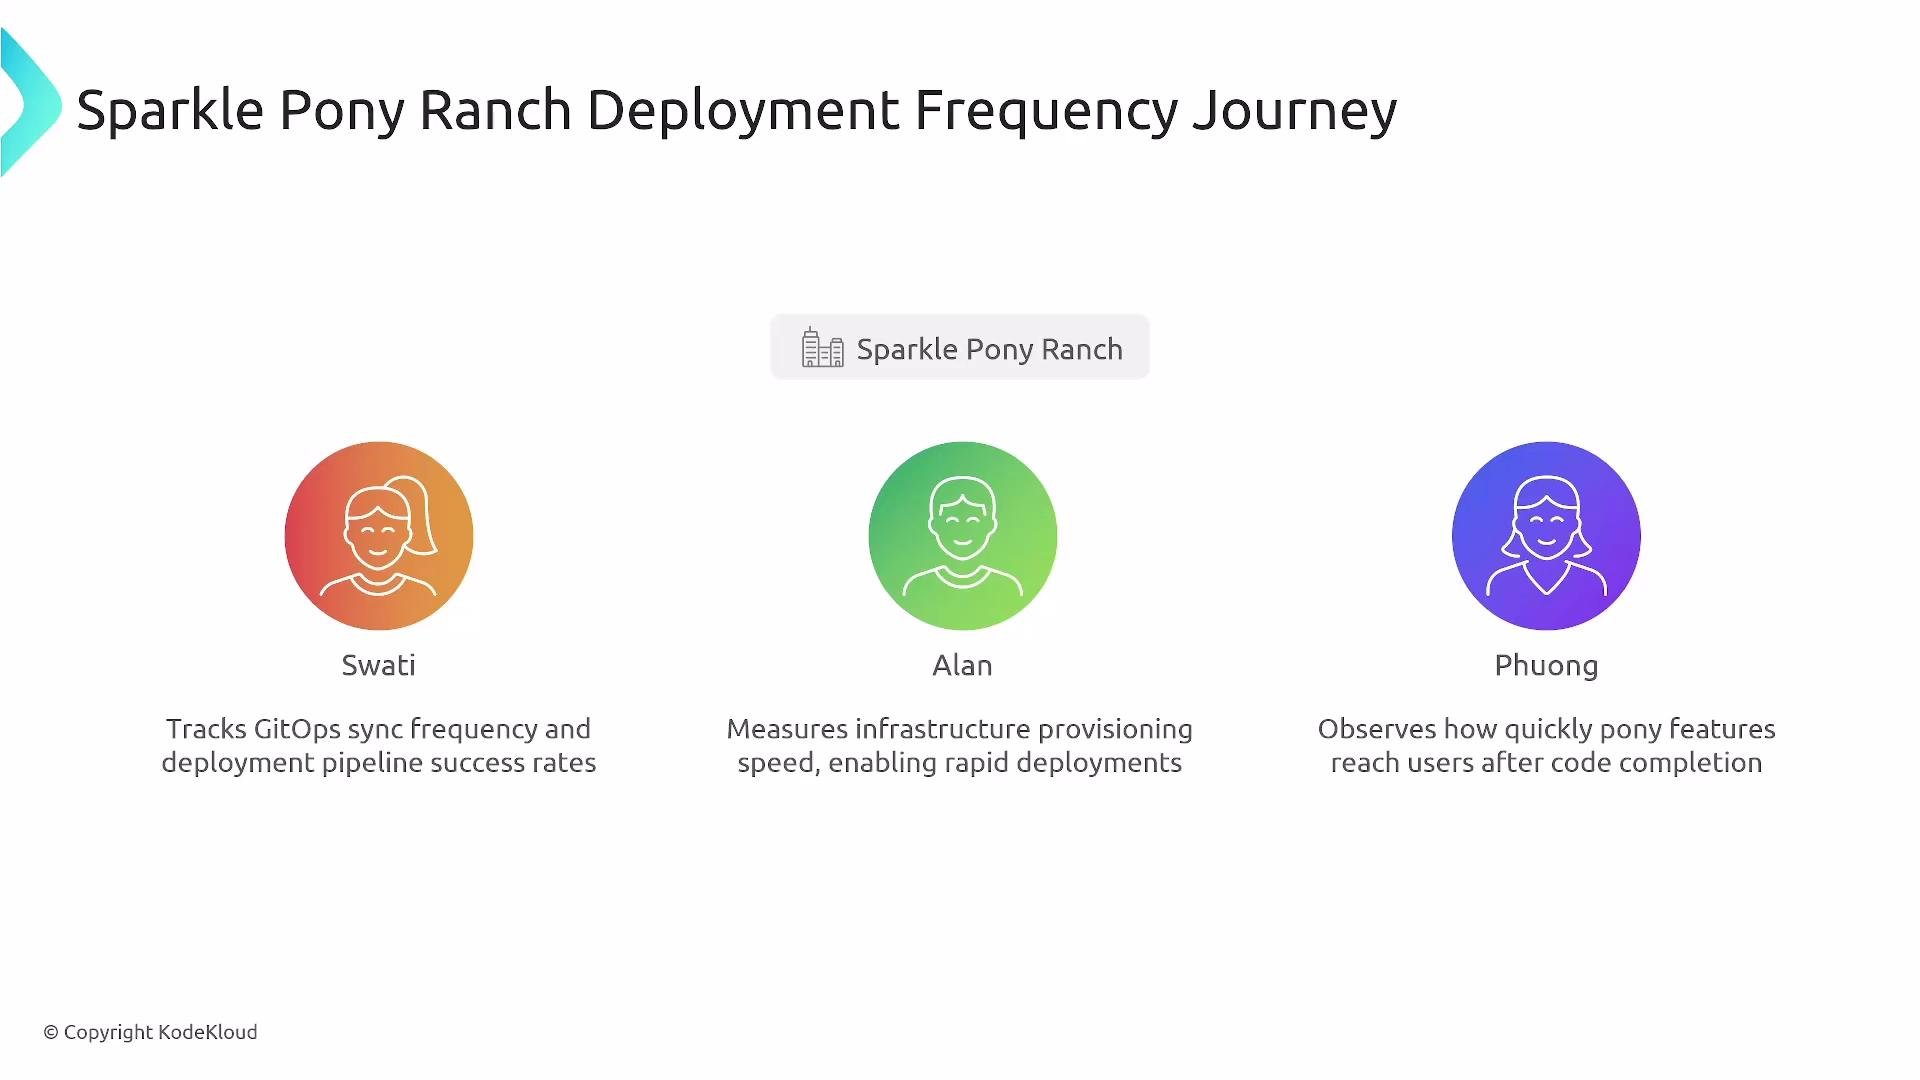
- Swati (platform/pipeline owner): pipeline health and deployment reliability
- Alan (infrastructure): provisioning speed and infra bottlenecks
- Phuong (developer advocate / product-facing): time for platform features to reach developers
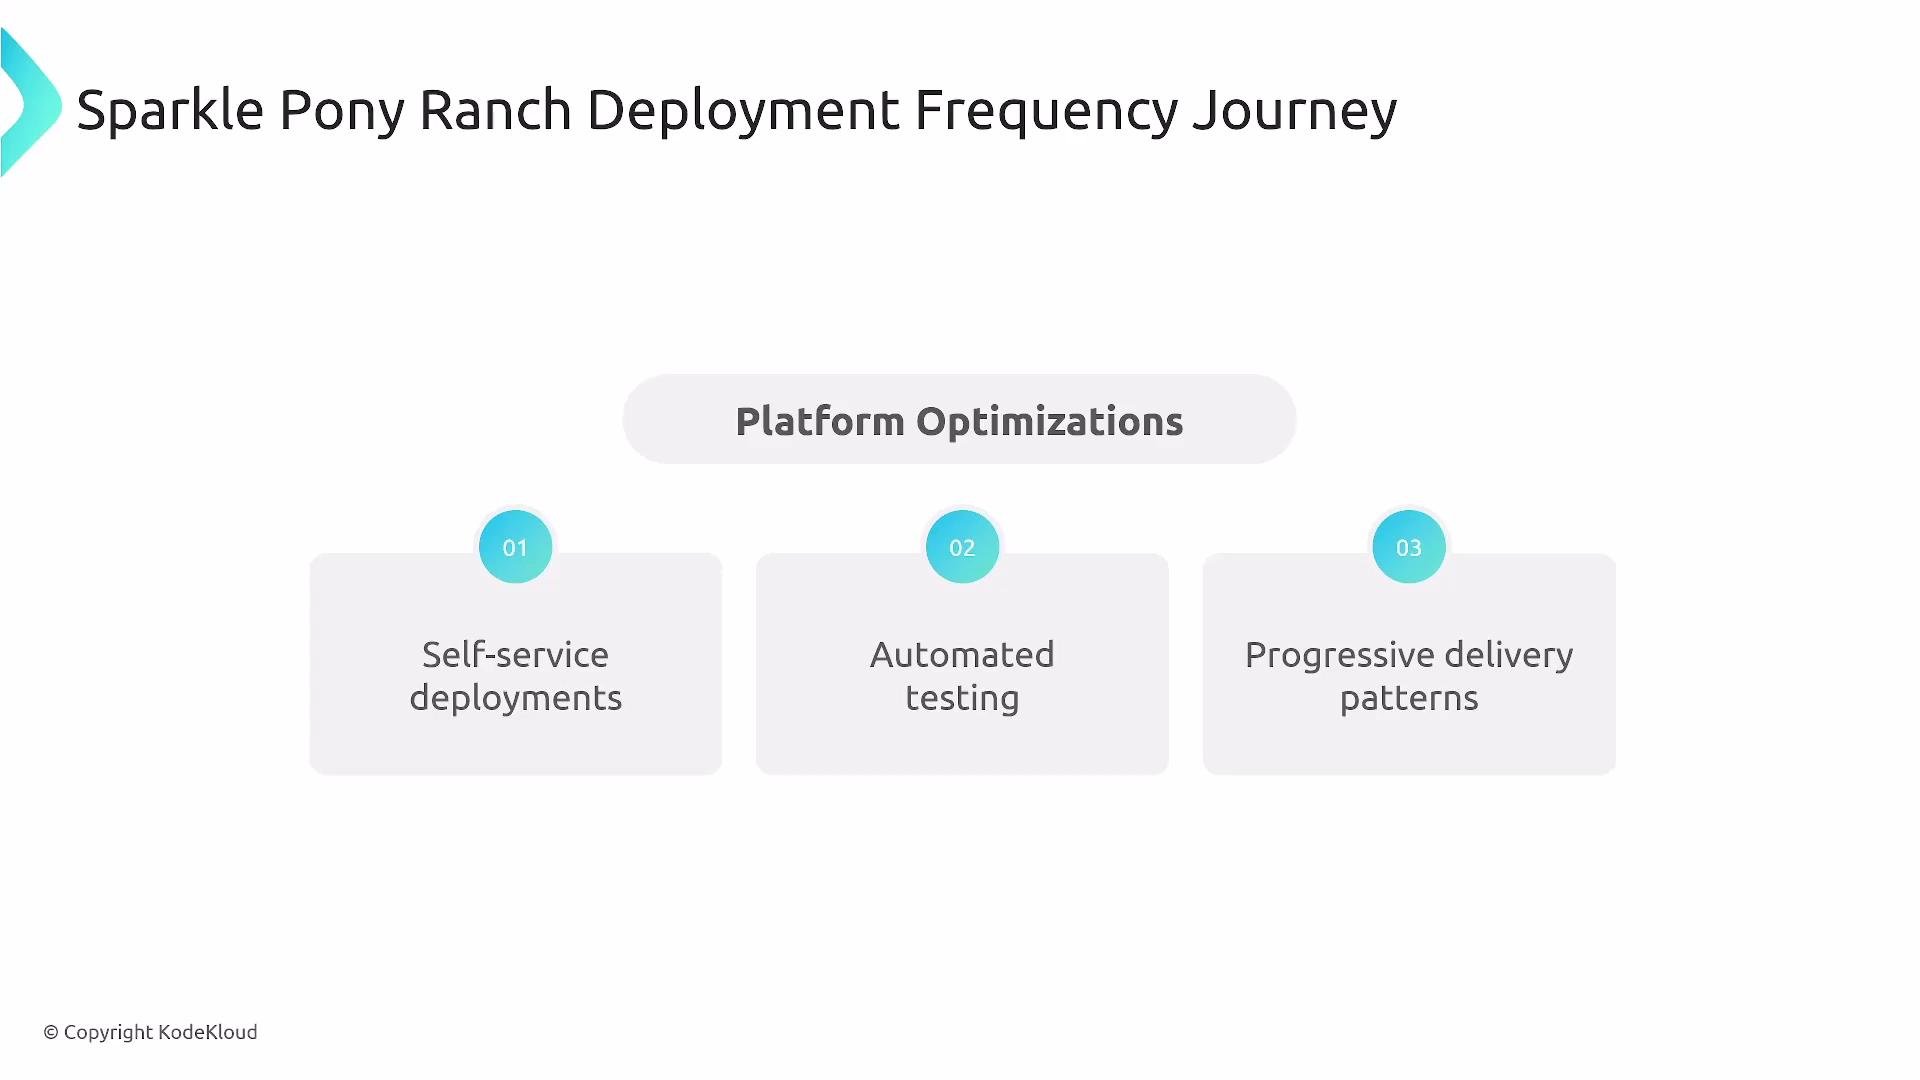
- Provide self-service developer capabilities (templates, CLI, developer portals)
- Automate testing and CI/CD pipelines (parallelize jobs where possible)
- Adopt progressive delivery (canary, linear, feature flags / A/B testing)
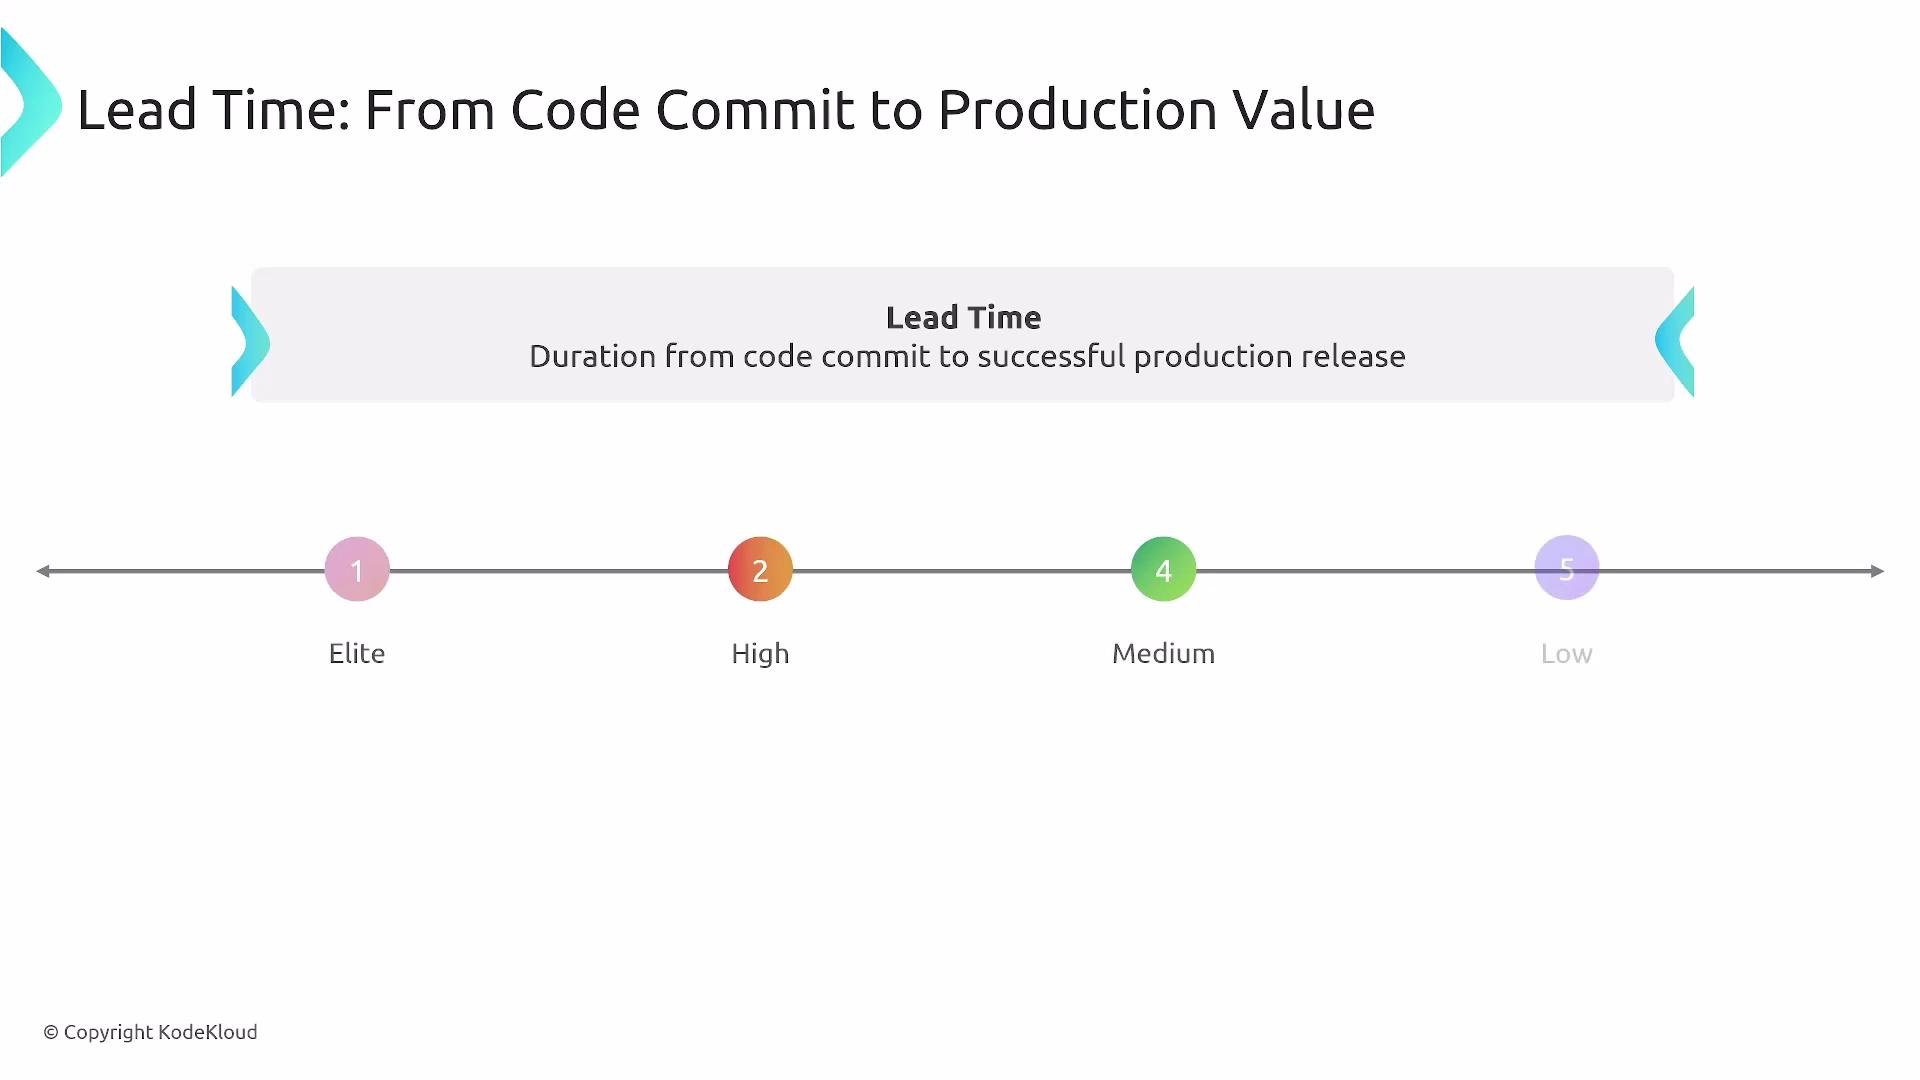
- What it measures: time from commit to successful production deploy (feedback velocity).
- Typical thresholds:
- Elite:
<1 hour - High: 1 day to 1 week
- Medium: 1 week to 1 month
- Low: 1 month to 6 months
- Elite:
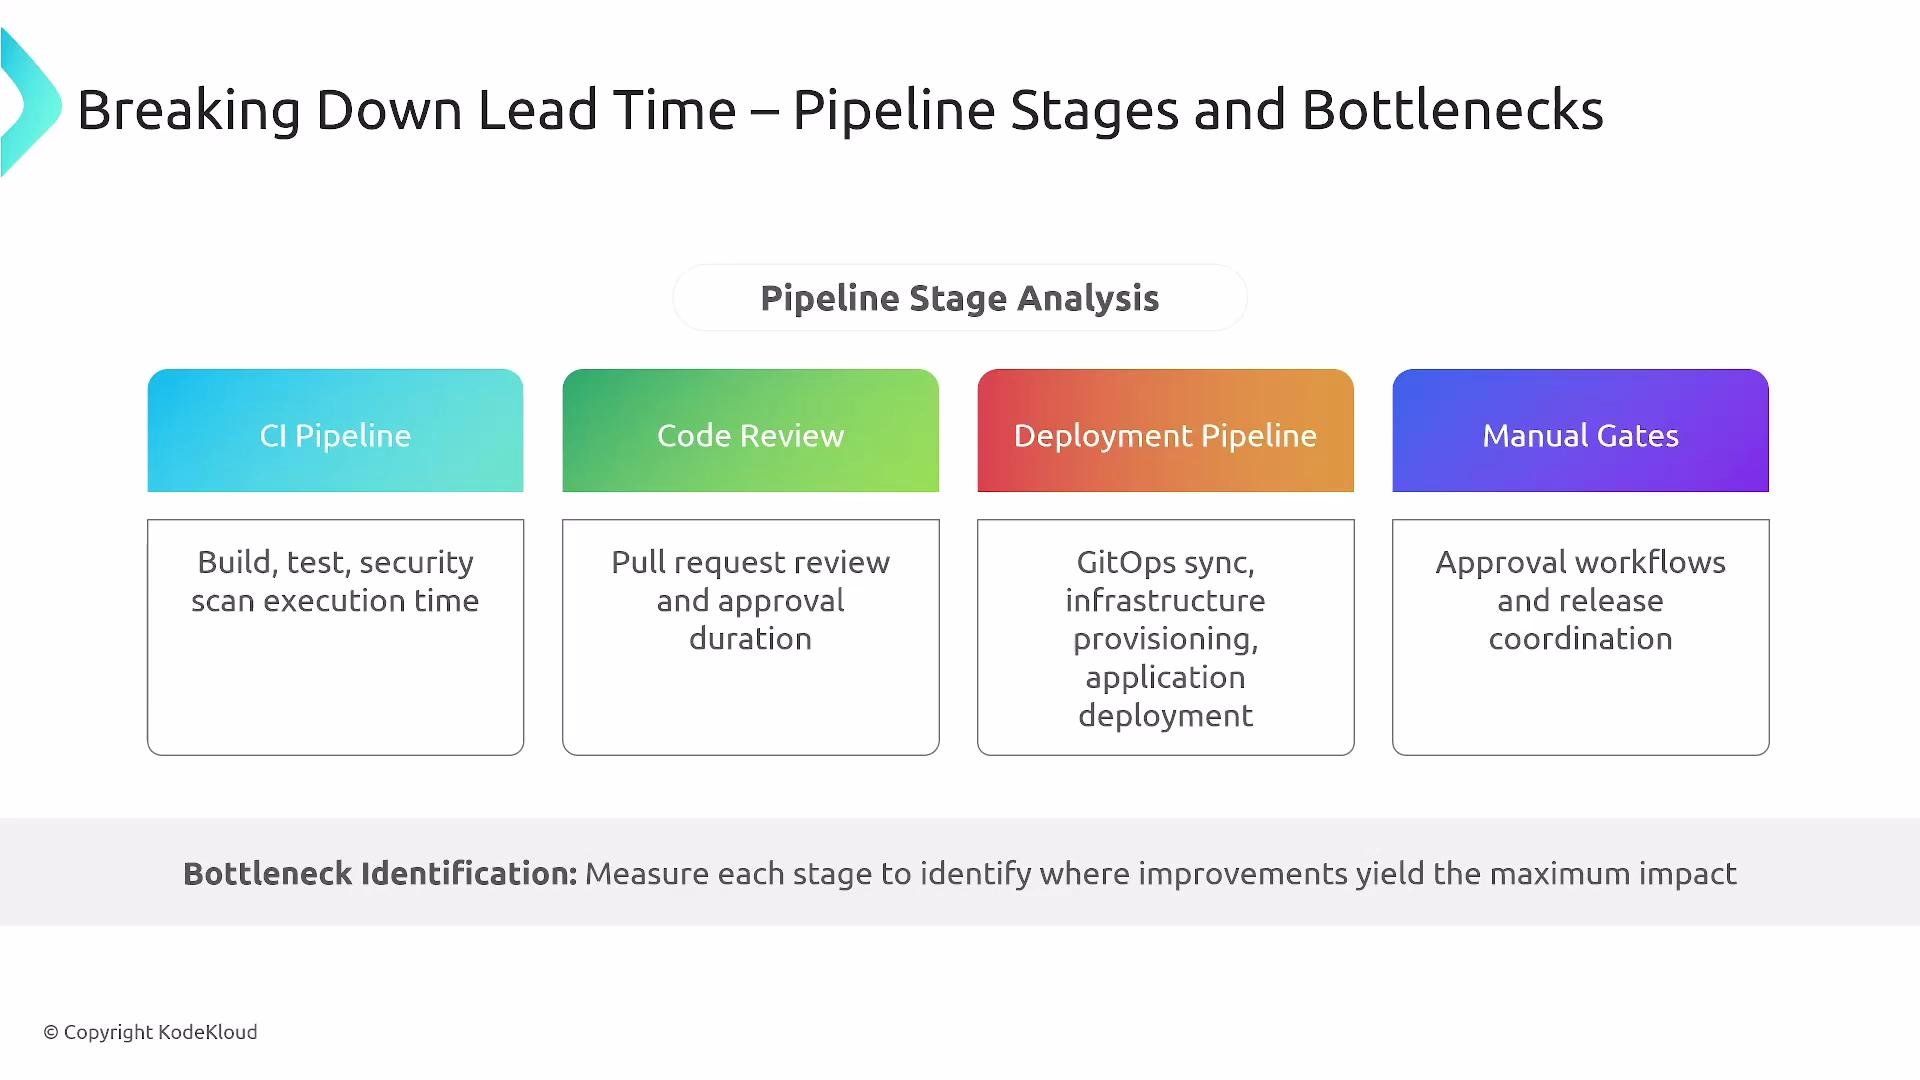
- CI pipeline length and parallelization
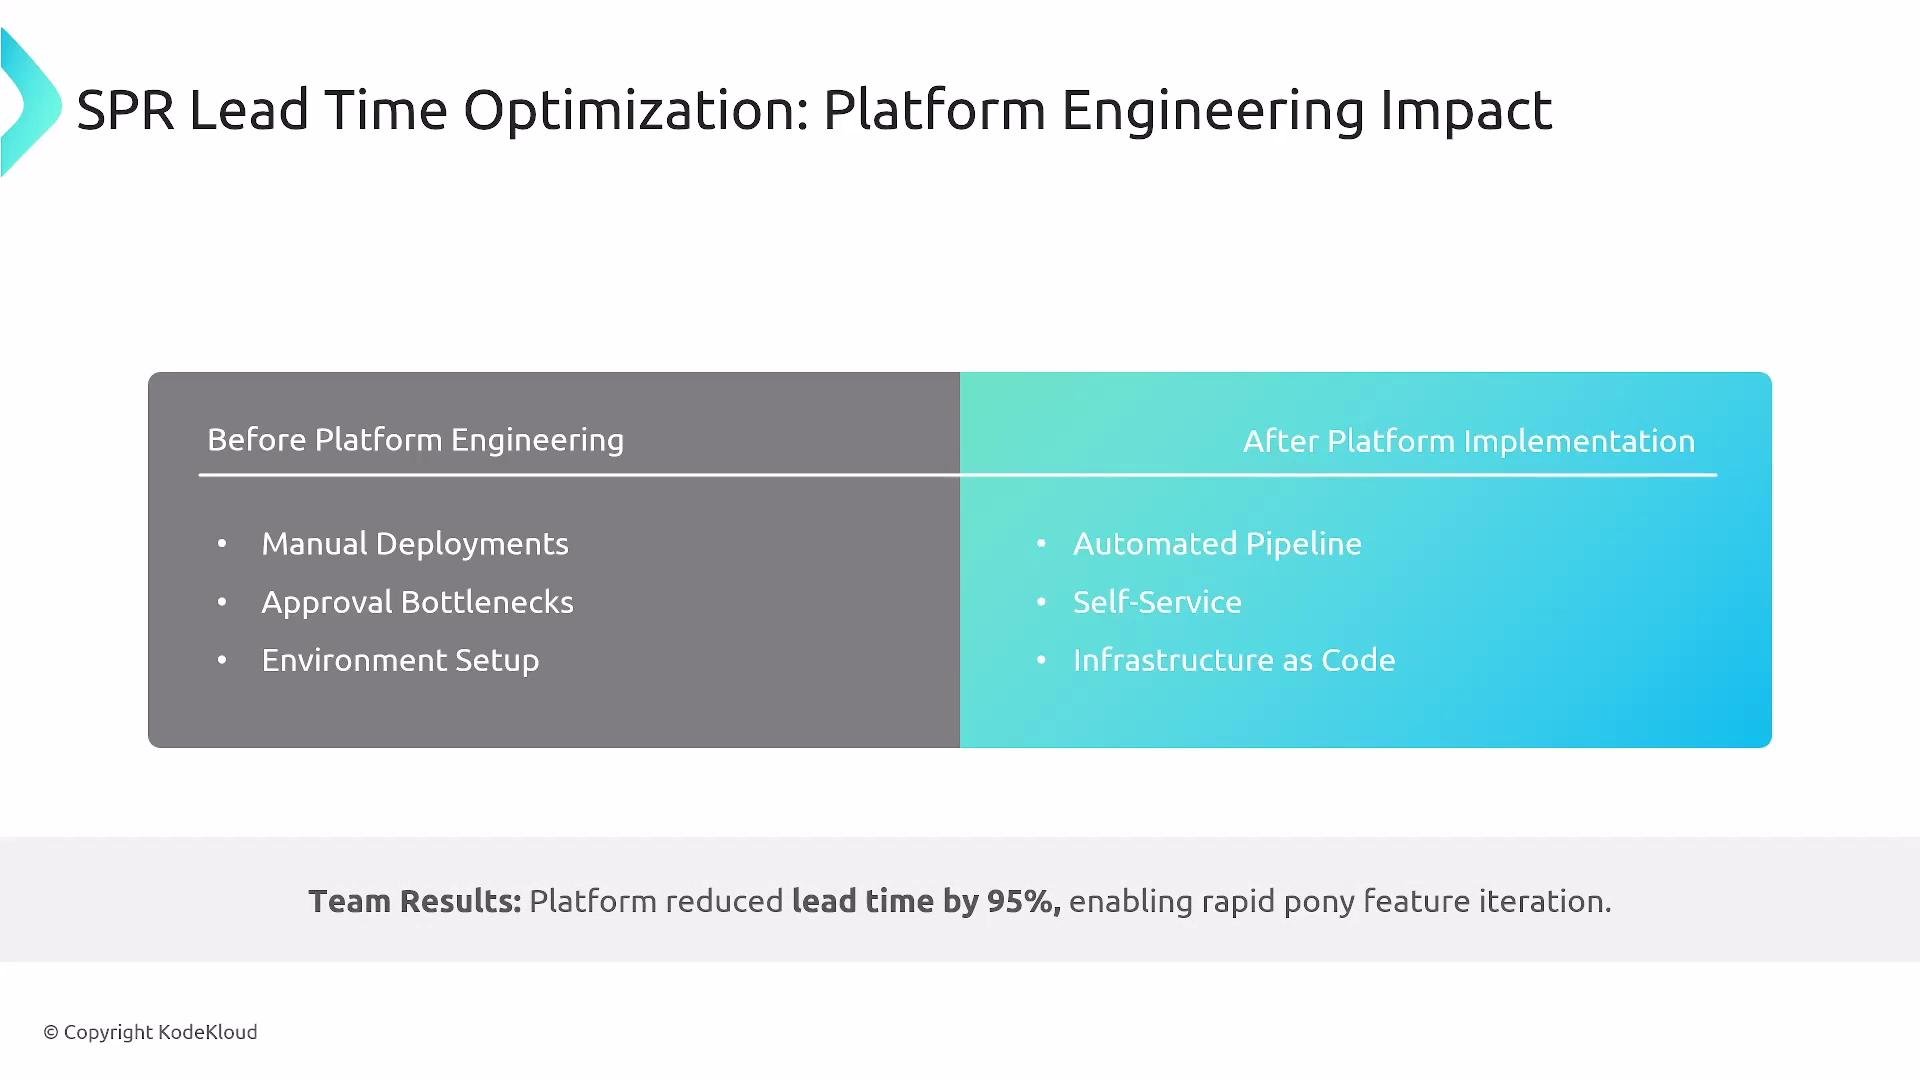
- Manual code review gates — can some checks be automated?
- Manual deployment approvals — consider GitOps / repo triggers
- Poor test coverage and long-running end-to-end tests
- Environment setup and provisioning — shift to IaC and ephemeral environments
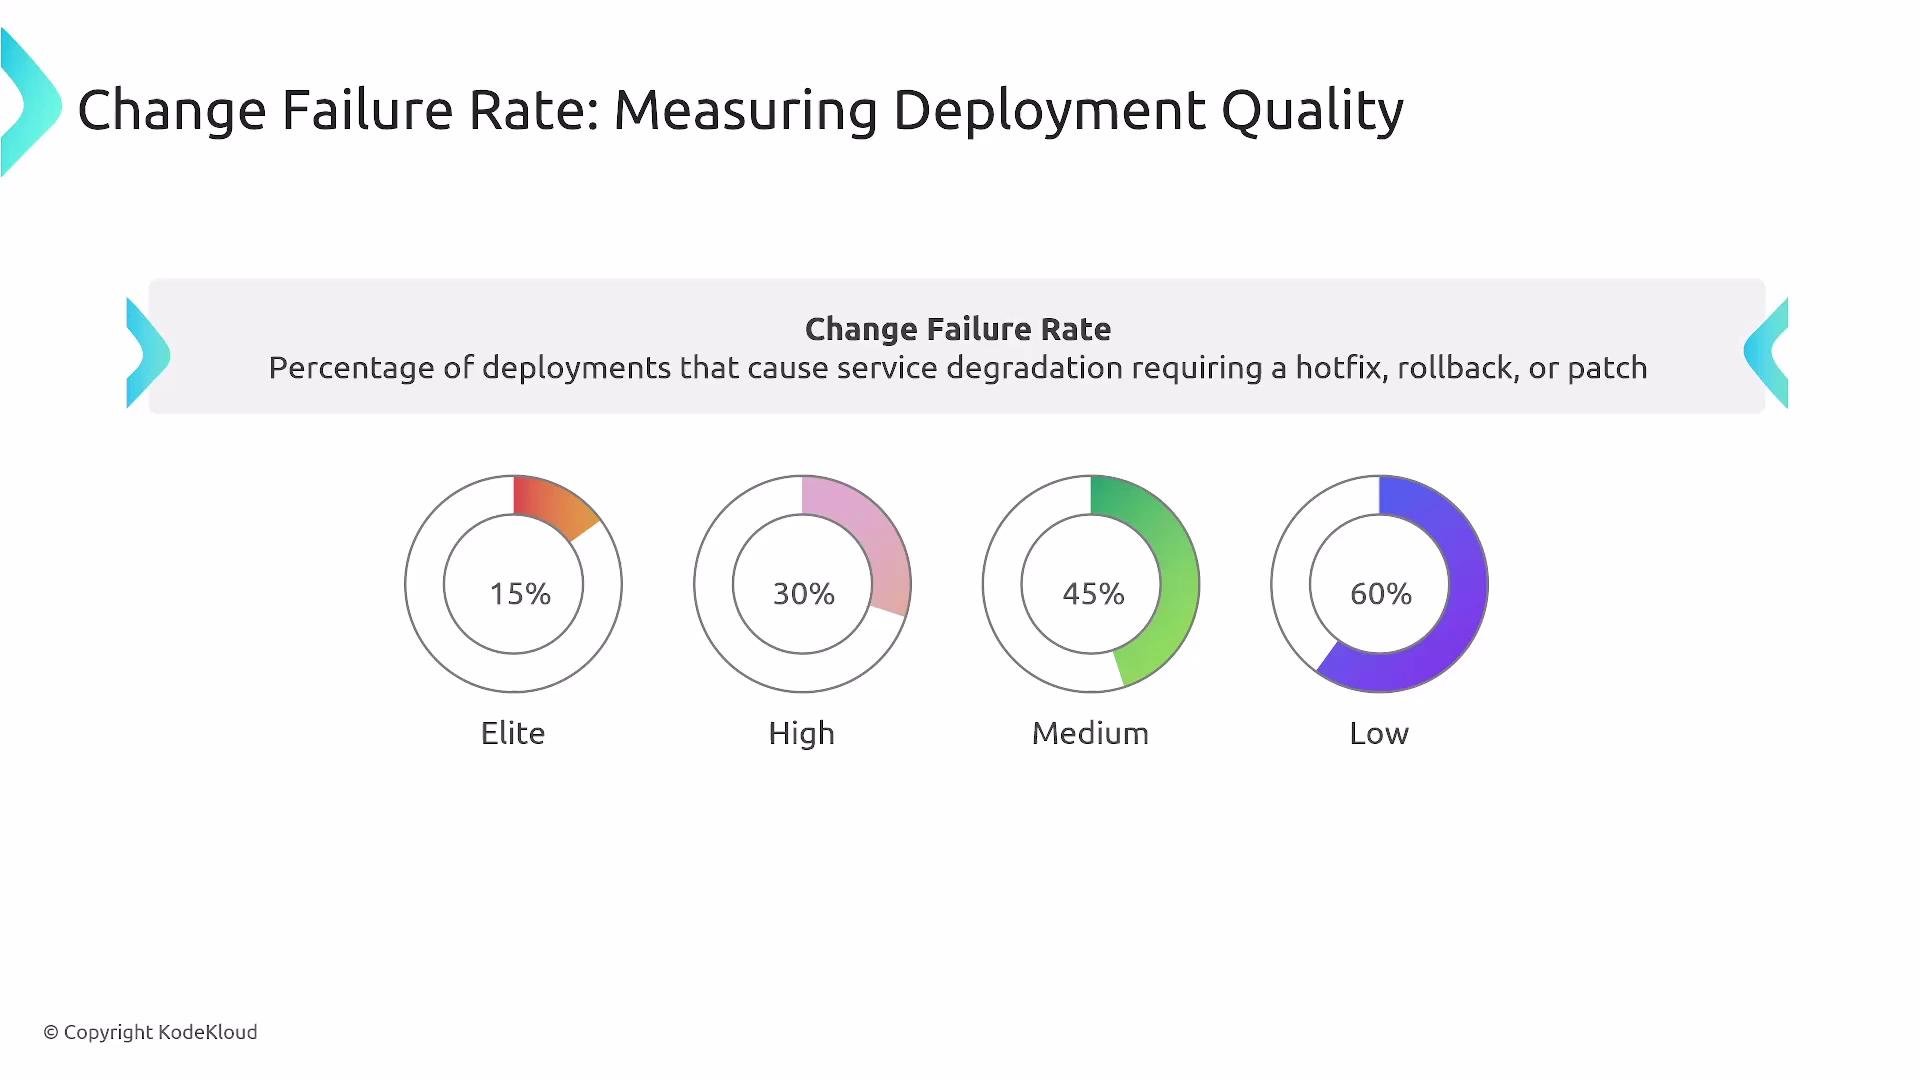
- What it measures: percentage of deployments that cause production degradation or require remediation.
- Typical thresholds:
- Elite: 0–15%
- High: 15–30%
- Medium: 30–45%
- Low: 45–60% (or higher)
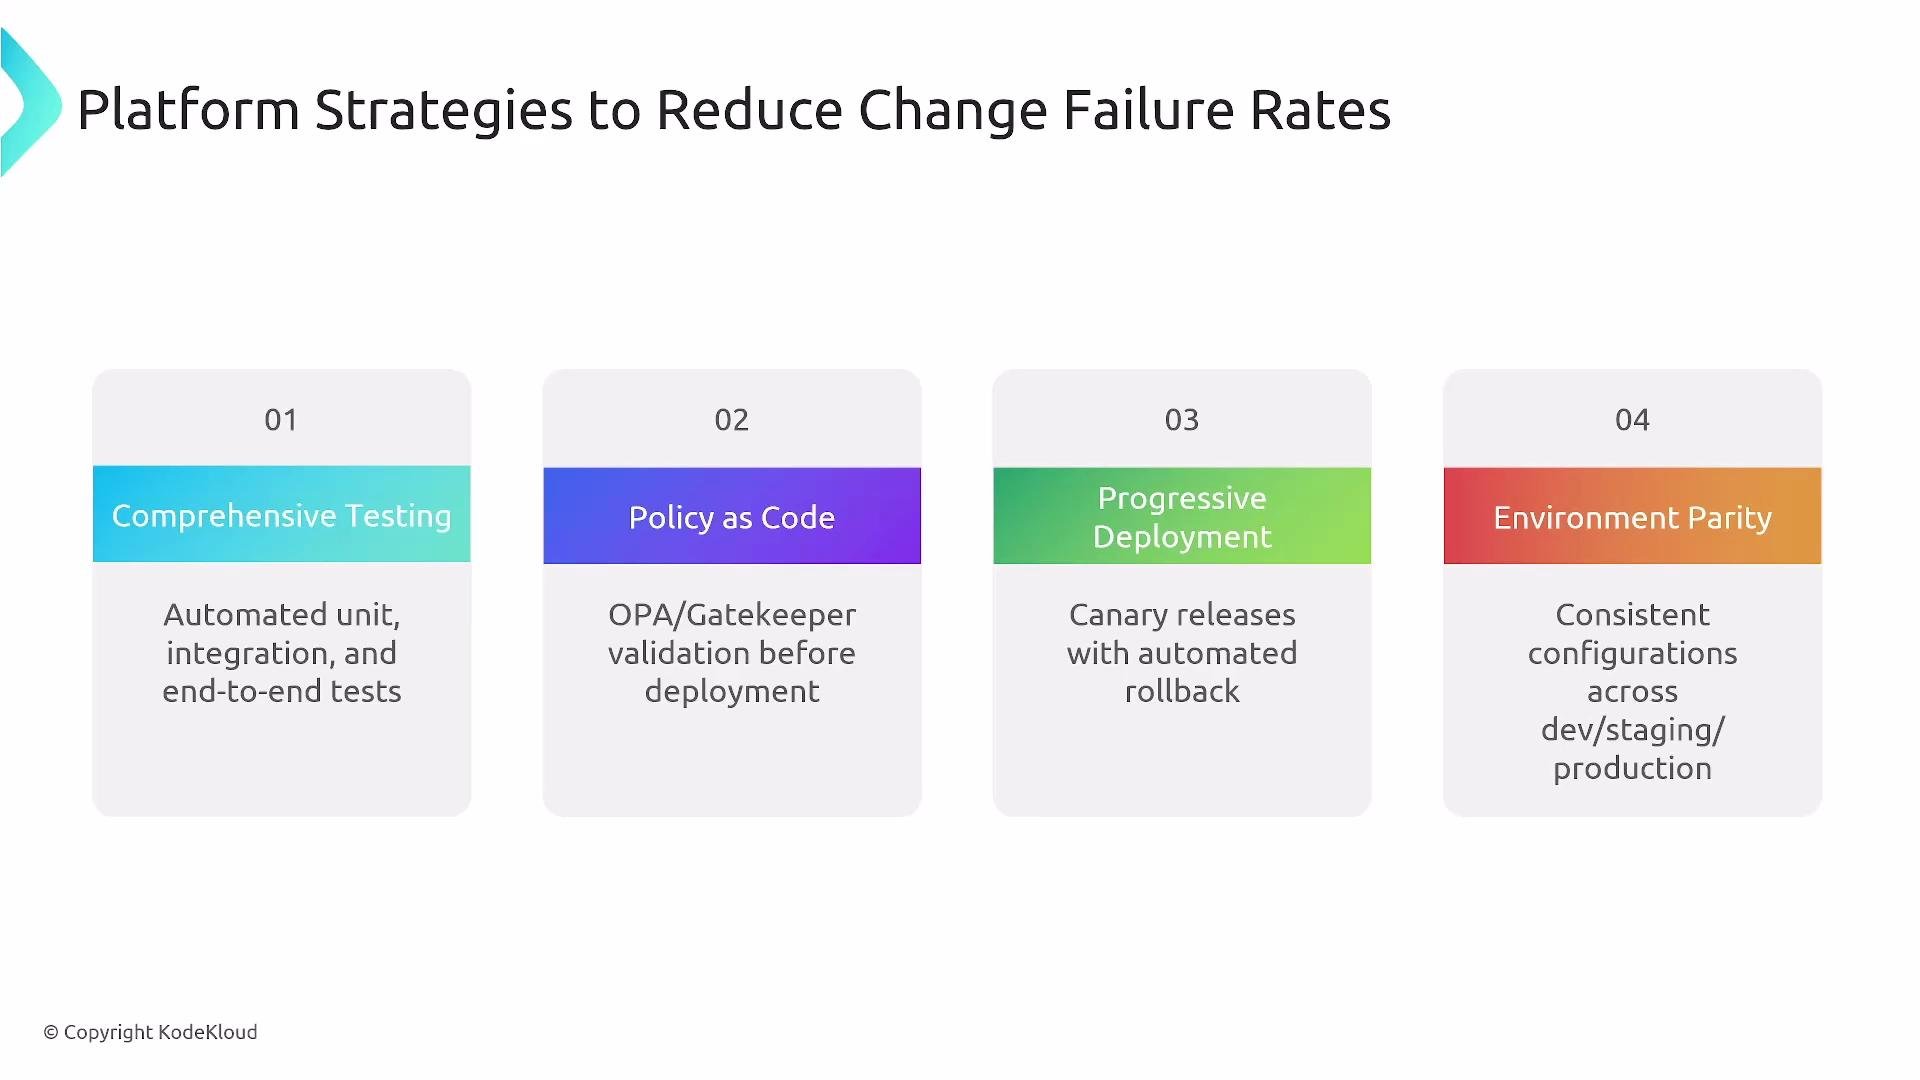
- Comprehensive automated testing: unit, integration, and e2e
- Policy-as-code to validate and block non-compliant changes
- Progressive deployments and feature flags
- Environment parity: staging ≈ production; use sanitized production data for tests
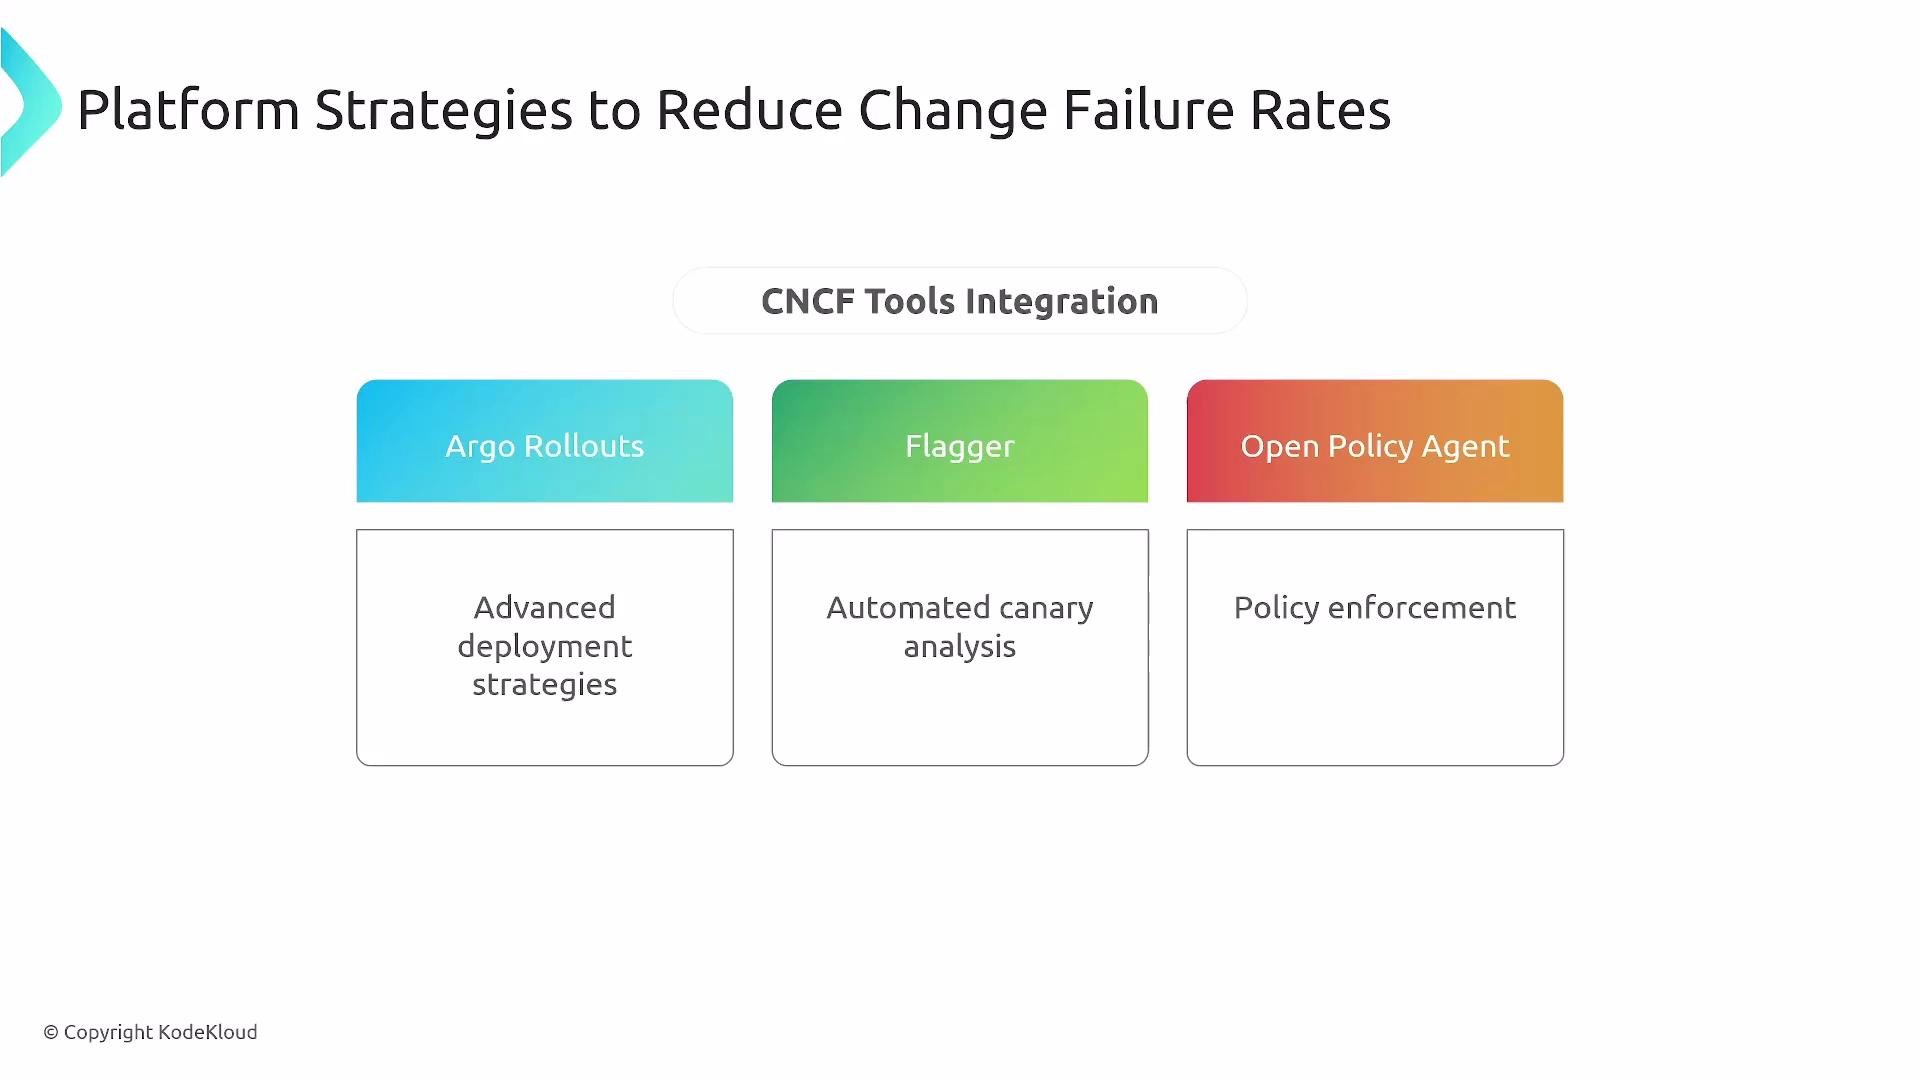
- Tooling for rollout automation and policy enforcement
- Argo Rollouts / Argo CD (GitOps + advanced rollout strategies)
- Flagger (automates canary analysis and promotion)
- Open Policy Agent (OPA) for policy-as-code
- What it measures: time to detect, mitigate, and restore service after an incident.
- Typical thresholds:
- Elite:
<1 hour - High: 1 hour to 1 day
- Medium: 1 day to 1 week
- Low: 1 week to 1 month
- Elite:
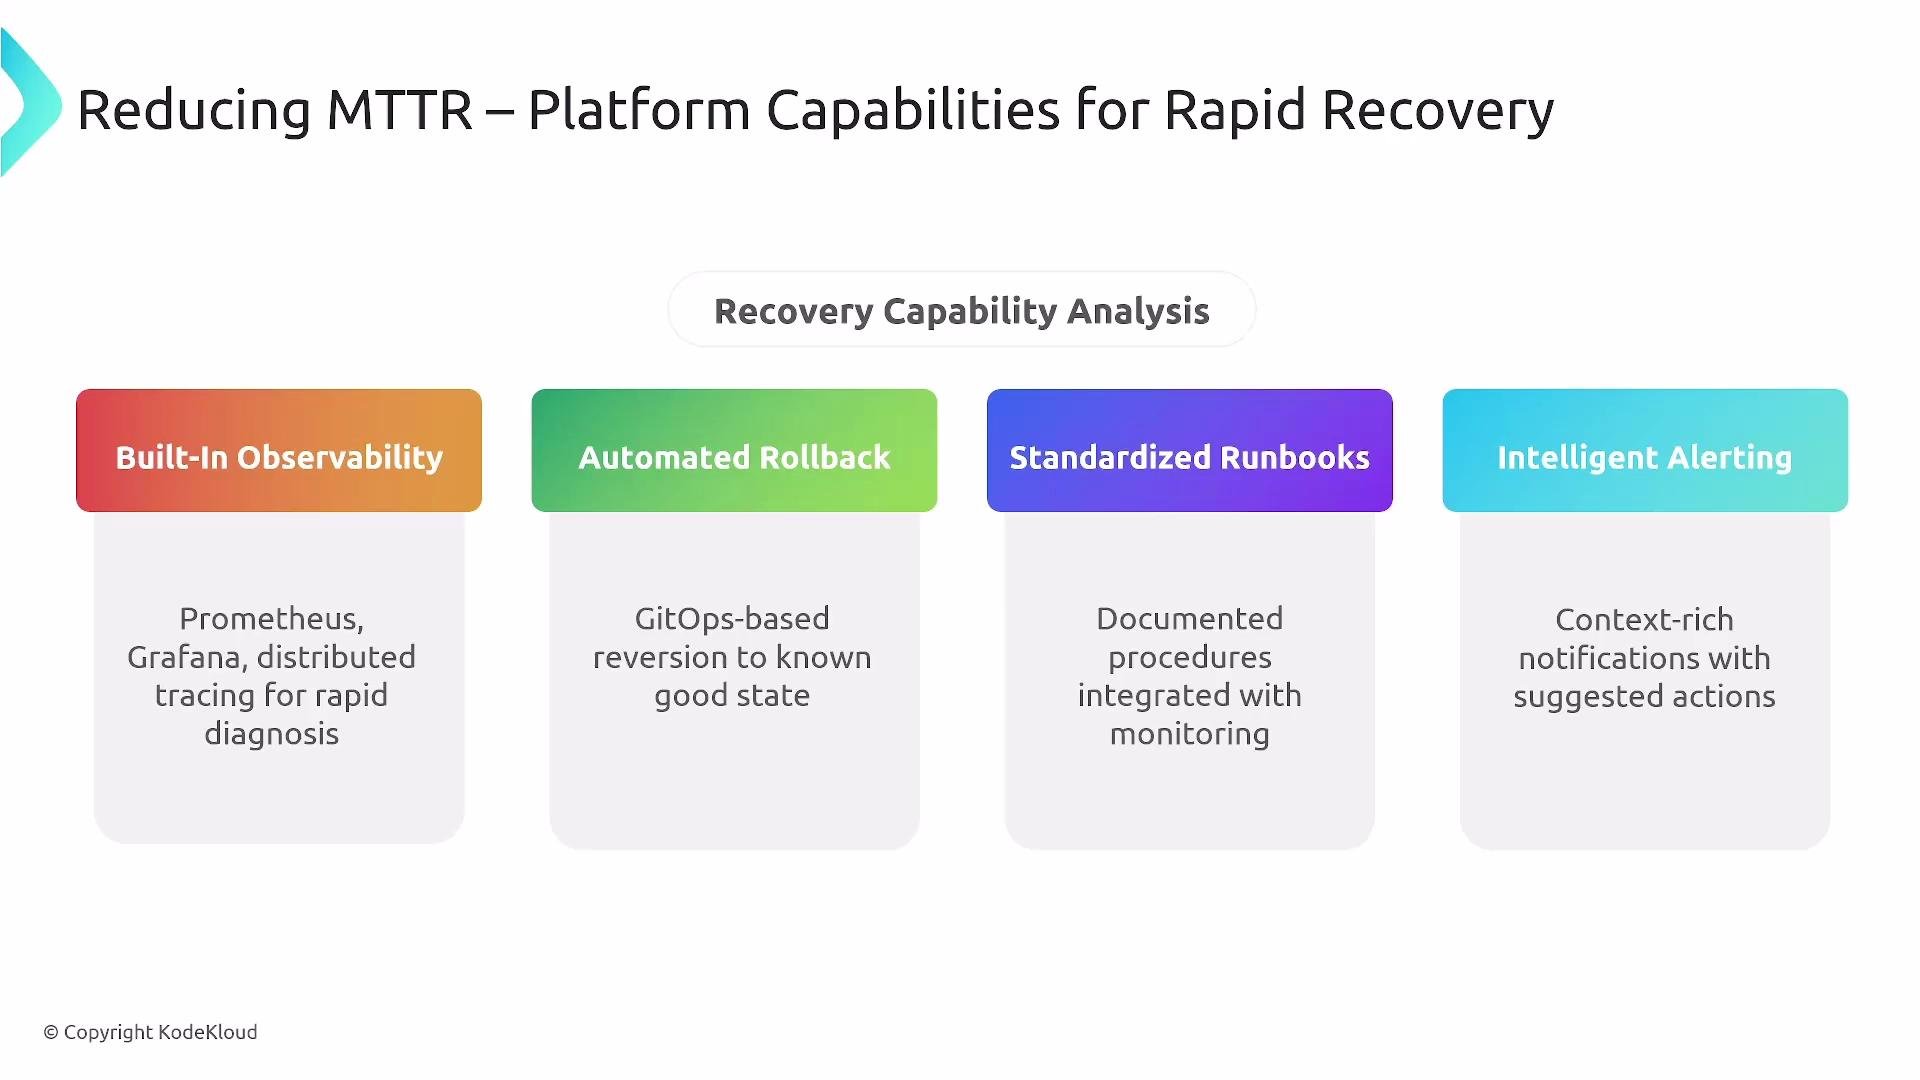
- Invest in observability: metrics, logs, traces, and actionable alerting
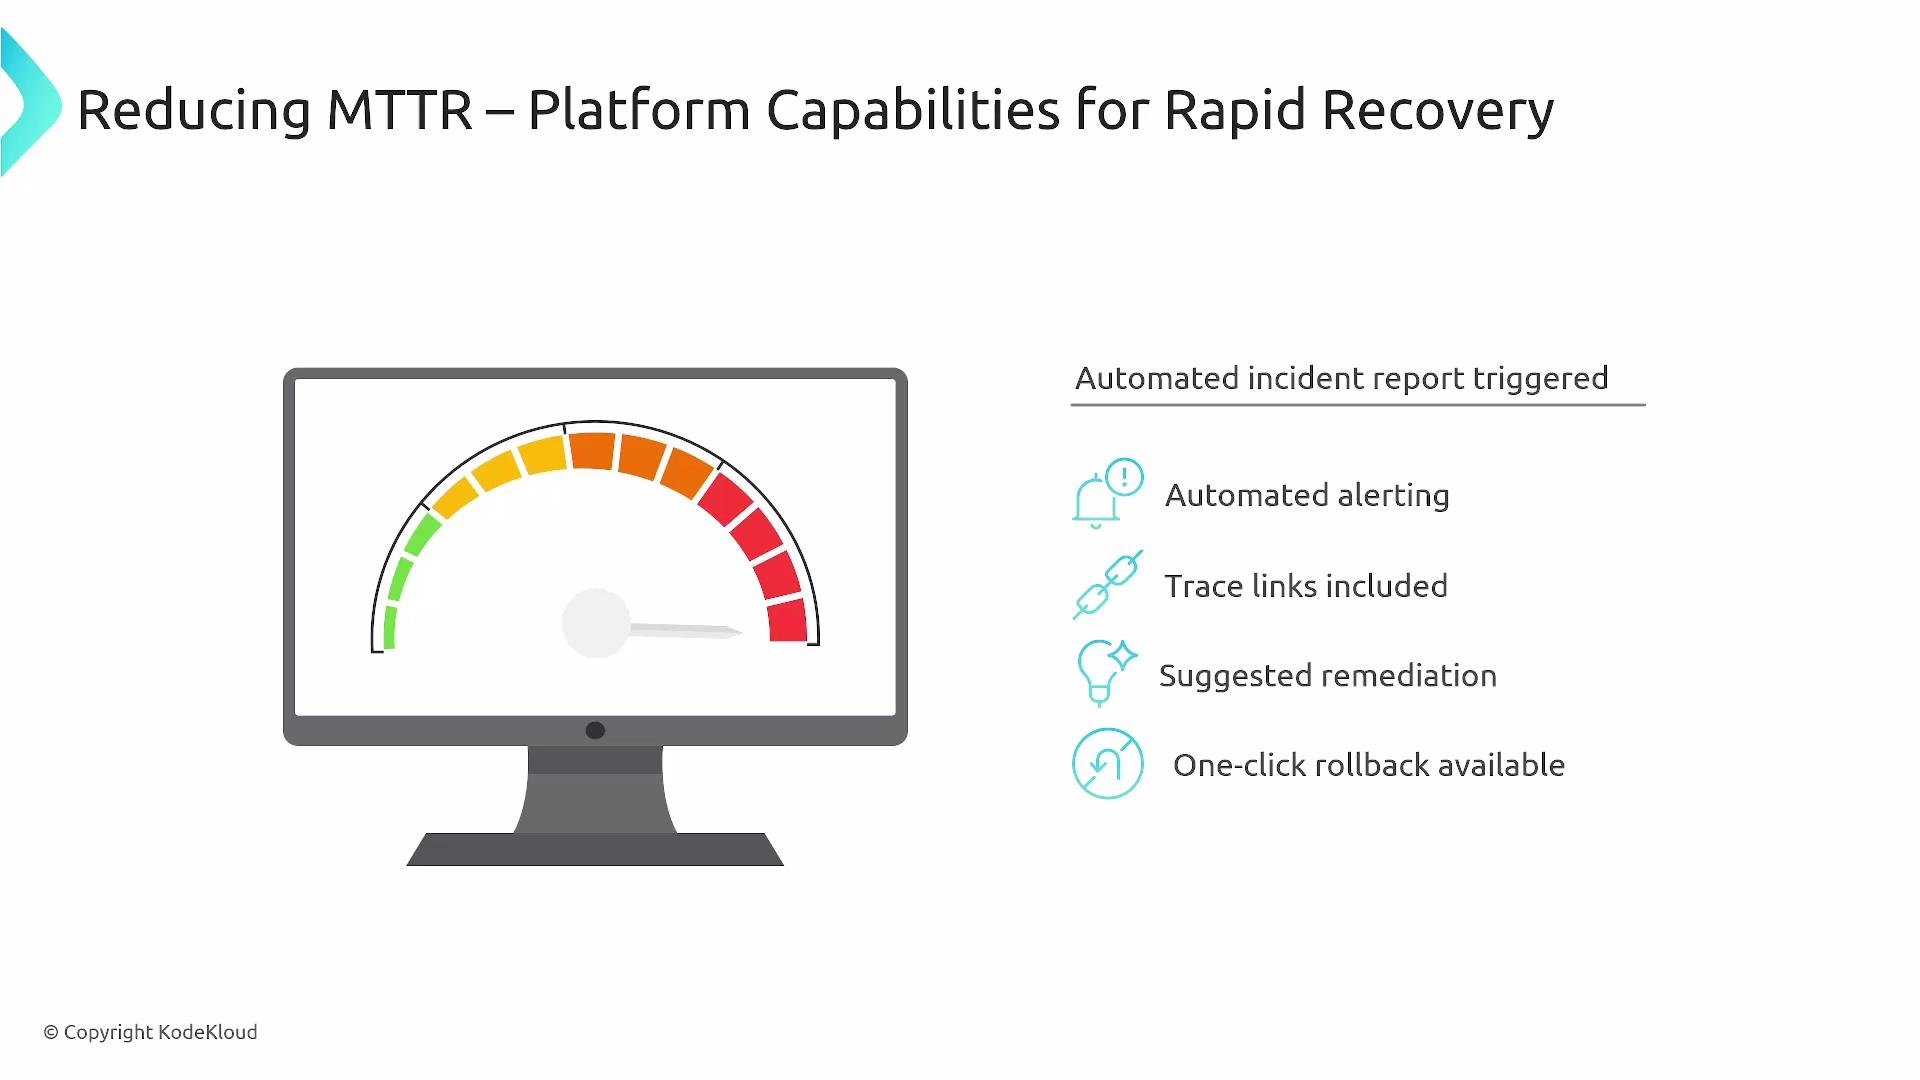
- Send context-rich notifications (include traces, suspected root causes, recent deploys)
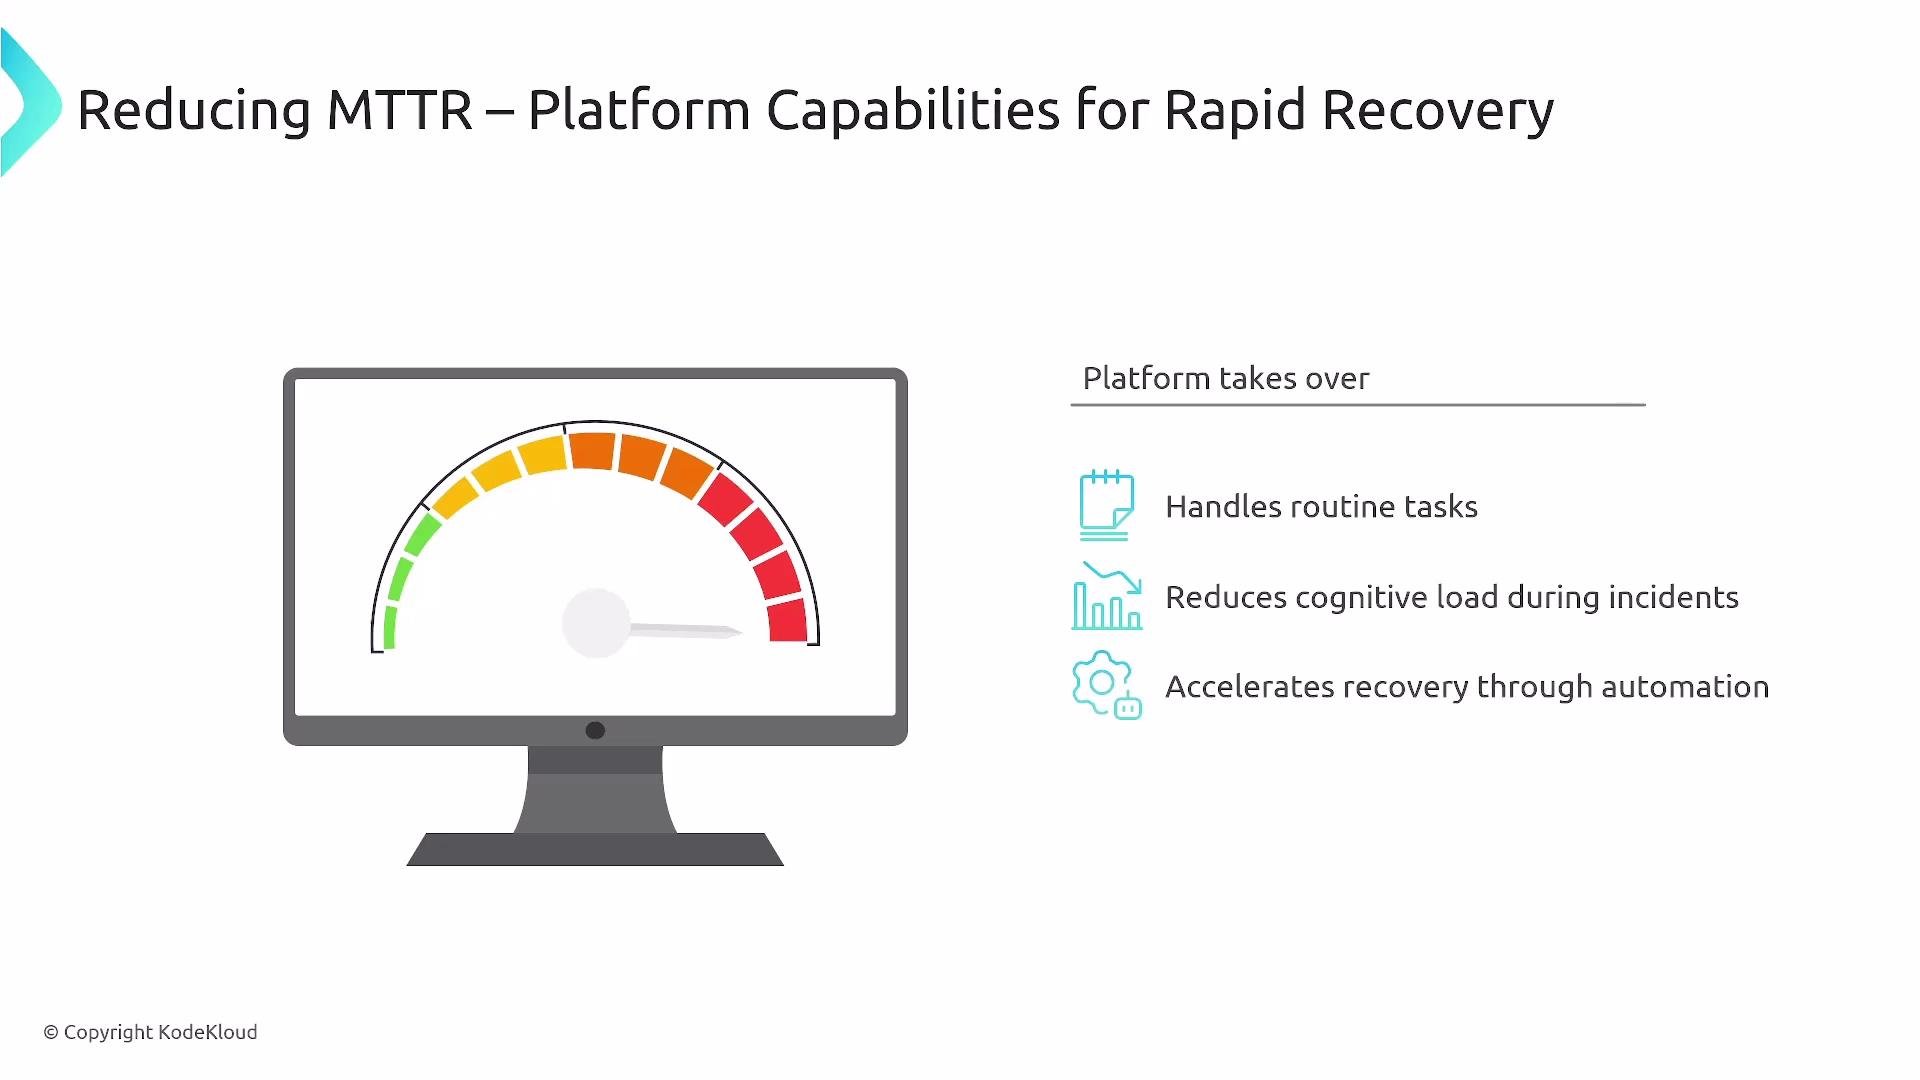
- Automate incident detection and escalation
- Provide high-quality, versioned runbooks linked to alerts
- Implement automated or one-click rollbacks where appropriate
- Add anomaly detection and actionable recommendations to alerts
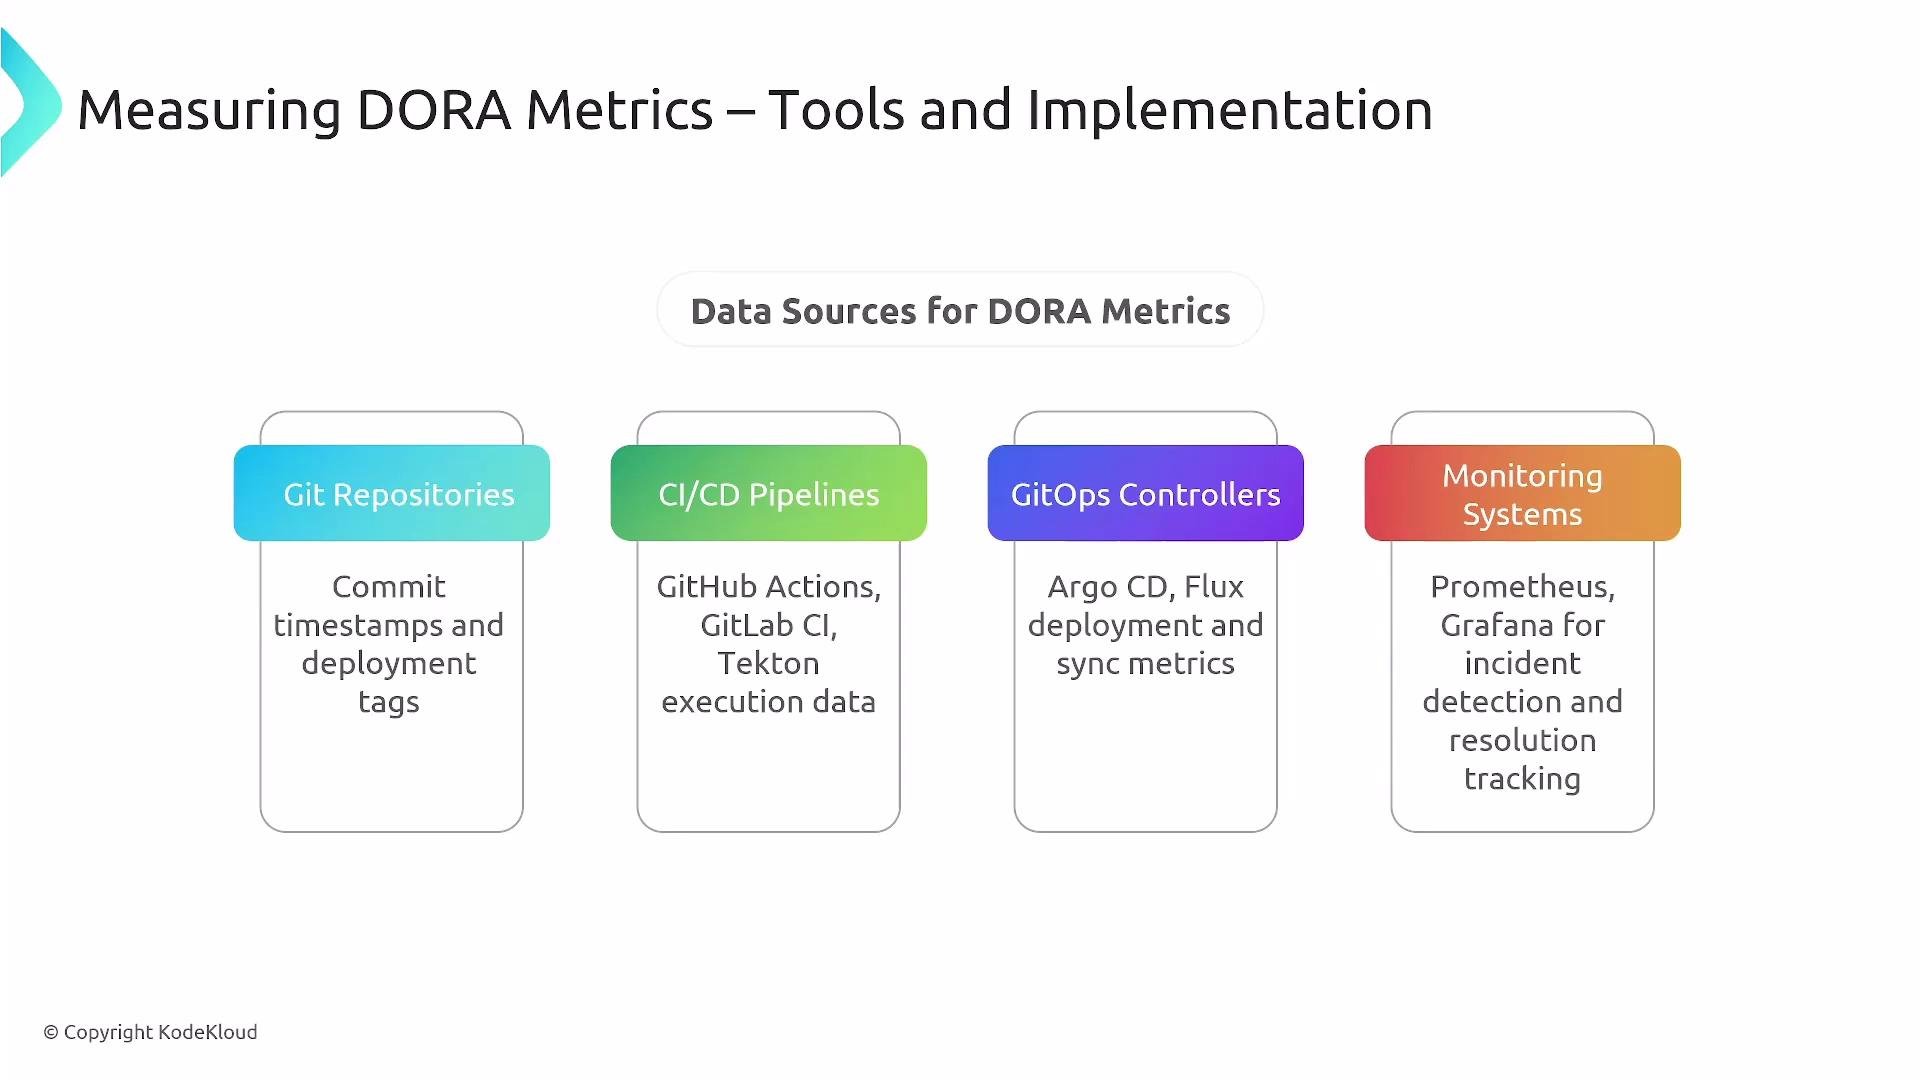
- Git repositories: commit and tag history (deployment frequency, lead time)
- CI/CD pipelines: pipeline runs, artifact timestamps, deployment events
- GitOps controllers: Argo CD, Flux and GitOps event streams
- Monitoring & observability: incident detection, traces, and metrics for MTTR and change failure correlation (Prometheus, OpenTelemetry, Jaeger)
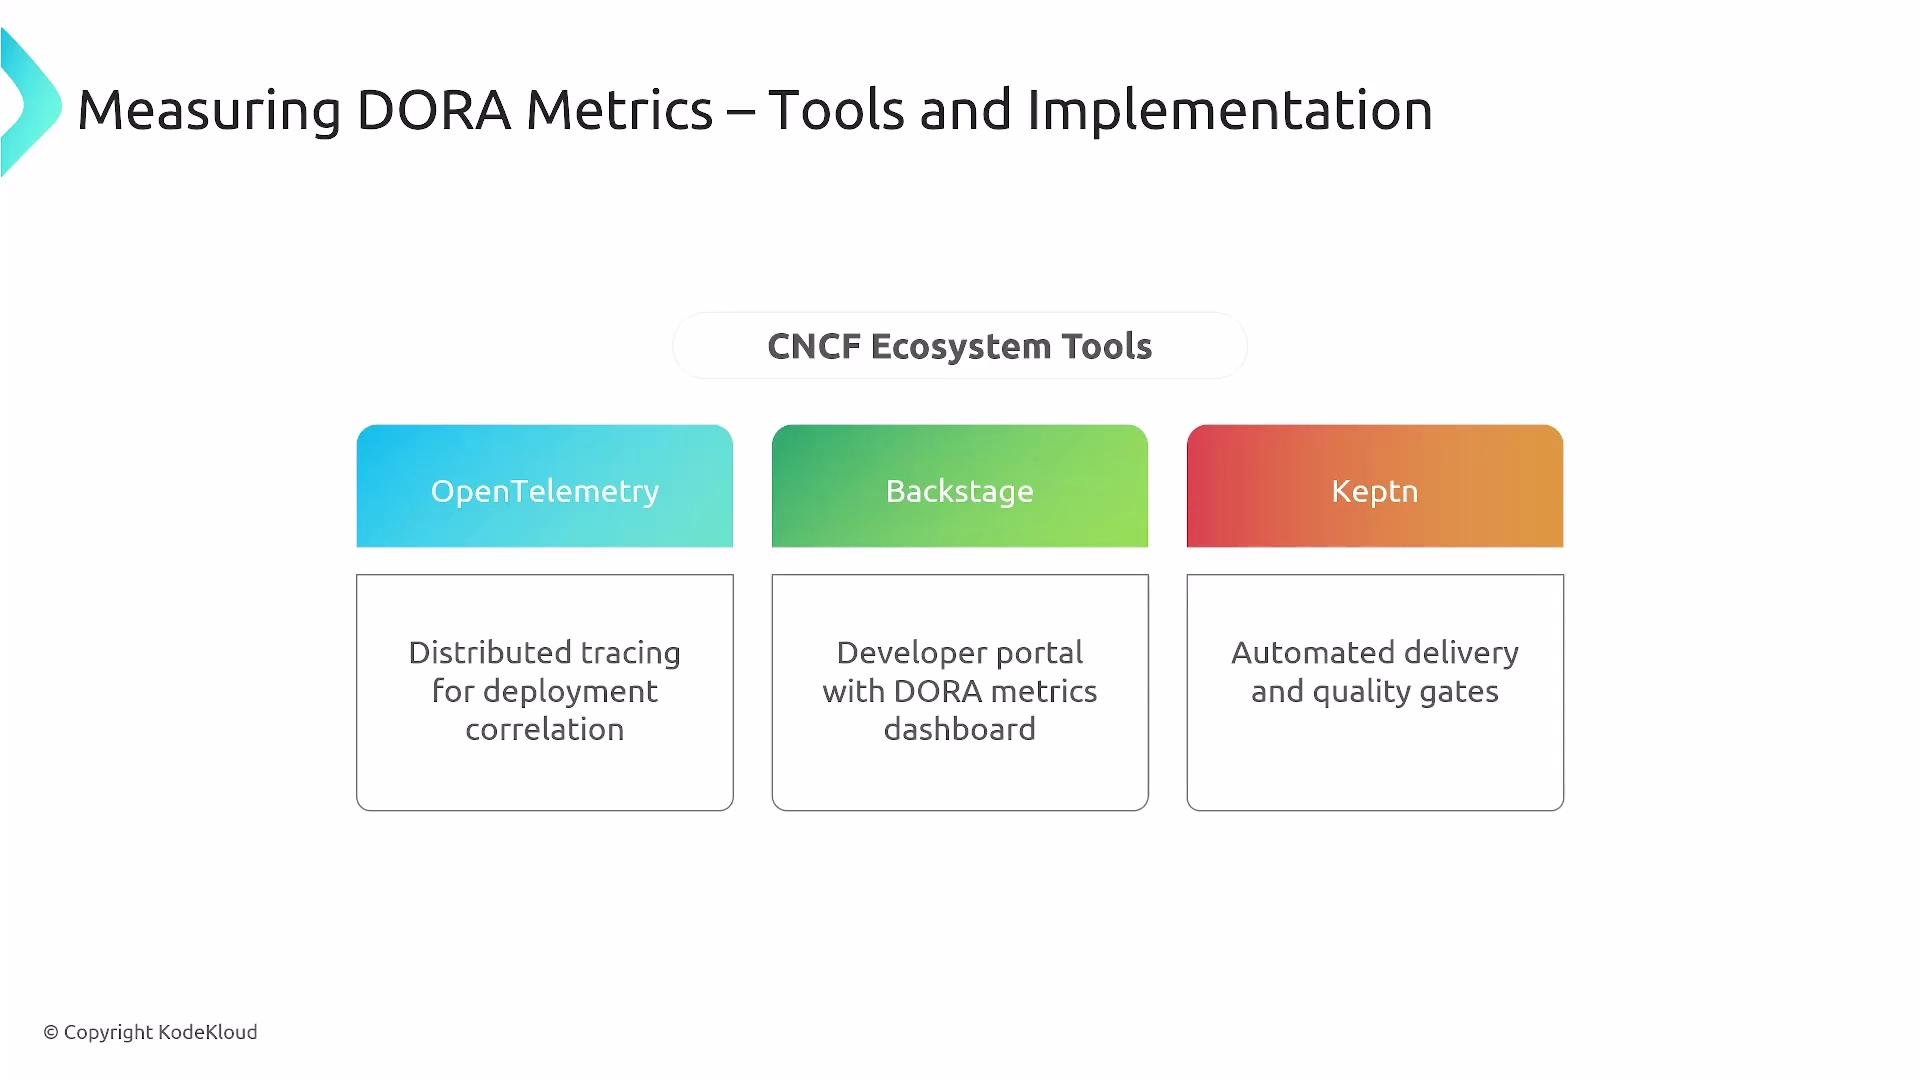
- OpenTelemetry (tracing/metrics)
- Prometheus (metrics collection)
- Jaeger (tracing)
- Grafana (dashboards)
- Backstage (developer portal integration)
- Keptn (delivery automation and quality gates)
- Argo CD / GitHub Actions / GitLab CI / Tekton (pipelines & GitOps)
- Swati: optimize incident response and pipeline health
- Alan: identify infra bottlenecks and provisioning slowdowns
- Phuong: measure developer-facing feature delivery and feedback loops
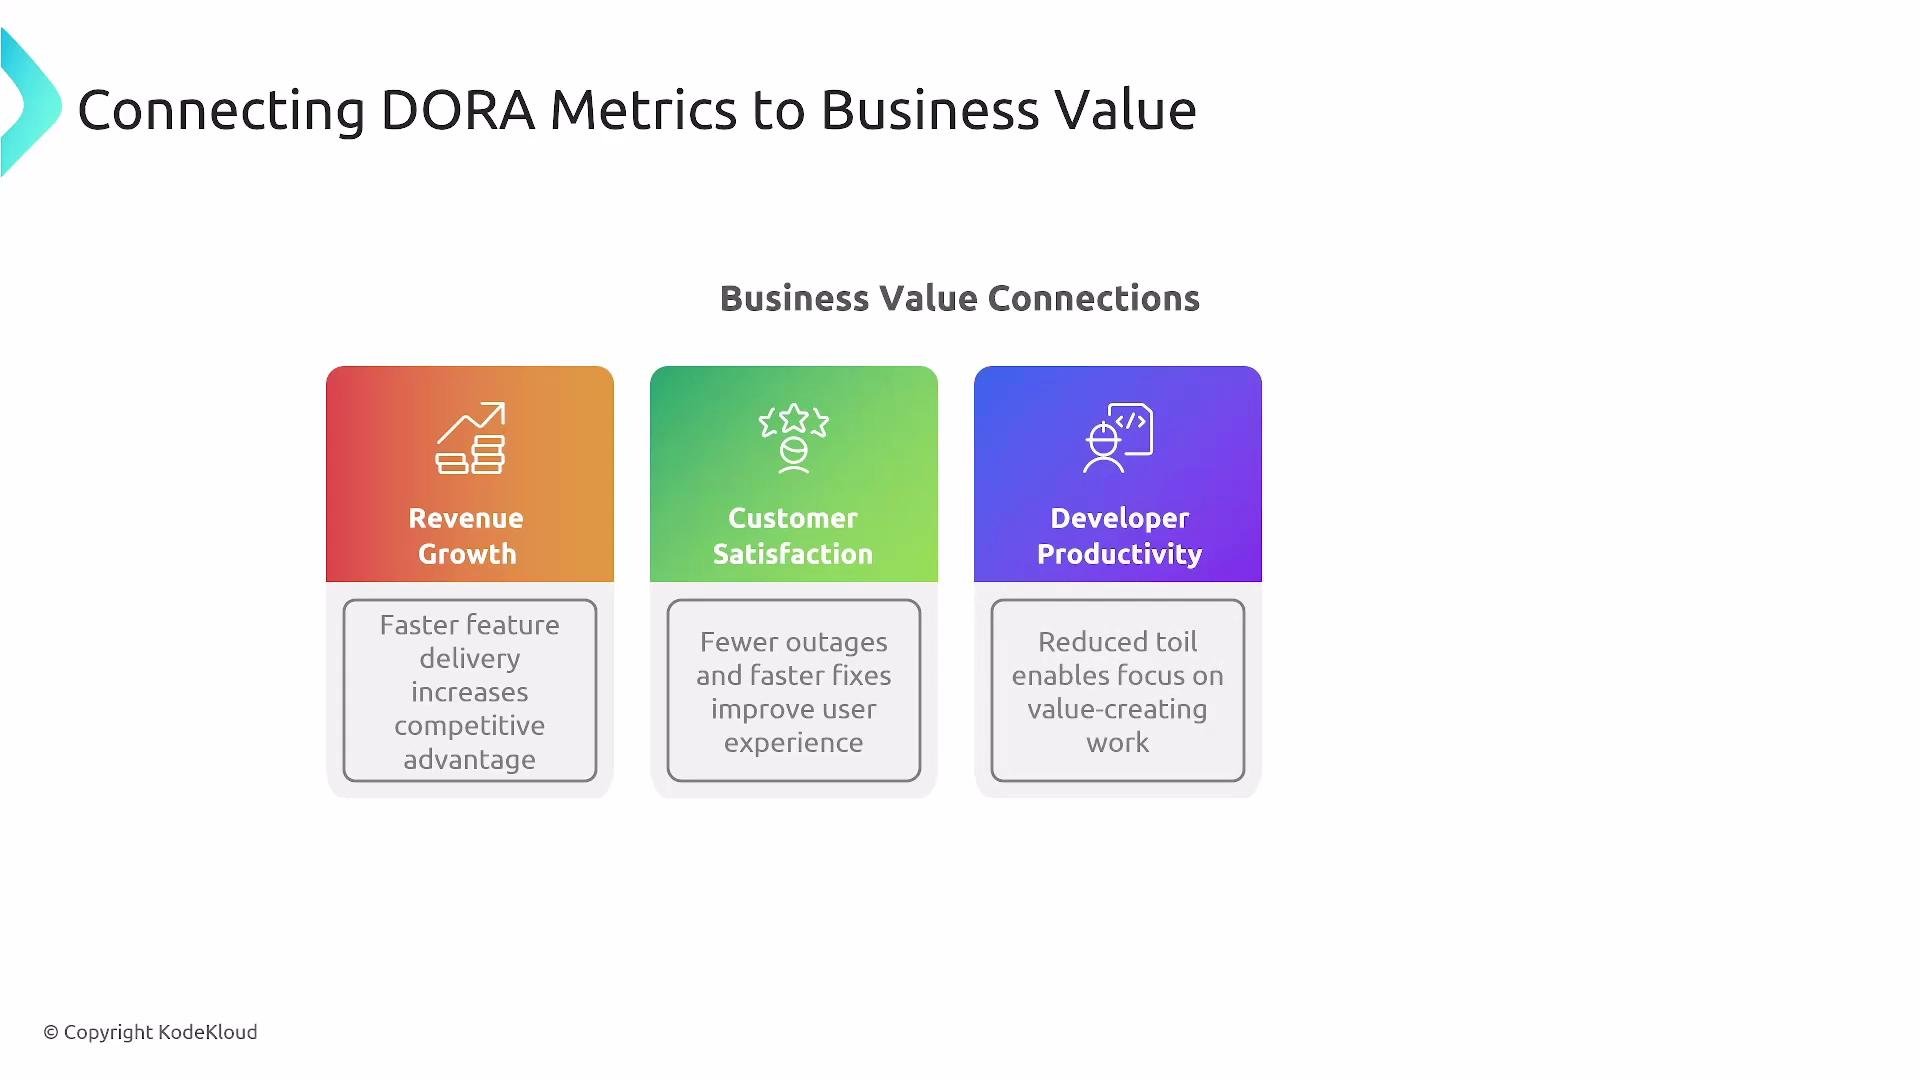
- Faster feature delivery → faster feedback loops, earlier revenue capture
- Fewer outages & faster recovery → improved customer satisfaction
- Reduced toil → engineers spend more time on value-creating work
- Better alignment between platform investments and business goals
- Review metrics regularly (monthly is a good cadence) to spot trends and regressions
- Correlate engineering metrics with business KPIs (revenue, user growth, retention)
- Use DORA metrics for team-level improvement — avoid individual-level evaluation
- Combine DORA with developer satisfaction metrics (NPS, CSAT) for a fuller view
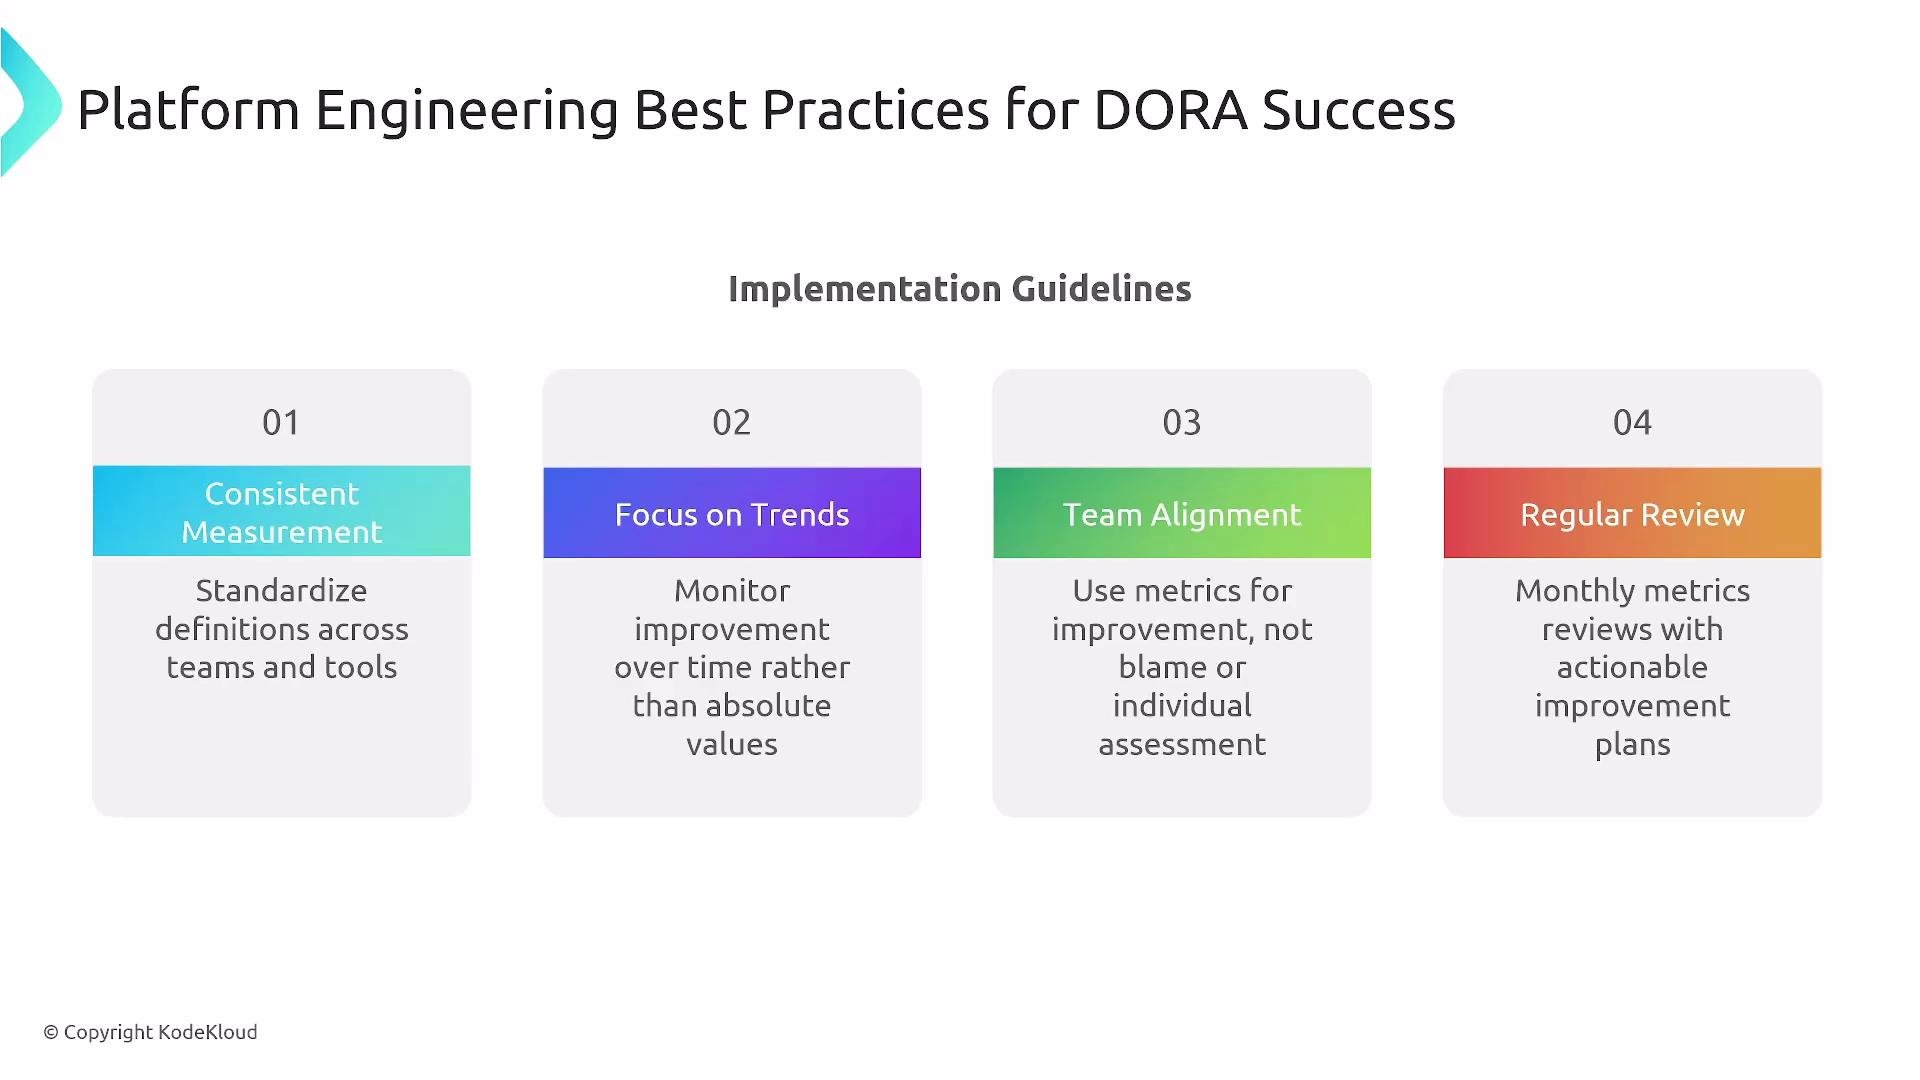
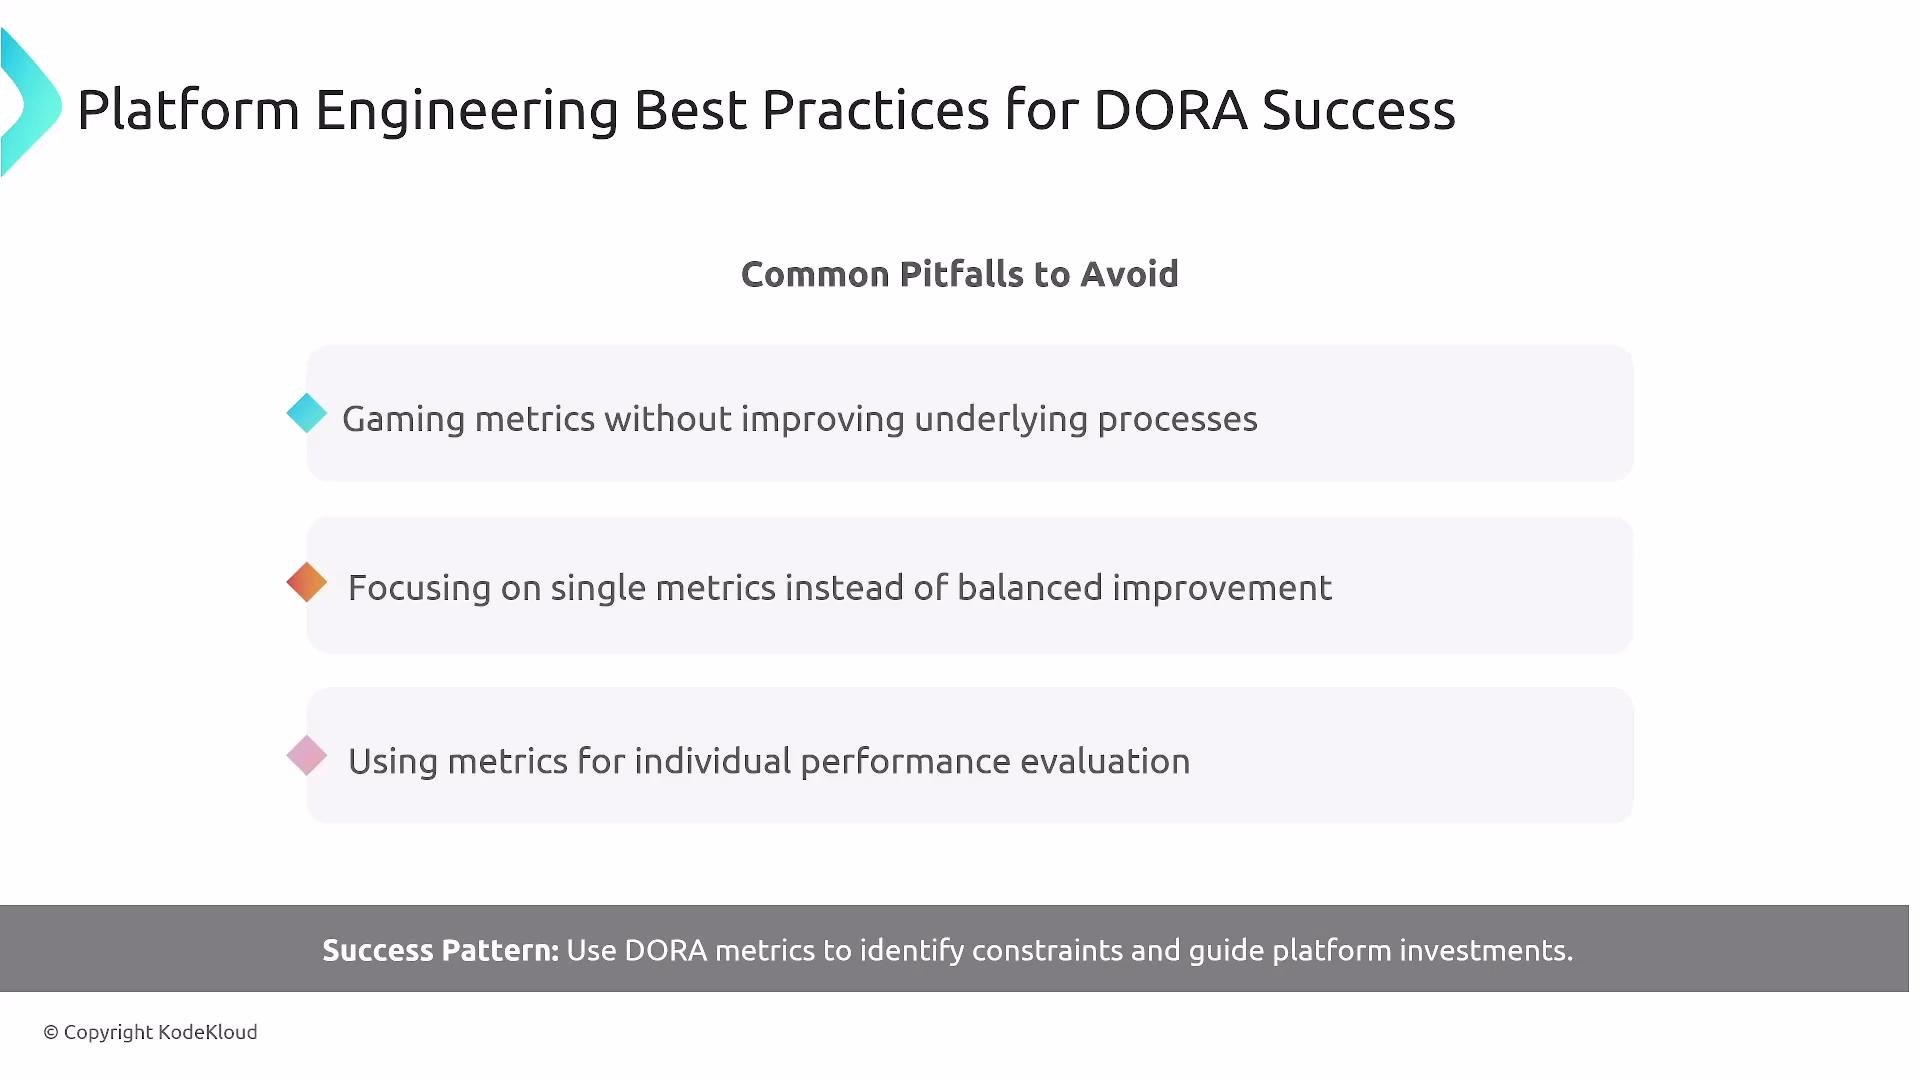
Don’t “game” DORA metrics. Treat them as signals for improvement, not a scoreboard. Avoid optimizing a single metric at the expense of overall reliability or team morale.
- Treating DORA numbers as a scoreboard rather than an improvement signal
- Using metrics to reward or punish individuals
- Ignoring correlations between engineering metrics and business outcomes
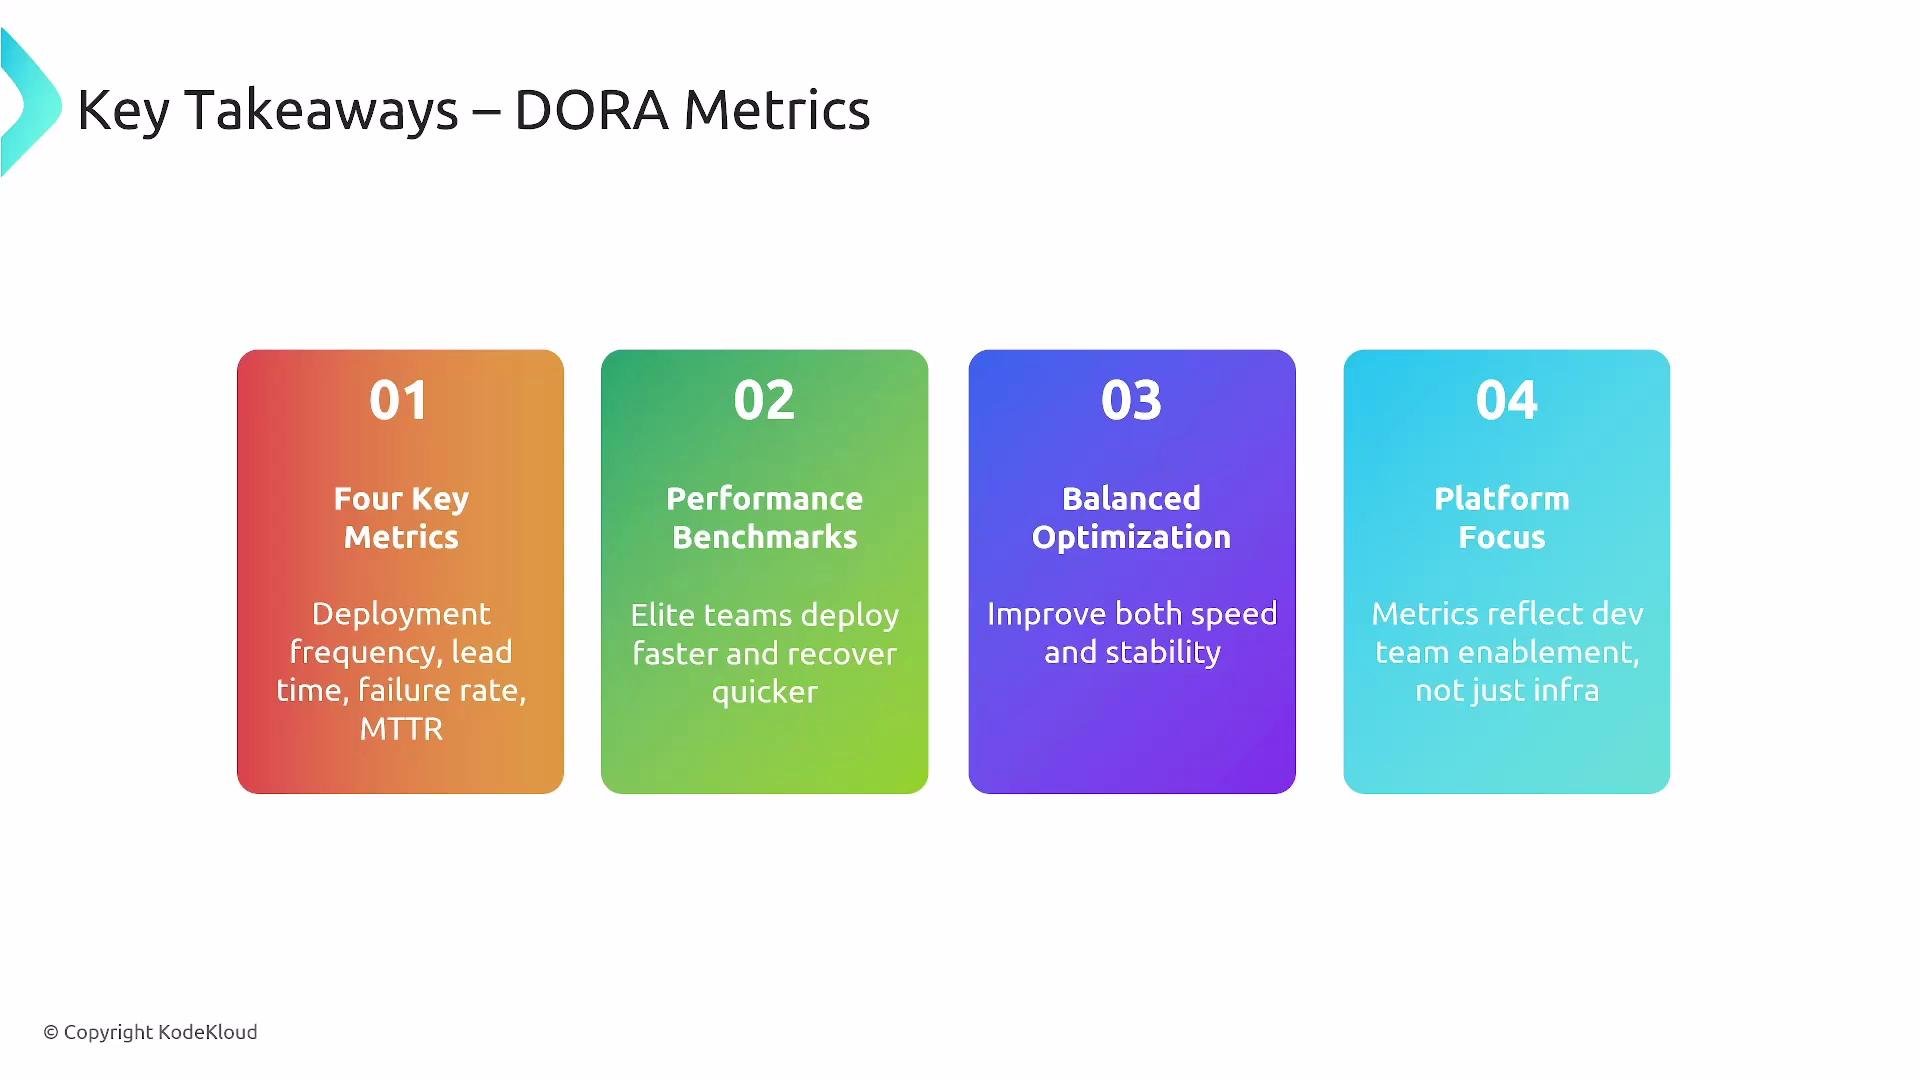
Key takeaways
- Core DORA metrics: Deployment Frequency, Lead Time for Changes, Change Failure Rate, MTTR.
- Elite teams: frequent deploys, short lead times (often
<1 hour), low failure rates (0–15%), and short MTTR (often<1 hour). - Balance velocity and stability — platform engineering should enable faster delivery while maintaining reliability.
- Use CNCF and ecosystem tooling to collect, correlate, and display metrics, and review them regularly to drive business-aligned improvements.
- DORA / DevOps Research and Assessment: https://cloud.google.com/blog/topics/devops-sre
- GitOps with Argo CD course: https://learn.kodekloud.com/user/courses/gitops-with-argocd
- GitOps with Flux course: https://learn.kodekloud.com/user/courses/gitops-with-fluxcd
- Prometheus Certified Associate course: https://learn.kodekloud.com/user/courses/prometheus-certified-associate-pca
- OpenTelemetry course: https://learn.kodekloud.com/user/courses/prep-course-opentelemetry-certified-associate-certification-otca
- Grafana / Loki course: https://learn.kodekloud.com/user/courses/grafana-loki
- GitHub Actions course: https://learn.kodekloud.com/user/courses/github-actions
- GitLab CI course: https://learn.kodekloud.com/user/courses/gitlab-ci-cd-architecting-deploying-and-optimizing-pipelines