

Inspect cluster services
Kubernetes Services define how pods communicate inside the cluster and how traffic is routed to workloads. To list services across all namespaces run:istio-ingressgateway service in the istio-system namespace. It uses type ClusterIP and exposes ports 80 and 443. A ClusterIP service is reachable only from within the cluster by default — it is not exposed to your local machine or the internet.
Create a local proxy with kubectl port-forward
To reach the Kubeflow UI from your workstation, forward a local port to the service port inside the cluster. Set the Istio namespace and run a port-forward from your local port 8080 to the service port 80:http://localhost:8080 to the ingress gateway’s port 80 inside the cluster. Once the port-forward is running, open your browser to http://localhost:8080 to reach the Kubeflow Central Dashboard.
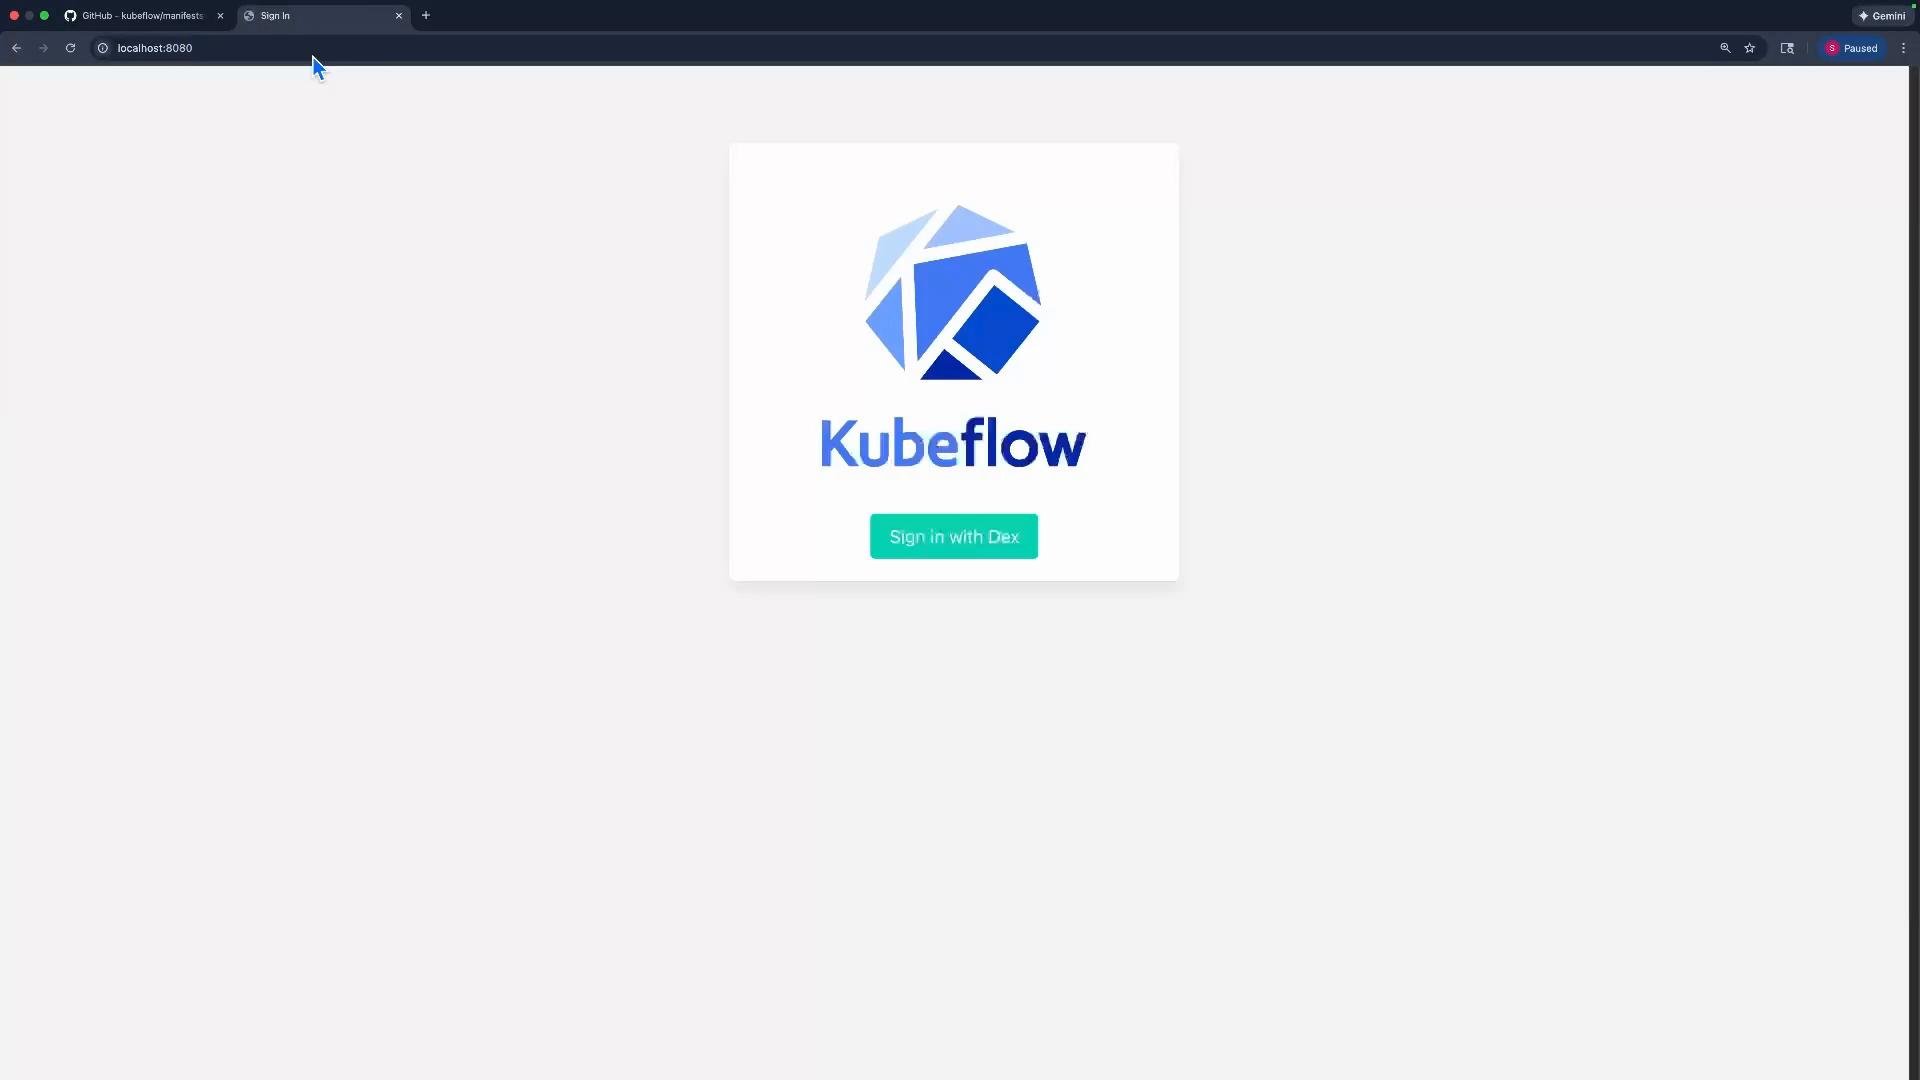
Do not use default demo credentials for production clusters. Always secure the dashboard with proper authentication and rotate default accounts. If you expose the ingress gateway publicly, ensure you configure strong authentication, TLS, and network controls.
If you need public access (not recommended for production without proper auth), you can expose the ingress gateway via a
LoadBalancer service or configure an external reverse proxy. For most local admin tasks, kubectl port-forward is the simplest and safest approach.Overview: Kubeflow Central Dashboard
After authenticating, the Kubeflow Central Dashboard provides a namespace-aware overview of Kubeflow components, quick links, and recent activity. It is the central place to monitor and manage notebooks, pipelines, experiments, and model serving. Notebooks is where you create and manage Jupyter instances (and other notebook types) that run in your cluster: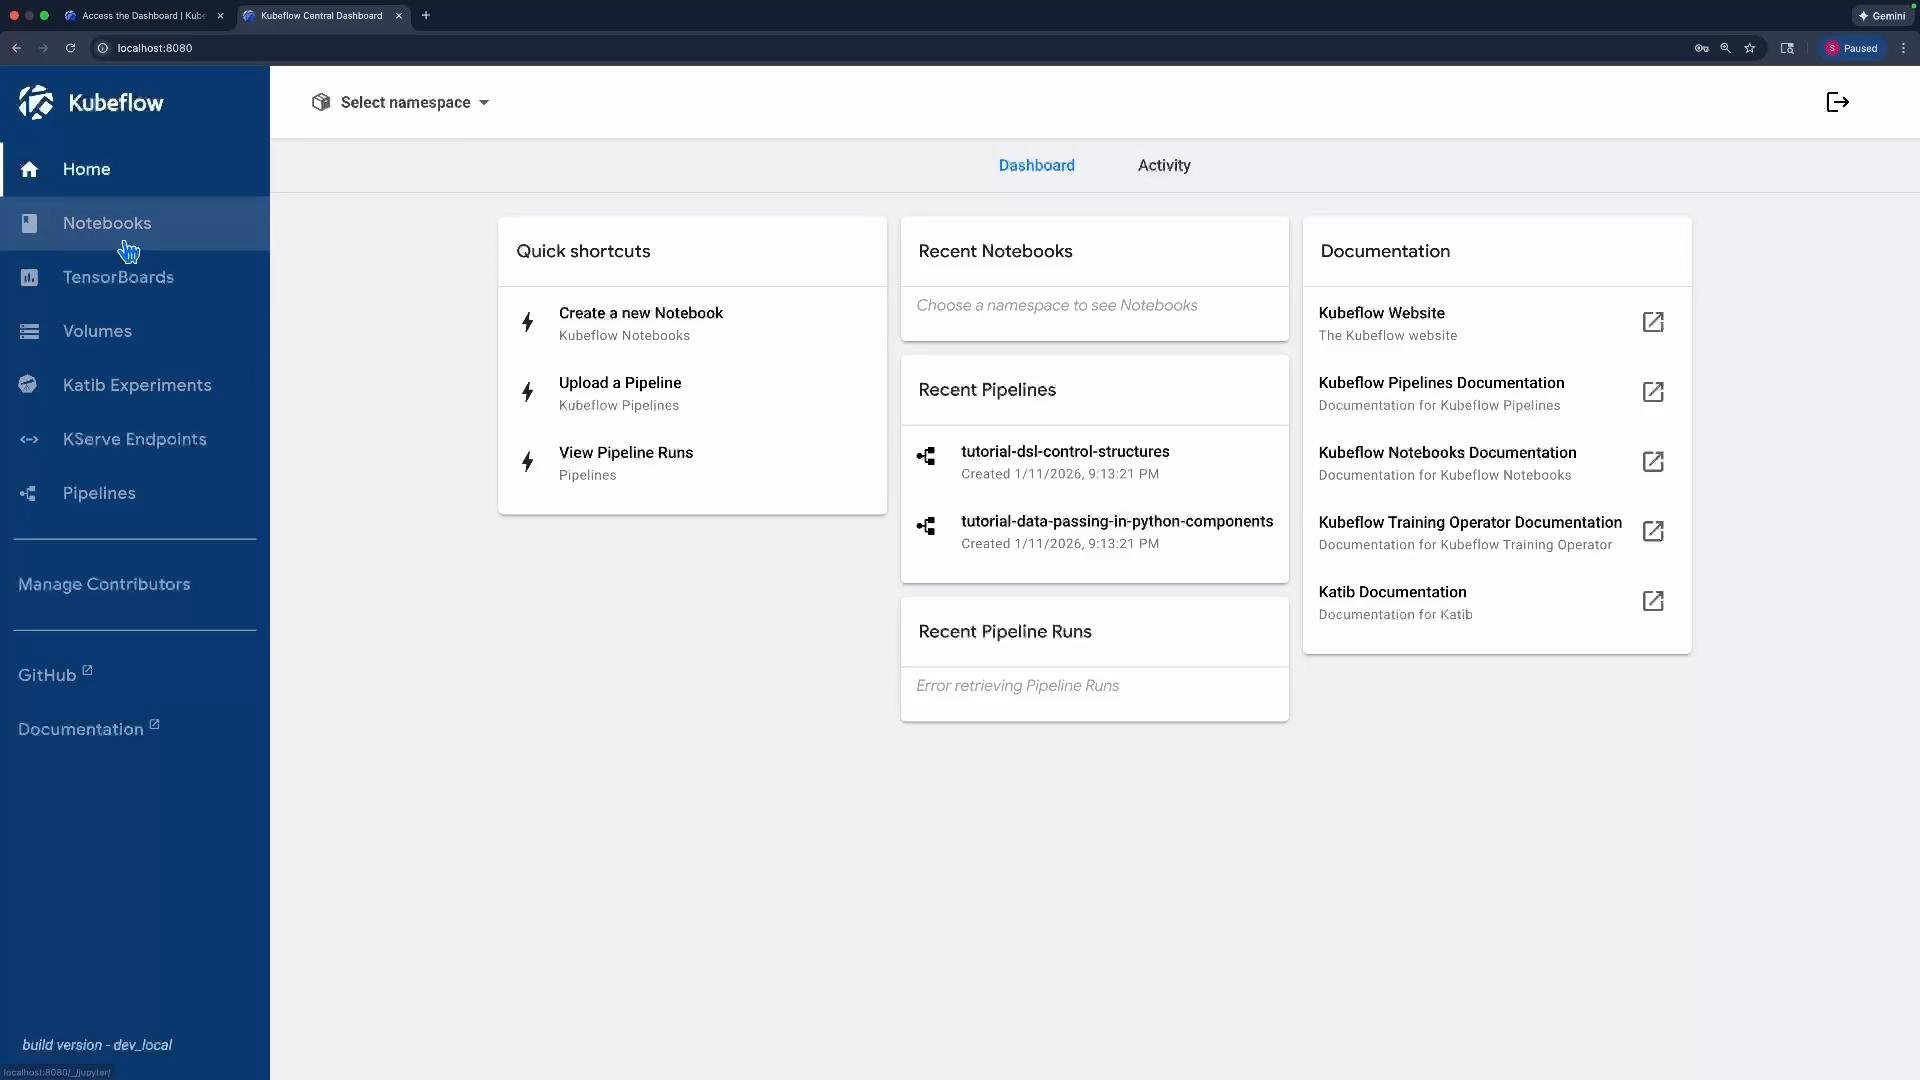
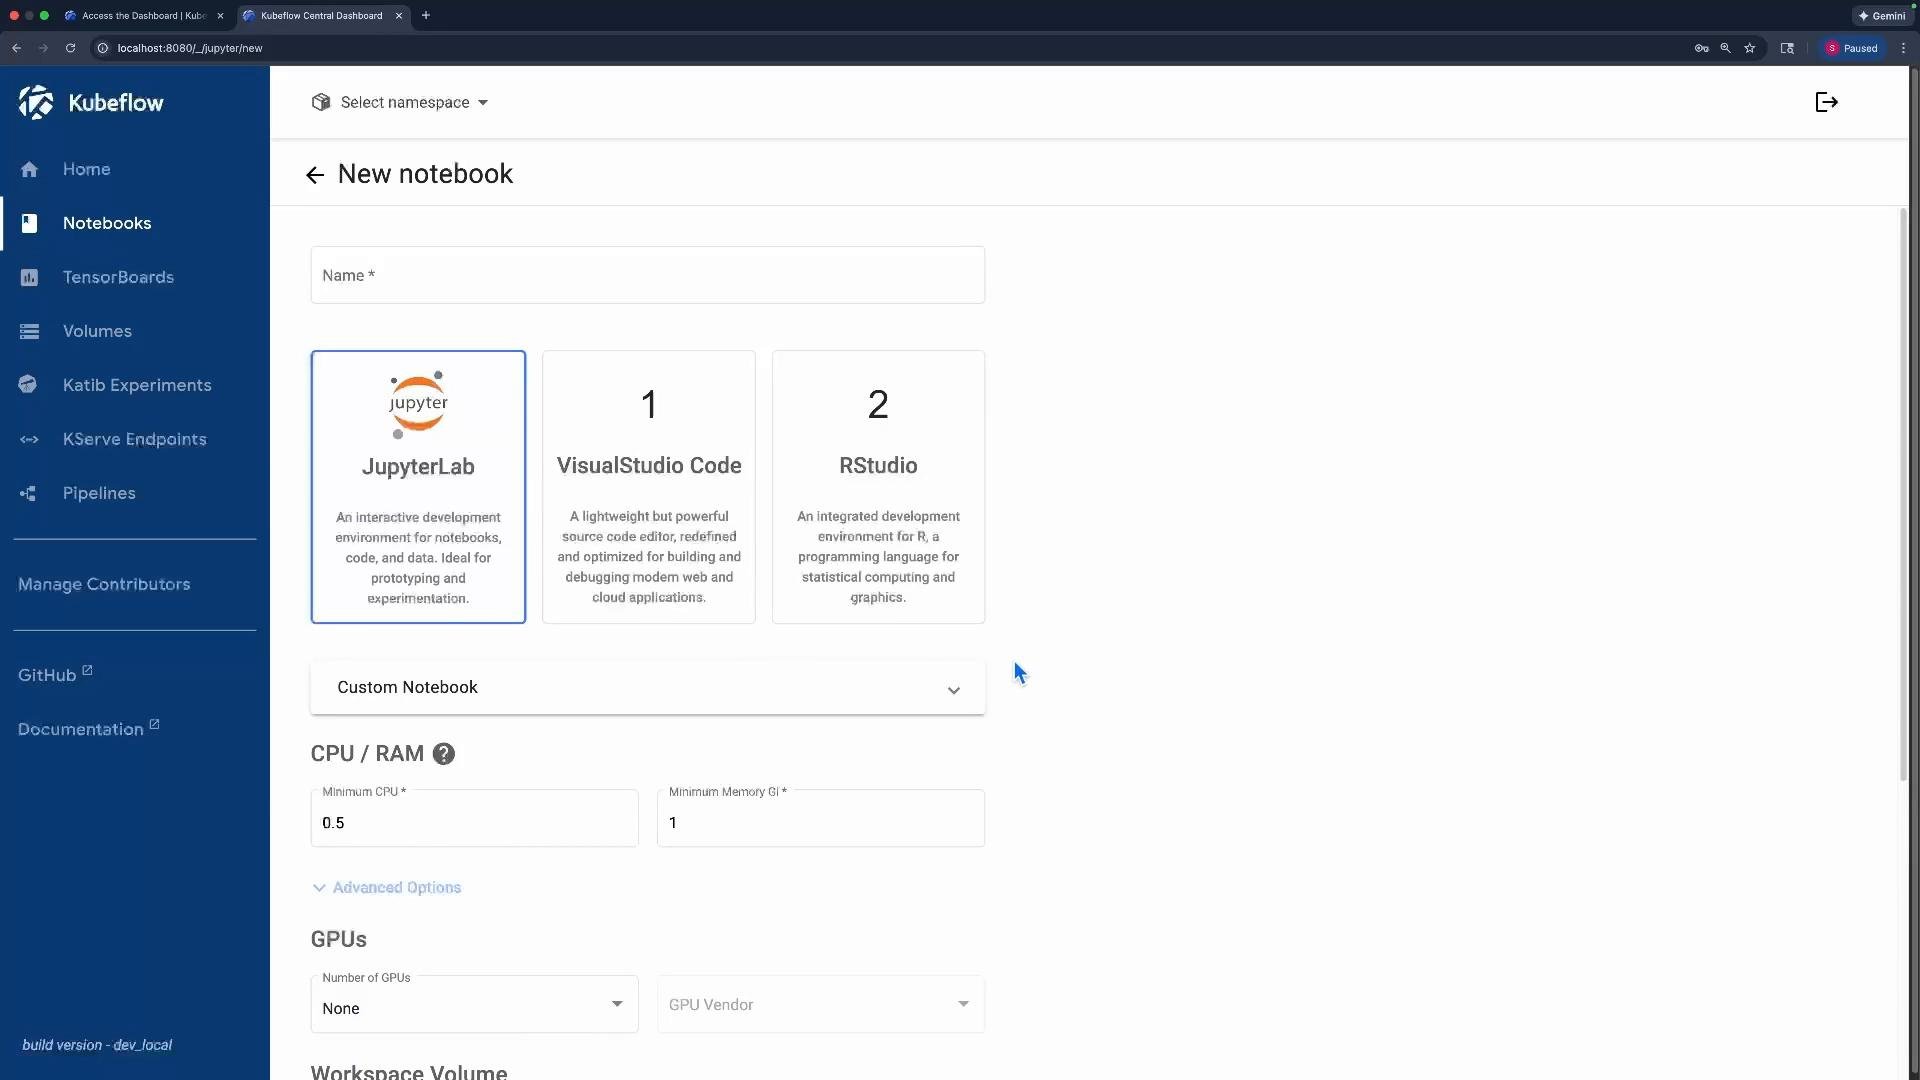
![A screenshot of the Kubeflow Pipelines web UI showing a pipeline graph titled "[Tutorial] DSL - Control structures" with nodes labeled exit-handler-1, flip-coin-op, print-op, and for-loop-3. The left sidebar shows navigation items like Home, Notebooks, and Pipelines.](https://mintcdn.com/kodekloud-c4ac6d9a/MGkgrGfKHDtoCnUb/images/Kubeflow/Working-With-Kubeflow/Demo-Accessing-UI/kubeflow-pipelines-dsl-control-structures-ui.jpg?fit=max&auto=format&n=MGkgrGfKHDtoCnUb&q=85&s=fe545001f8daeb43c26166deb3ef5bca)
Later you’ll get hands-on experience creating notebooks, running pipelines, tuning models with Katib, and deploying models with KServe. The Kubeflow Central Dashboard is the primary UI for monitoring and managing these activities.
Links and references
- Kubeflow Dashboard Access: https://www.kubeflow.org/docs/components/central-dashboards/
- Kubernetes Services overview: https://kubernetes.io/docs/concepts/services-networking/service/
- Kubeflow documentation: https://www.kubeflow.org/docs/