Enable Cilium, Operator and Hubble metrics via Helm values
Below is a concise values file example for the Cilium Helm chart. Adjust the metric families inhubble.metrics.enabled to match the observability needs for your cluster and Cilium version.
What these values do
Check the official Cilium/Hubble metrics documentation for the complete and up-to-date list of metric families and any changes to Helm values: https://docs.cilium.io/en/stable/observability/metrics/
Install or upgrade Cilium with the metrics values
Add the Cilium Helm repository, update it, and apply your values file to install or upgrade Cilium:Verify Prometheus discovery and dashboards
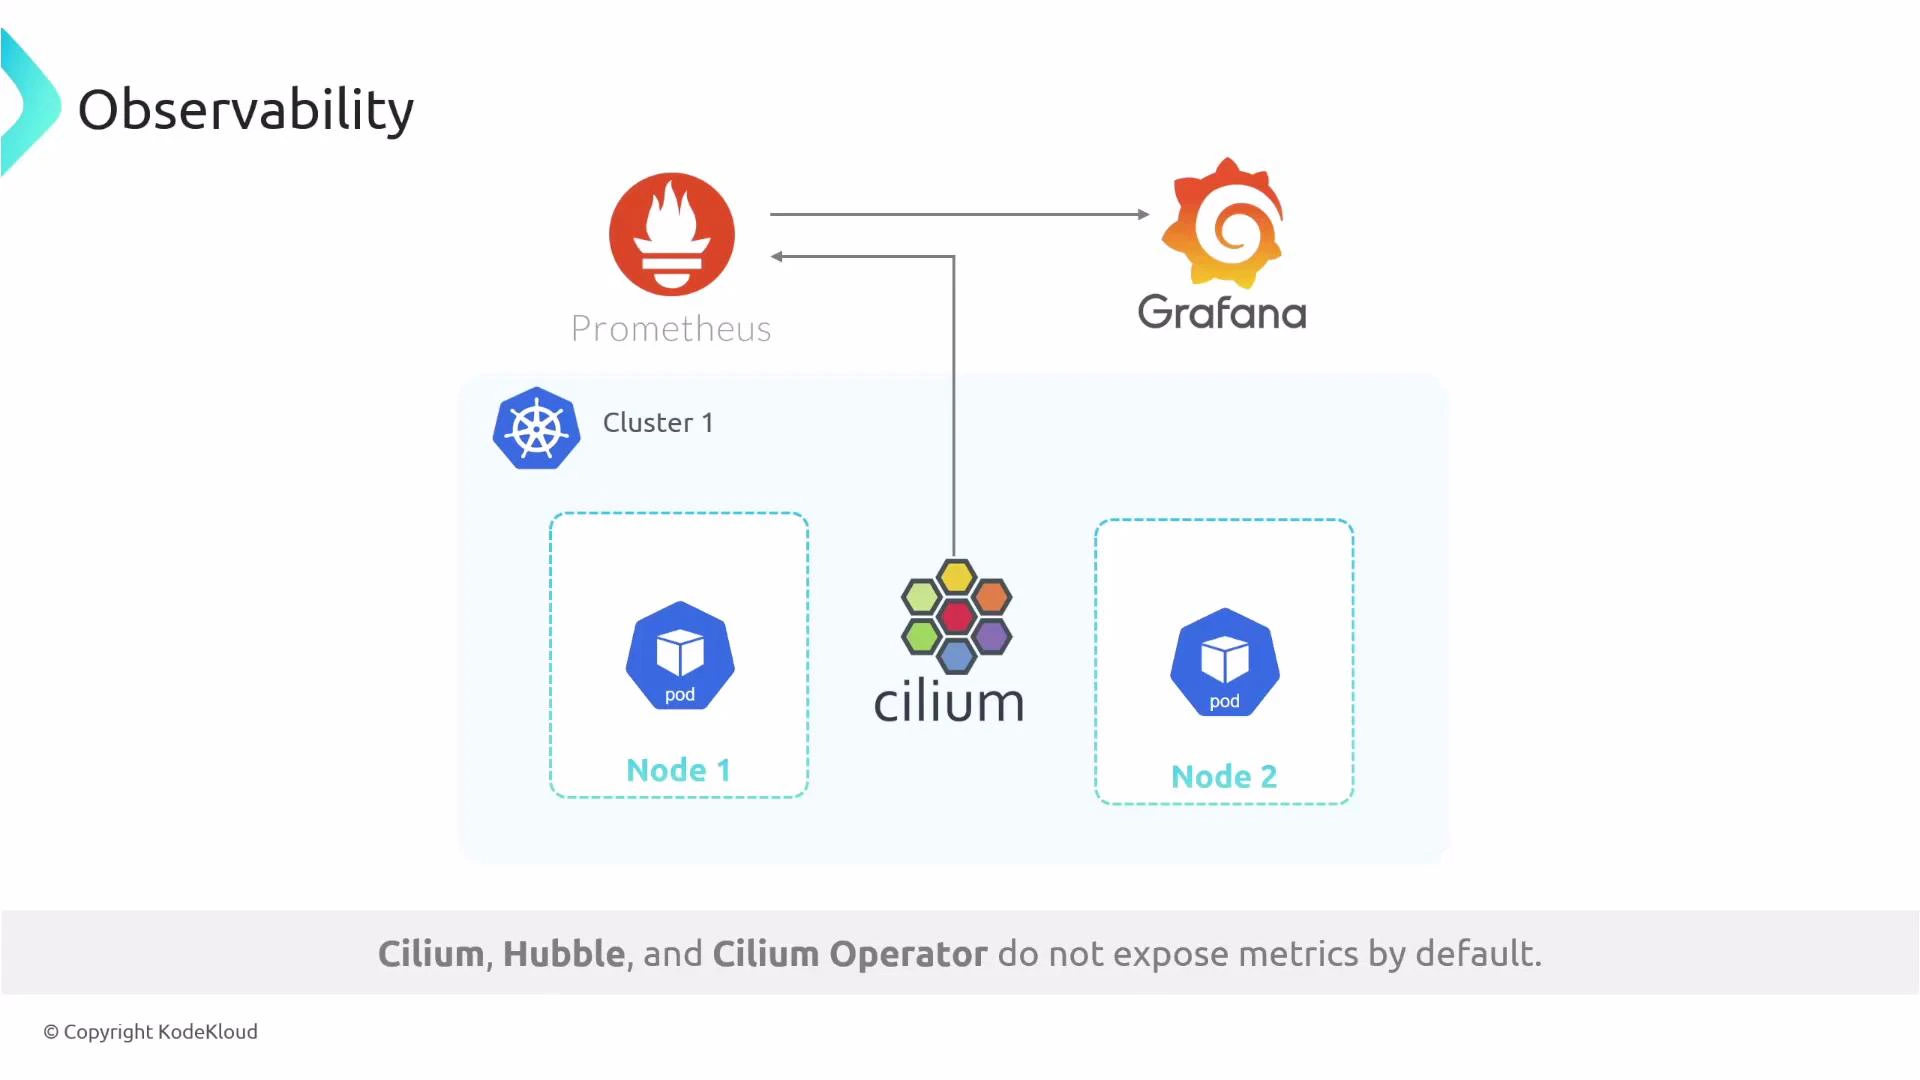
Steps to validate metrics collection and visualization:- Deploy Prometheus and Grafana (for example, via the kube-prometheus-stack) or use an existing Prometheus instance that can discover ServiceMonitors.
- If you use the Prometheus Operator / kube-prometheus-stack, the ServiceMonitors created by the Cilium chart will let Prometheus scrape Cilium, the operator, and Hubble.
- In the Prometheus UI navigate to Status → Targets and look for cilium-*, cilium-operator, and hubble targets. Confirm they are UP and being scraped.
- Import or create Grafana dashboards to visualize Cilium and Hubble metrics. There are community dashboards and templates for Cilium available that you can adapt.
Additional hands-on monitoring resources:
- Learn By Doing: AIOps Foundations - Intelligent Monitoring With Prometheus & Grafana: https://learn.kodekloud.com/user/courses/aiops-foundations-intelligent-monitoring-with-prometheus-grafana
Metric names and Helm values may change across Cilium releases. Always verify keys, supported metric families, and the values schema against the documentation for your specific Cilium version before applying changes in production.
Links and References
- Cilium observability & metrics: https://docs.cilium.io/en/stable/observability/metrics/
- Prometheus documentation: https://prometheus.io/docs/
- kube-prometheus-stack (Prometheus Operator): https://github.com/prometheus-community/helm-charts/tree/main/charts/kube-prometheus-stack
- Grafana: https://grafana.com/
- Helm: https://helm.sh/