

Use this 3-step framework as a template you can adapt to any team or organization: 1) Qualify the problem, 2) Define the solution, and 3) Calculate ROI. Keep assumptions explicit to make the analysis credible.
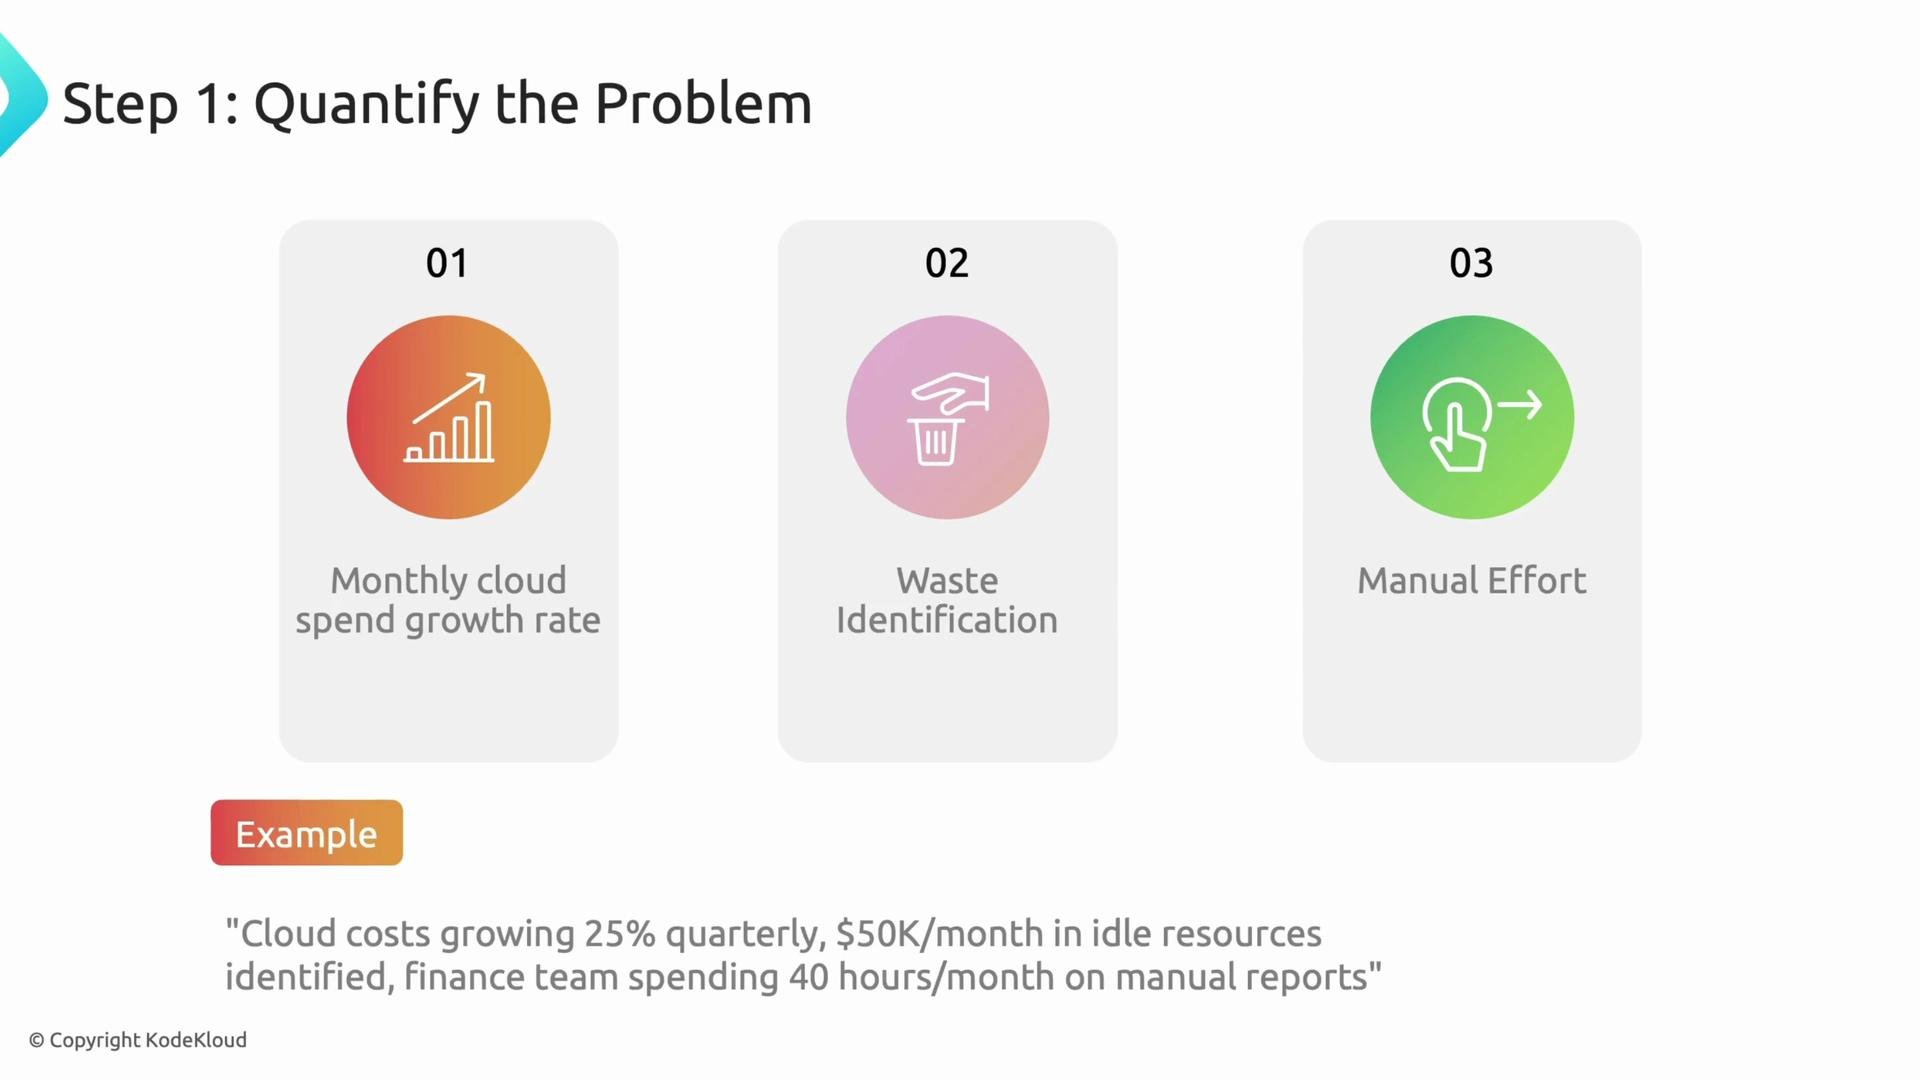
Step 1 — Qualify the problem
Start by proving the problem with measurable signals. Focus on metrics that leadership cares about: cost trends, waste, and labor time. Key diagnostic questions- Why is the cloud bill growing quarter over quarter? Which services, teams, or environments are driving the trend?
- Where is waste appearing: idle resources, overprovisioned instances, unused licenses, orphaned storage, test artifacts?
- How much manual effort goes into reporting and reconciliation each month?
- Cloud costs are growing 25% quarter-over-quarter.
- We are spending approximately $50k/month on idle or zombie resources.
- Finance or IT spends 40 hours/month producing and reconciling cost reports.
Step 2 — Define the solution
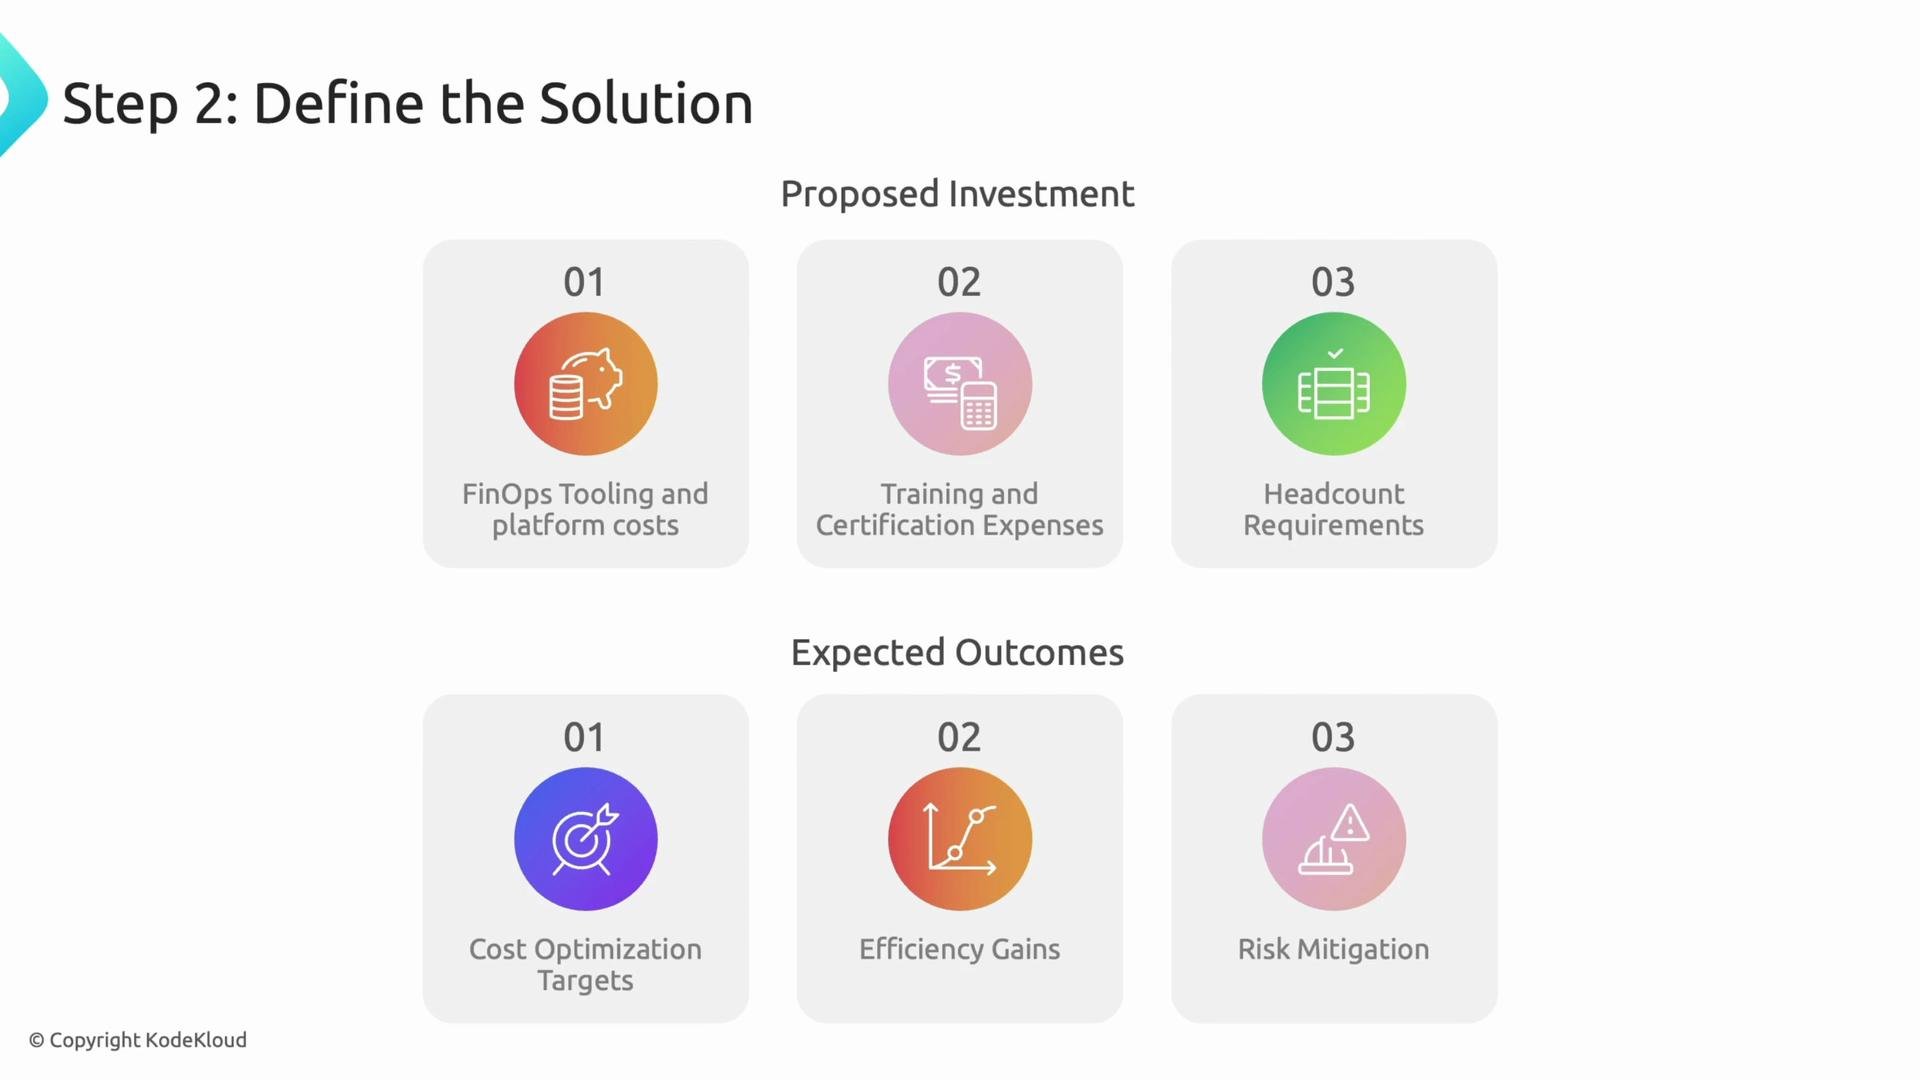
Translate the problem into a scoped, realistic solution. Present both the investments required and the expected outcomes — be specific about assumptions. Solution components to include- Tooling/platform: cost-monitoring, cloud governance, rightsizing, or tagging tools.
- Upskilling: training, certification, or upskilling current staff in FinOps practices.
- Headcount: dedicated roles (e.g., 1–2 FinOps practitioners or part-time allocation).
- Process: tagging governance, budgeting & forecasting cadence, and automation of reporting.
- Unit cost (tool license, training cost, salary)
- Implementation effort/time
- Expected impact (e.g., % waste reduction, hours saved per month)
- Tooling cost:
$X/month - Headcount:
1 FTEat$Y/year - Expected impact:
20% reduction in waste,50% reduction in manual reporting hours
Step 3 — Calculate ROI
Leadership wants clear, measurable outcomes and a payback estimate. Break benefits into categories and use a straightforward calculation to quantify value. Benefit categories- Direct cost savings: rightsizing, turning off idle resources, reclaiming licenses.
- Avoided costs: fewer surprise bills and capacity-related incidents.
- Productivity gains: hours saved from automation and faster decision-making.
- Risk reduction: better governance, compliance, and forecasting.
Example (rounded numbers)
- Annual direct savings from rightsizing:
$240,000(20% of $1.2M annual waste) - Productivity/value of automation:
$60,000(40 hours/month saved × fully loaded hourly rate) - Annual program cost:
$120,000(tools + 1 FTE + training) - Annual benefits =
$240,000 + $60,000 = $300,000 - Net benefit =
$300,000 − $120,000 = $180,000 - Monthly net savings =
$15,000 - If initial implementation investment =
$60,000, payback period =4 months
If the payback period is under 6 months, the proposal is typically much easier to approve. Show sensitivity (e.g., 10% vs 30% waste reduction) so leadership sees optimistic and conservative outcomes.
Putting it together — Slides and storytelling
Structure your business-case slide deck so reviewers can scan quickly:- Executive summary: one-slide problem → ask → expected payback.
- Problem evidence: key metrics and trends (use visuals).
- Proposed solution: investments, roles, and timeline.
- Financials: ROI, sensitivity analysis, and payback.
- Risks & mitigations: what could affect outcomes and how you’ll address them.
- Ask: exact funding, time, or headcount you need and the decision you want.