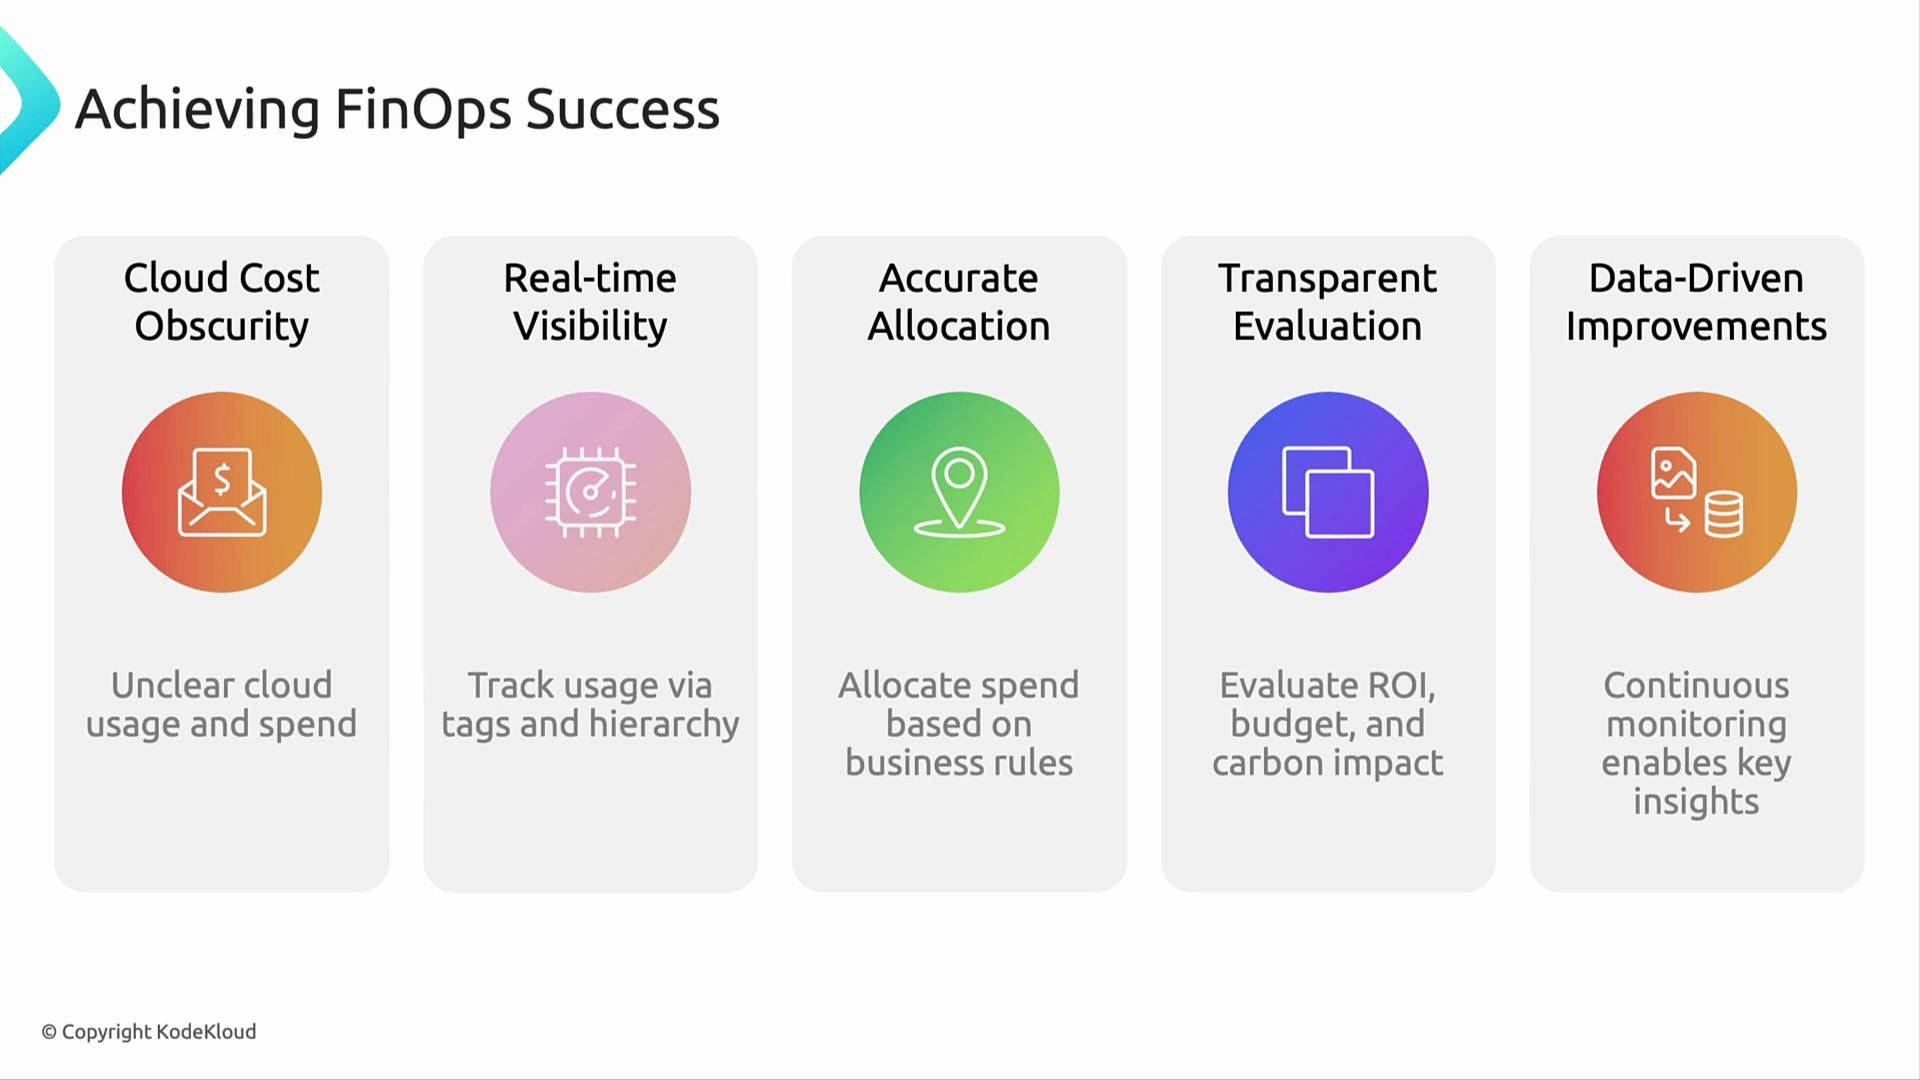
Welcome back. In this lesson we cover three central FinOps phases—Inform, Optimize, and Operate—with a focus on how to adopt each phase across your organization using the FinOps framework. This page drills into the Inform phase: why it matters, the common challenges organizations face, and practical patterns for moving from visibility to actionable cost intelligence. Inform Phase — five critical pillars The Inform phase is the foundation of cloud financial management. Its goal is to create visibility and context for cloud spend so teams can make accountable, data-driven decisions. Organizations commonly encounter five critical challenges when standing up the Inform phase:
  • Cloud cost obscurity
    Missing or inconsistent tagging, lack of cost allocation rules, and fragmented reporting make it hard to know what teams and projects are spending.
  • Near-real-time visibility
    Timely insights are crucial. Using tags and hierarchical reporting enables slicing costs by business unit, project, environment, or other dimensions for proactive cost control.
  • Accurate allocation
    A consistent allocation methodology is required to attribute shared resources, reserved/spot instances, and cross-team services to the correct owners.
  • Timely evaluation
    Evaluation should extend beyond budgets and ROI to include sustainability (carbon impact) and other non-financial metrics that influence cloud strategy.
  • Data-driven improvements
    Visibility must be paired with continuous refinement—reporting, tagging, and allocation rules must evolve to stay relevant and actionable.
Often organizations begin with no formal FinOps function and ad-hoc cost work spread across teams. Establishing a dedicated FinOps team is typically the first formal step: centralizing efforts to close cost leakages, standardize tagging, and build governance and reporting practices. That is the core purpose of the Inform phase.
PillarProblemRecommended first actions
Cloud cost obscurityInconsistent tags and unknown spendDefine a minimal mandatory tag set; map existing resources to business units
Near-real-time visibilitySlow or noisy reportsDeploy automated cost exports and streaming metrics where possible
Accurate allocationShared resources with no rulesCreate and document allocation rules (by CPU, usage, seats)
Timely evaluationNarrow KPIs (only spend)Add sustainability and utilization KPIs to financial reviews
Data-driven improvementsStale or irrelevant dataEstablish cadence for report review and tag/metric refinement
The image presents a guide titled "Achieving FinOps Success," outlining five key areas: Cloud Cost Obscurity, Real-time Visibility, Accurate Allocation, Transparent Evaluation, and Data-Driven Improvements. Each area includes a brief description and an icon.
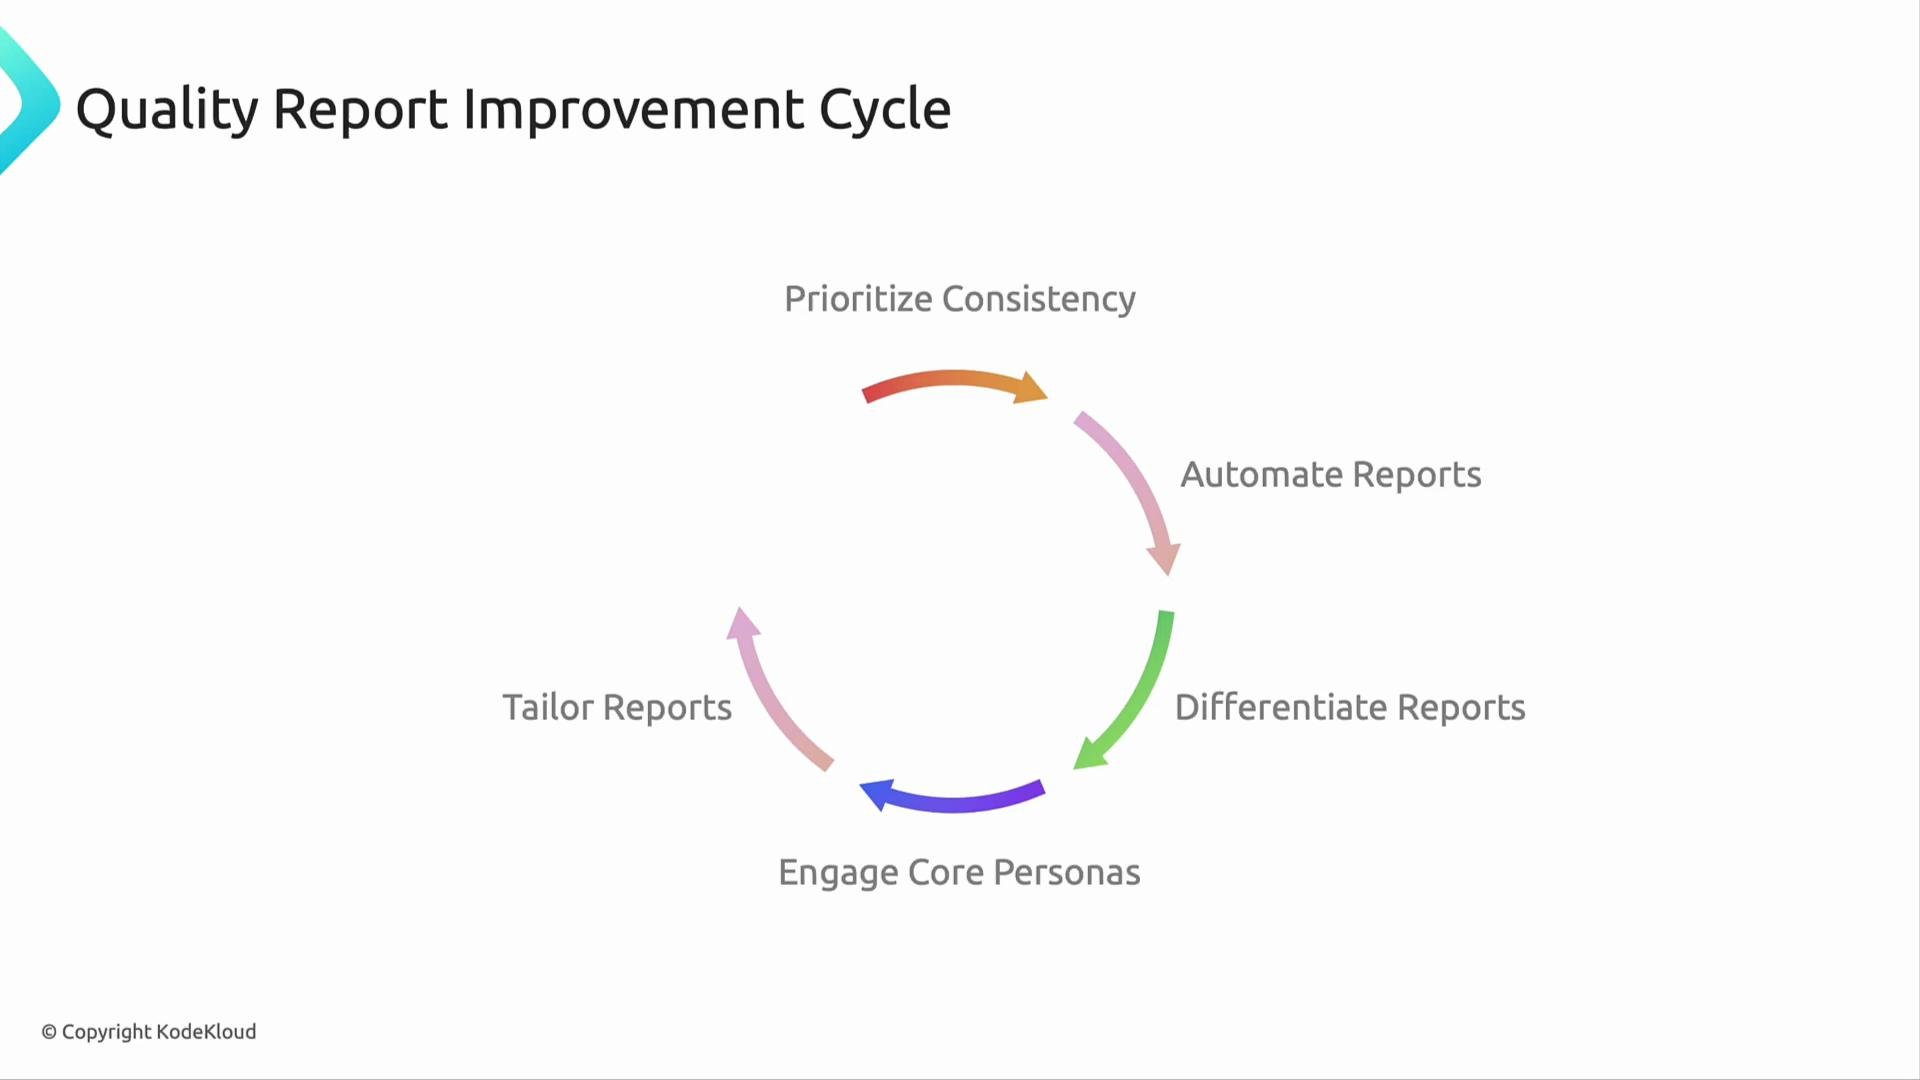
Quality Report Improvement Cycle To progress from raw visibility to operational intelligence, implement a repeatable Quality Report Improvement Cycle. Follow these steps to ensure reports remain accurate, useful, and tailored to their audience:
  1. Prioritize consistency
    Standardize reporting metrics, naming conventions, and data collection across teams and cloud providers. Consistent inputs enable meaningful comparisons over time.
  2. Automate reports
    Remove manual processes by building automated dashboards, scheduled exports, and alerts. Use native provider tools like AWS Cost Explorer and Azure Cost Management, or third-party platforms such as CloudHealth or CloudCheckr.
  3. Differentiate reports
    Tailor the same underlying dataset for different audiences: executives need trend and variance insights, while engineering teams need resource-level drill-downs and optimization recommendations.
  4. Engage core personas
    Collaborate with engineering, finance, and business leaders on report design and cadence to ensure relevance and encourage responsible consumption.
  5. Tailor external outputs when required
    When third parties (consultants, auditors, or partners) need access, deliver automated, pre-formatted reports and define secure delivery channels.
Keep reports simple, focused, and actionable: highlight top drivers, then enable drill-downs so users can trace root causes without sifting through noise.
The image depicts a cycle diagram titled "Quality Report Improvement Cycle," highlighting five steps: Prioritize Consistency, Automate Reports, Differentiate Reports, Engage Core Personas, and Tailor Reports.
FinOps cost visibility spectrum Understanding cost across multiple layers helps reconcile differences between list prices, prices you pay, and the economic cost to the business. Use this spectrum to interpret and present cost information accurately.
Visibility layerWhat it representsPractical use
Baseline pricing (list cost)Published on-demand rates from cloud providersUseful for quick comparisons and identifying pricing options
Negotiated pricing (contracted cost)Enterprise agreements, reserved instances, Savings PlansUse when modeling committed spend and negotiating renewals
Invoice amount (billed cost)Cash outflow on invoices including taxes and feesRequired for accounting and cash flow reporting
True economic cost (effective cost)Allocated cost after discounts, shared resources, and usage patternsBest for product-level decisions, ROI and per-unit costing (e.g., cost per transaction)
Understanding each layer enables more accurate forecasting, chargeback/showback, and product-level profitability analysis.
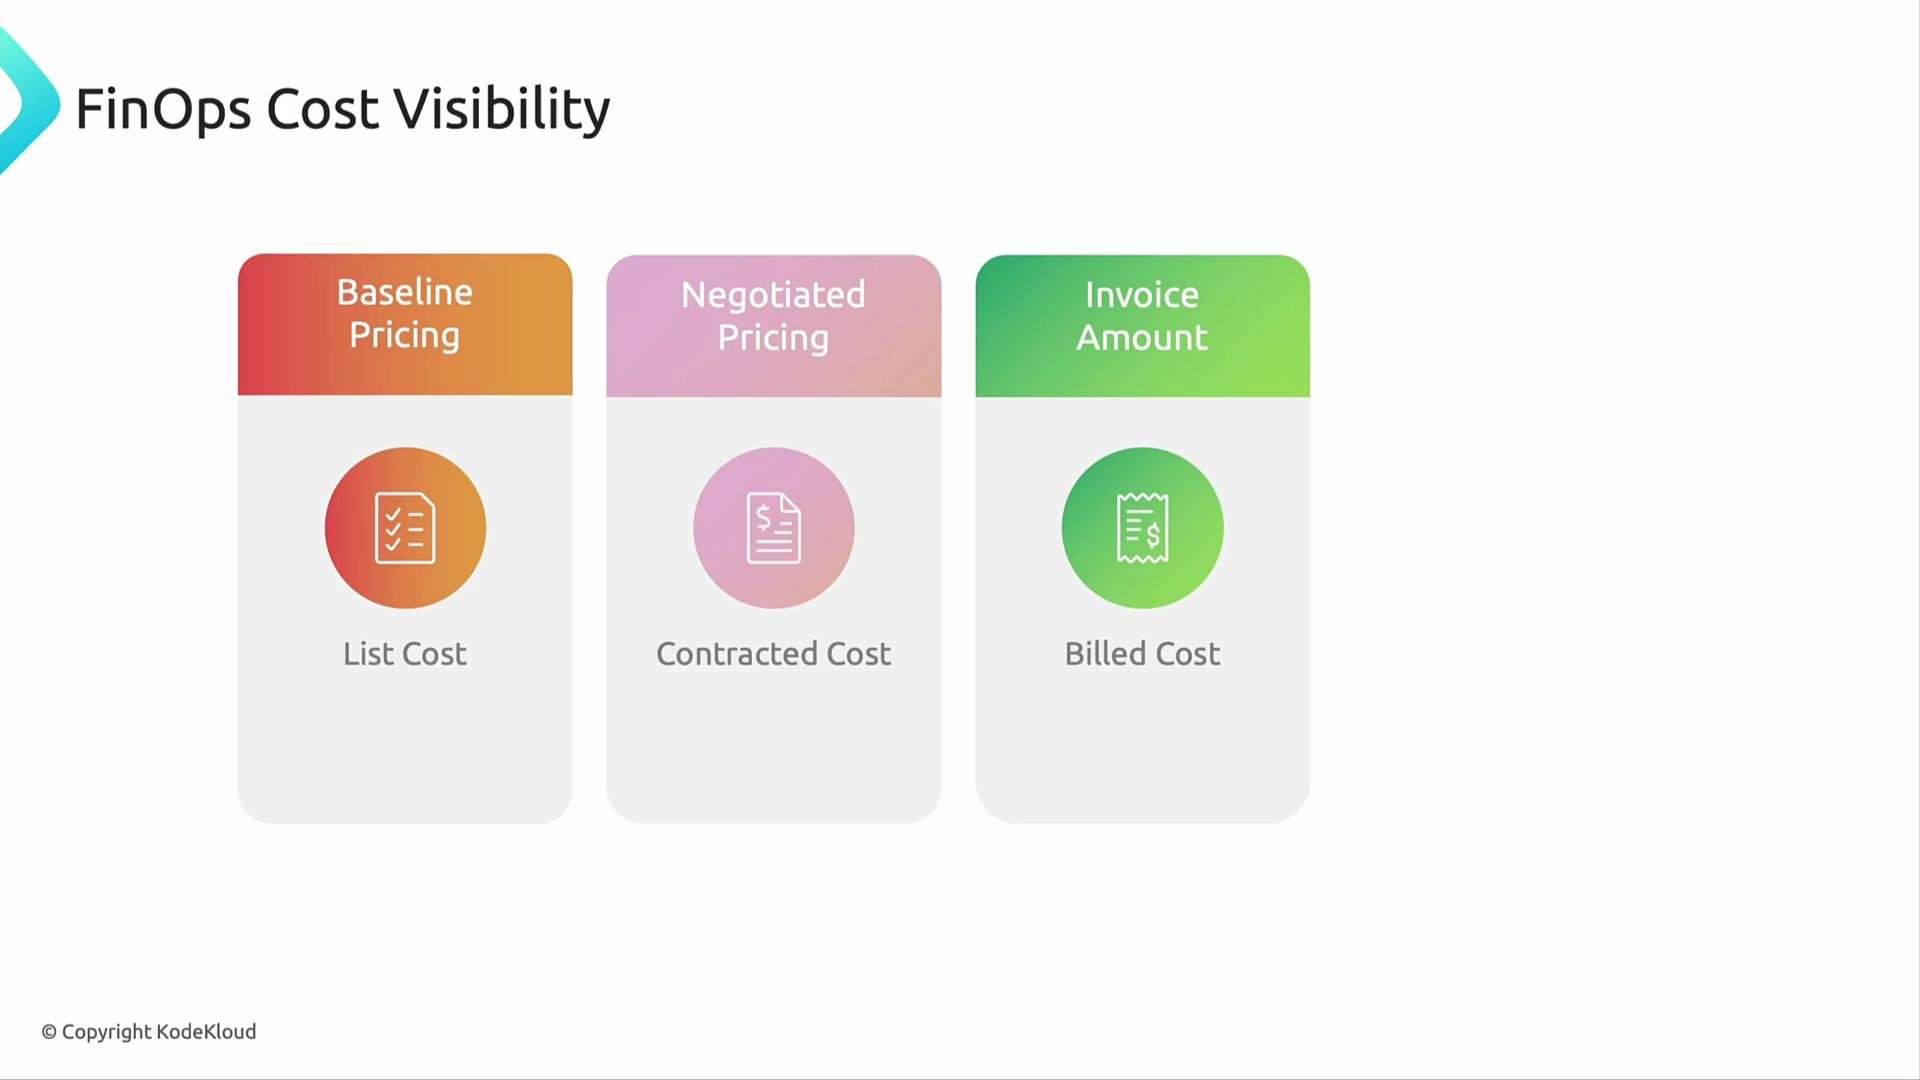
The image illustrates FinOps cost visibility with three sections: Baseline Pricing (List Cost), Negotiated Pricing (Contracted Cost), and Invoice Amount (Billed Cost).
Two fundamental best practices
  • Start with effective cost calculations
    From the outset, model effective cost rather than relying solely on list or billed prices. Effective cost includes reserved-instance amortization, allocation of shared services, and contract discounts—this gives teams an actionable baseline for optimization.
  • Use additional metrics beyond cost
    Combine cost with performance, utilization, efficiency ratios, and business outcomes. This multi-dimensional view enables trade-offs between cost, reliability, and speed of delivery.
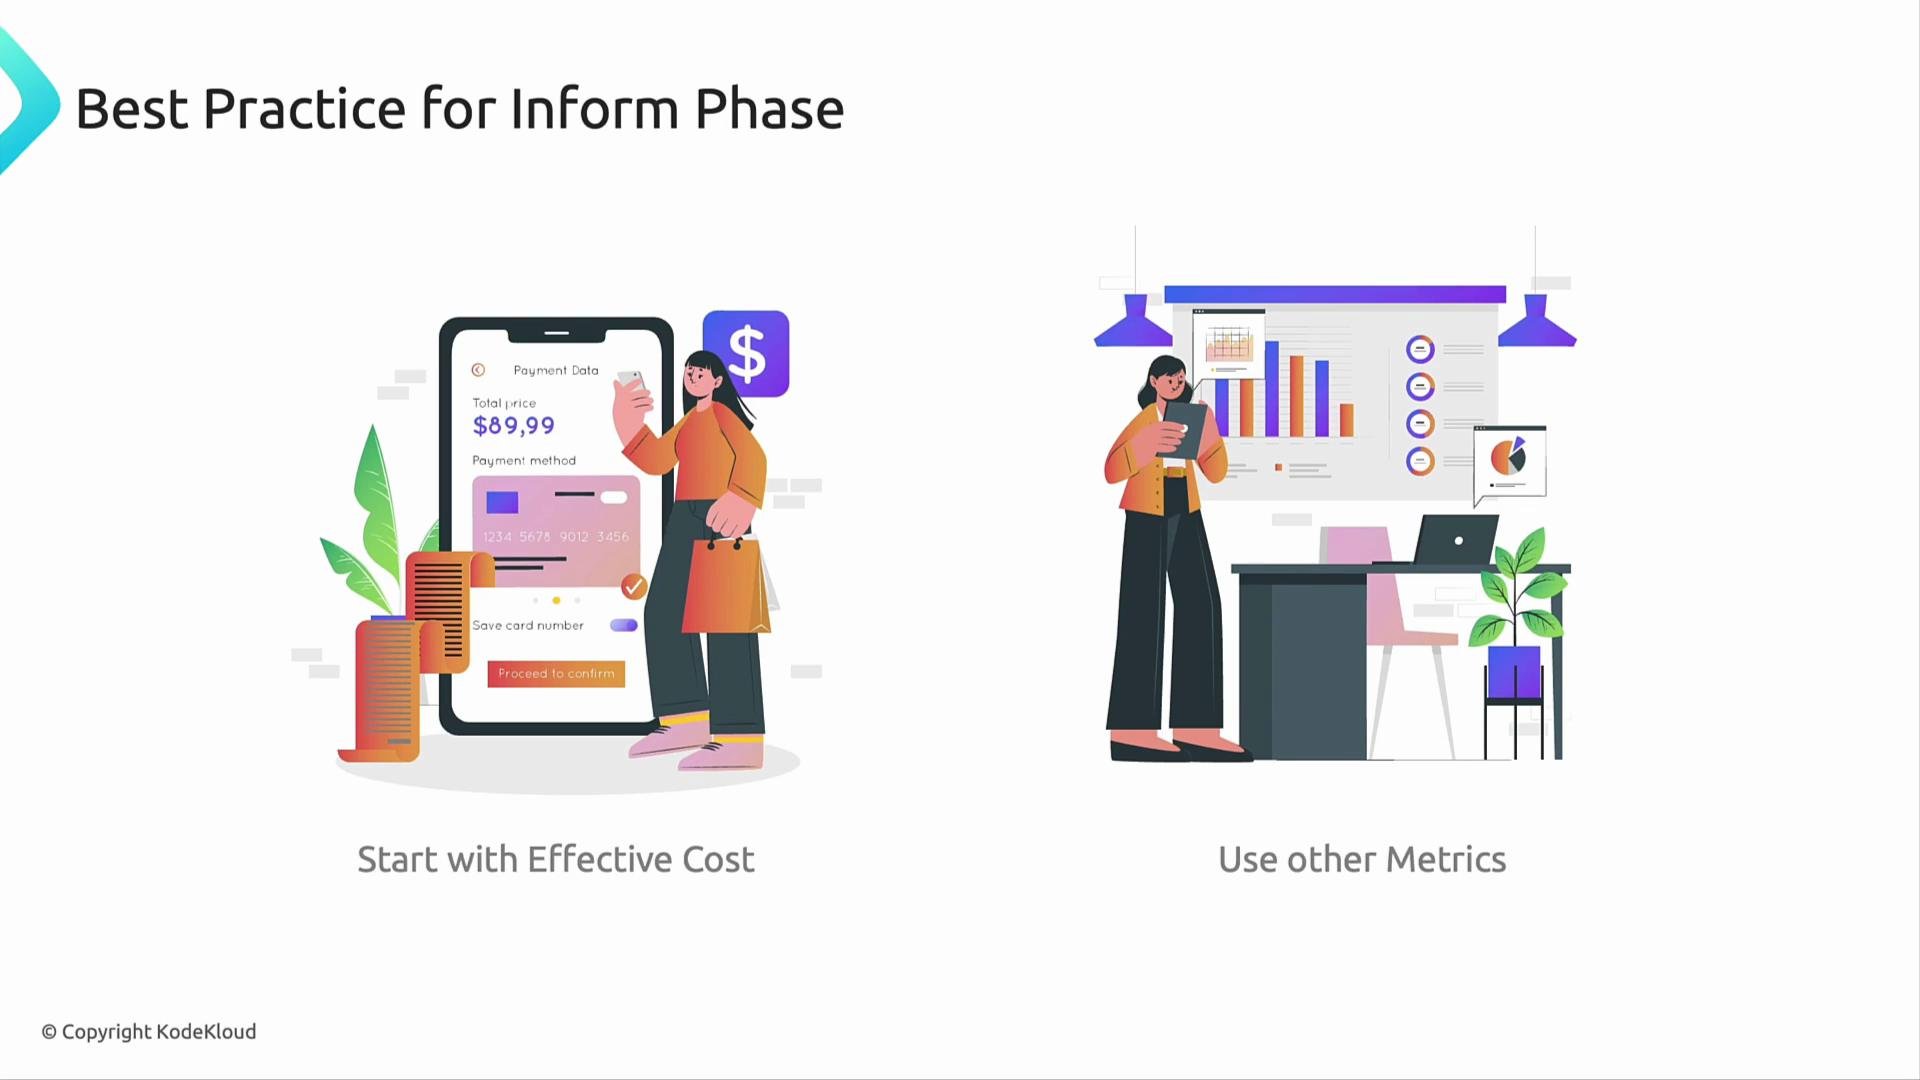
The image displays two illustrations: one of a person using a smartphone for payment with the text "Start with Effective Cost," and the other of a person analyzing data charts with the text "Use other Metrics."
Bottom line The Inform phase is about measurement and clarity—not perfection. Collect broad metrics, then iterate: refine tagging, reporting standards, and allocation rules so the data becomes progressively more accurate and actionable. Good FinOps begins with visibility, then builds governance and processes that enable continuous optimization.
Measure broadly and iteratively: initial measurements may be imperfect, but they are essential to enable optimization and accountability.
What’s next The Optimize phase uses the visibility and allocations you established in Inform to identify and implement cost-saving actions—right-sizing, purchasing strategies, workload schedule changes, and platform improvements. We will cover those tactics and how to prioritize them in the next lesson. Links and references

Watch Video