

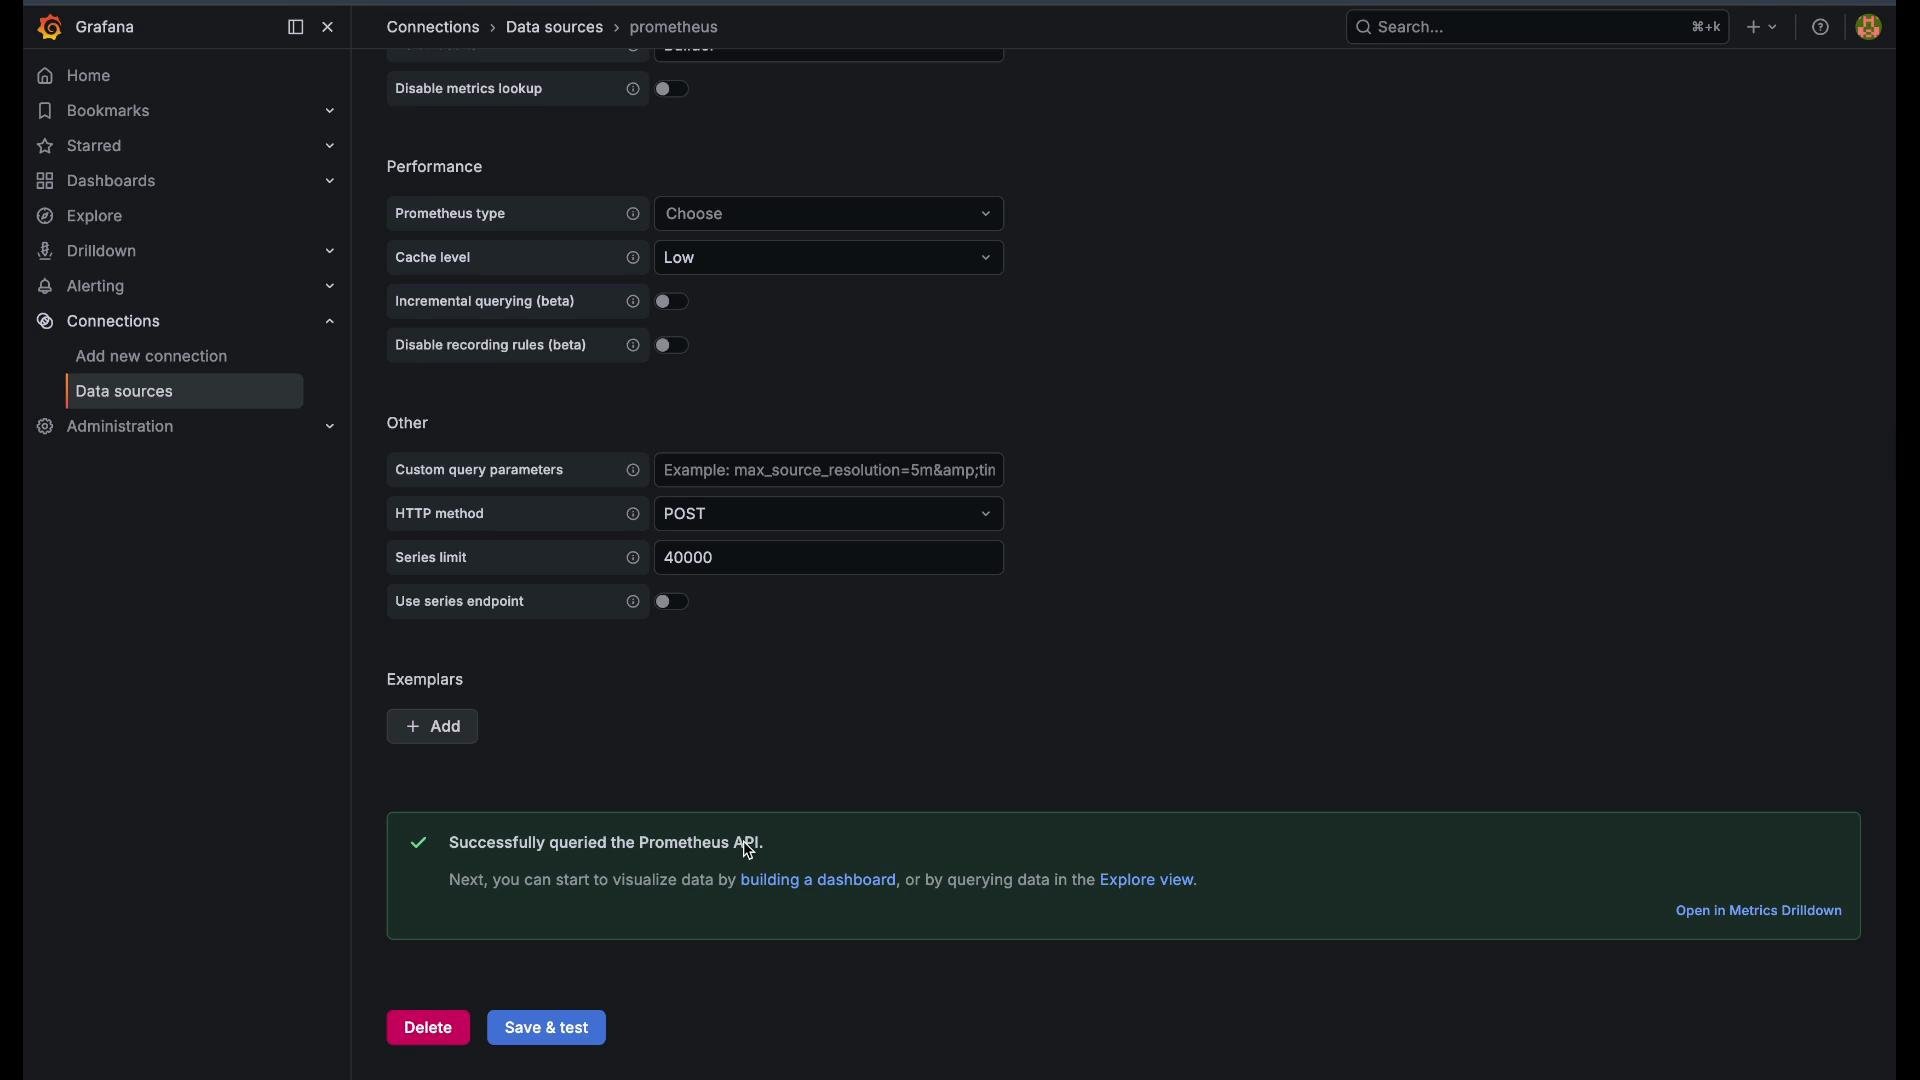
Before you begin, make sure a Prometheus data source is configured in Grafana. If you need setup guidance, see the Grafana data source docs.
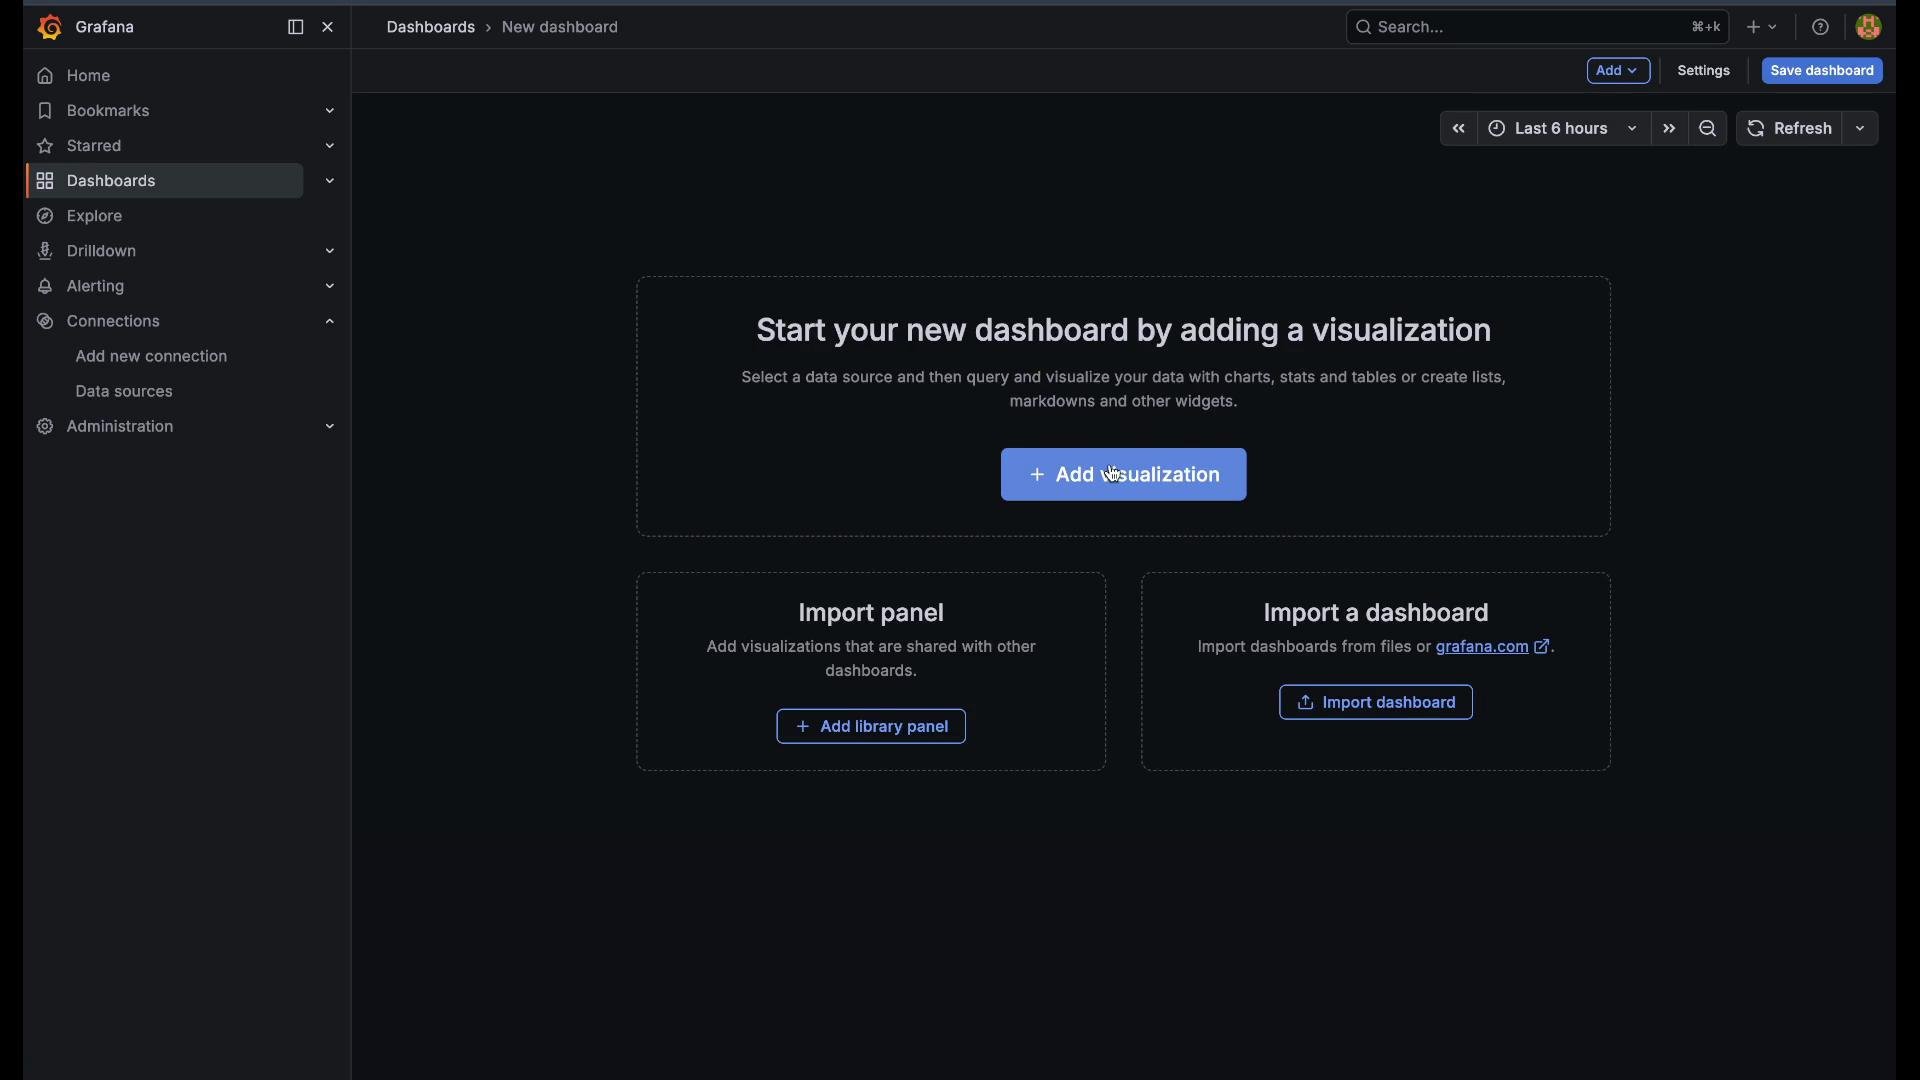
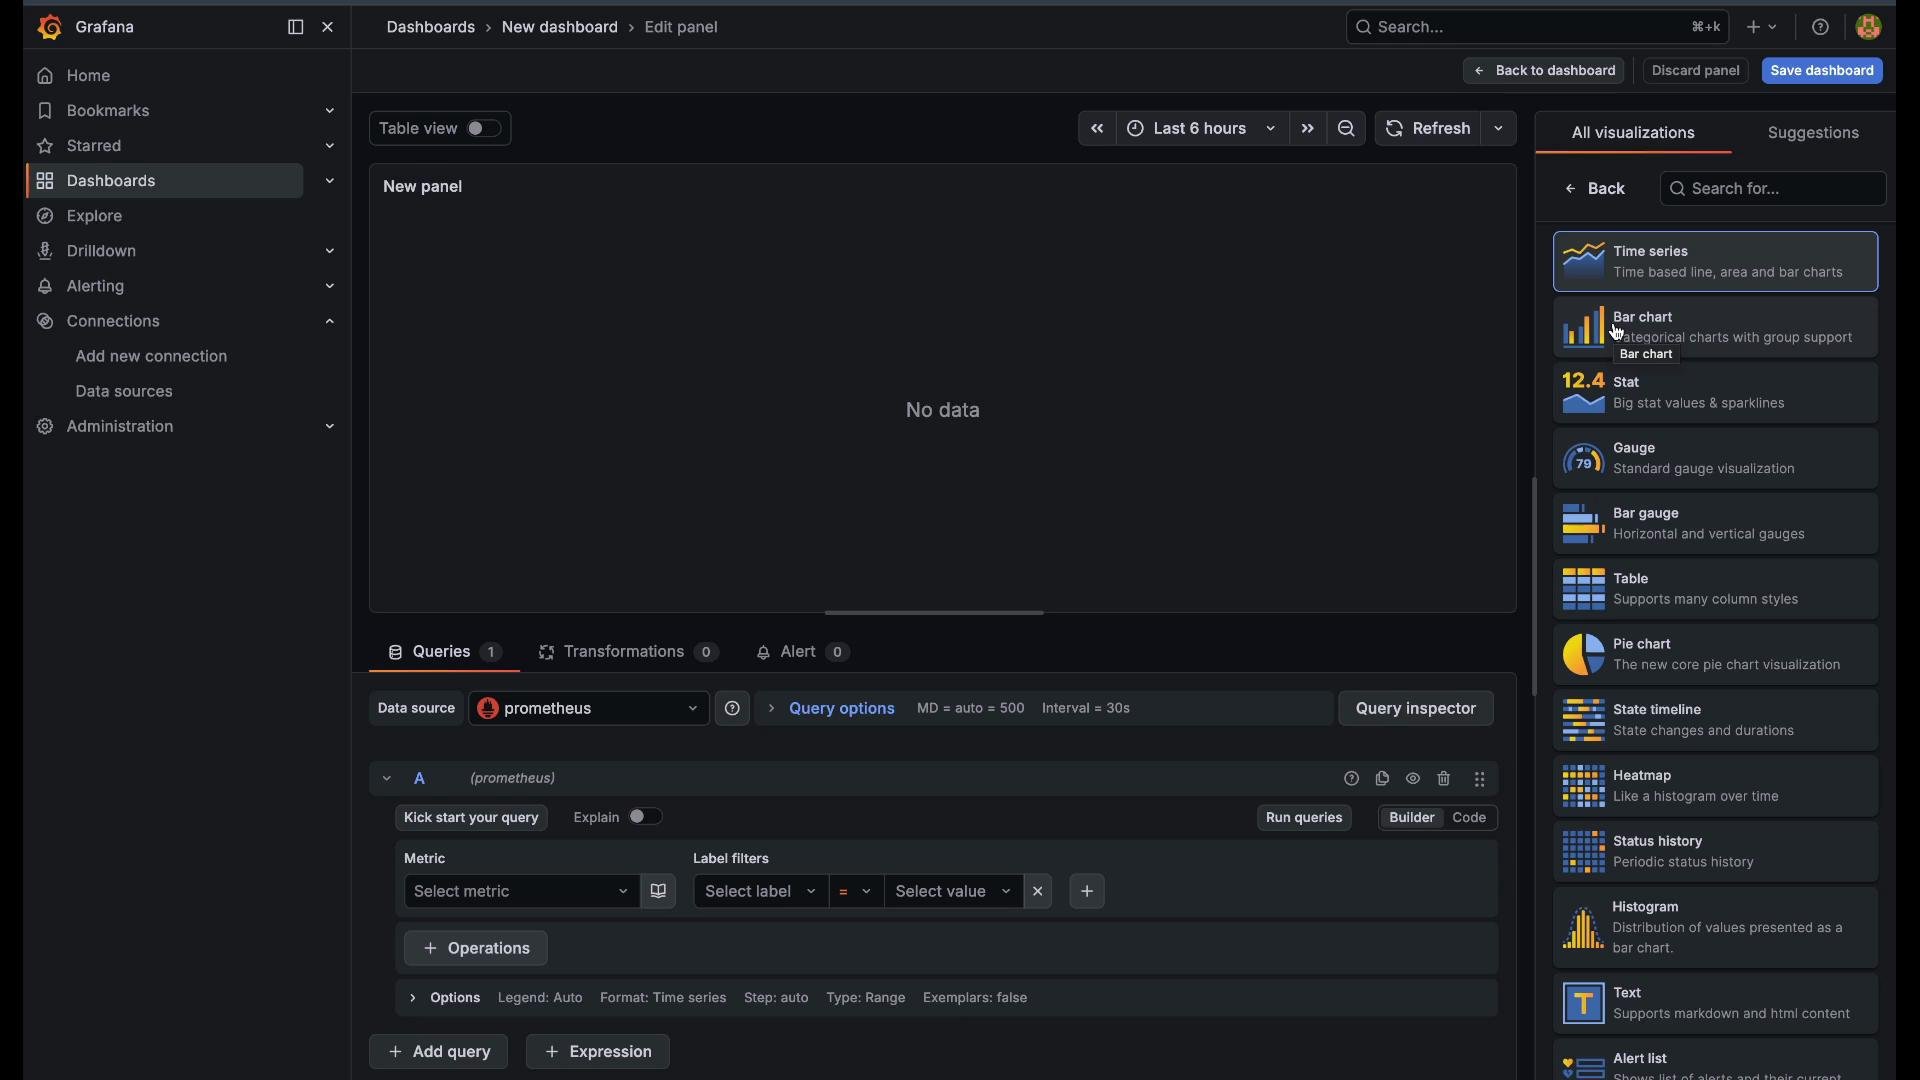
- Time series — Request rate per pod
- Use a Time series panel for trend analysis and per-entity lines.
- Select the Time series visualization and choose your Prometheus data source.
- Enter this PromQL to show request rate per pod over the last 5 minutes.
sum by (pod)yields one line per pod:
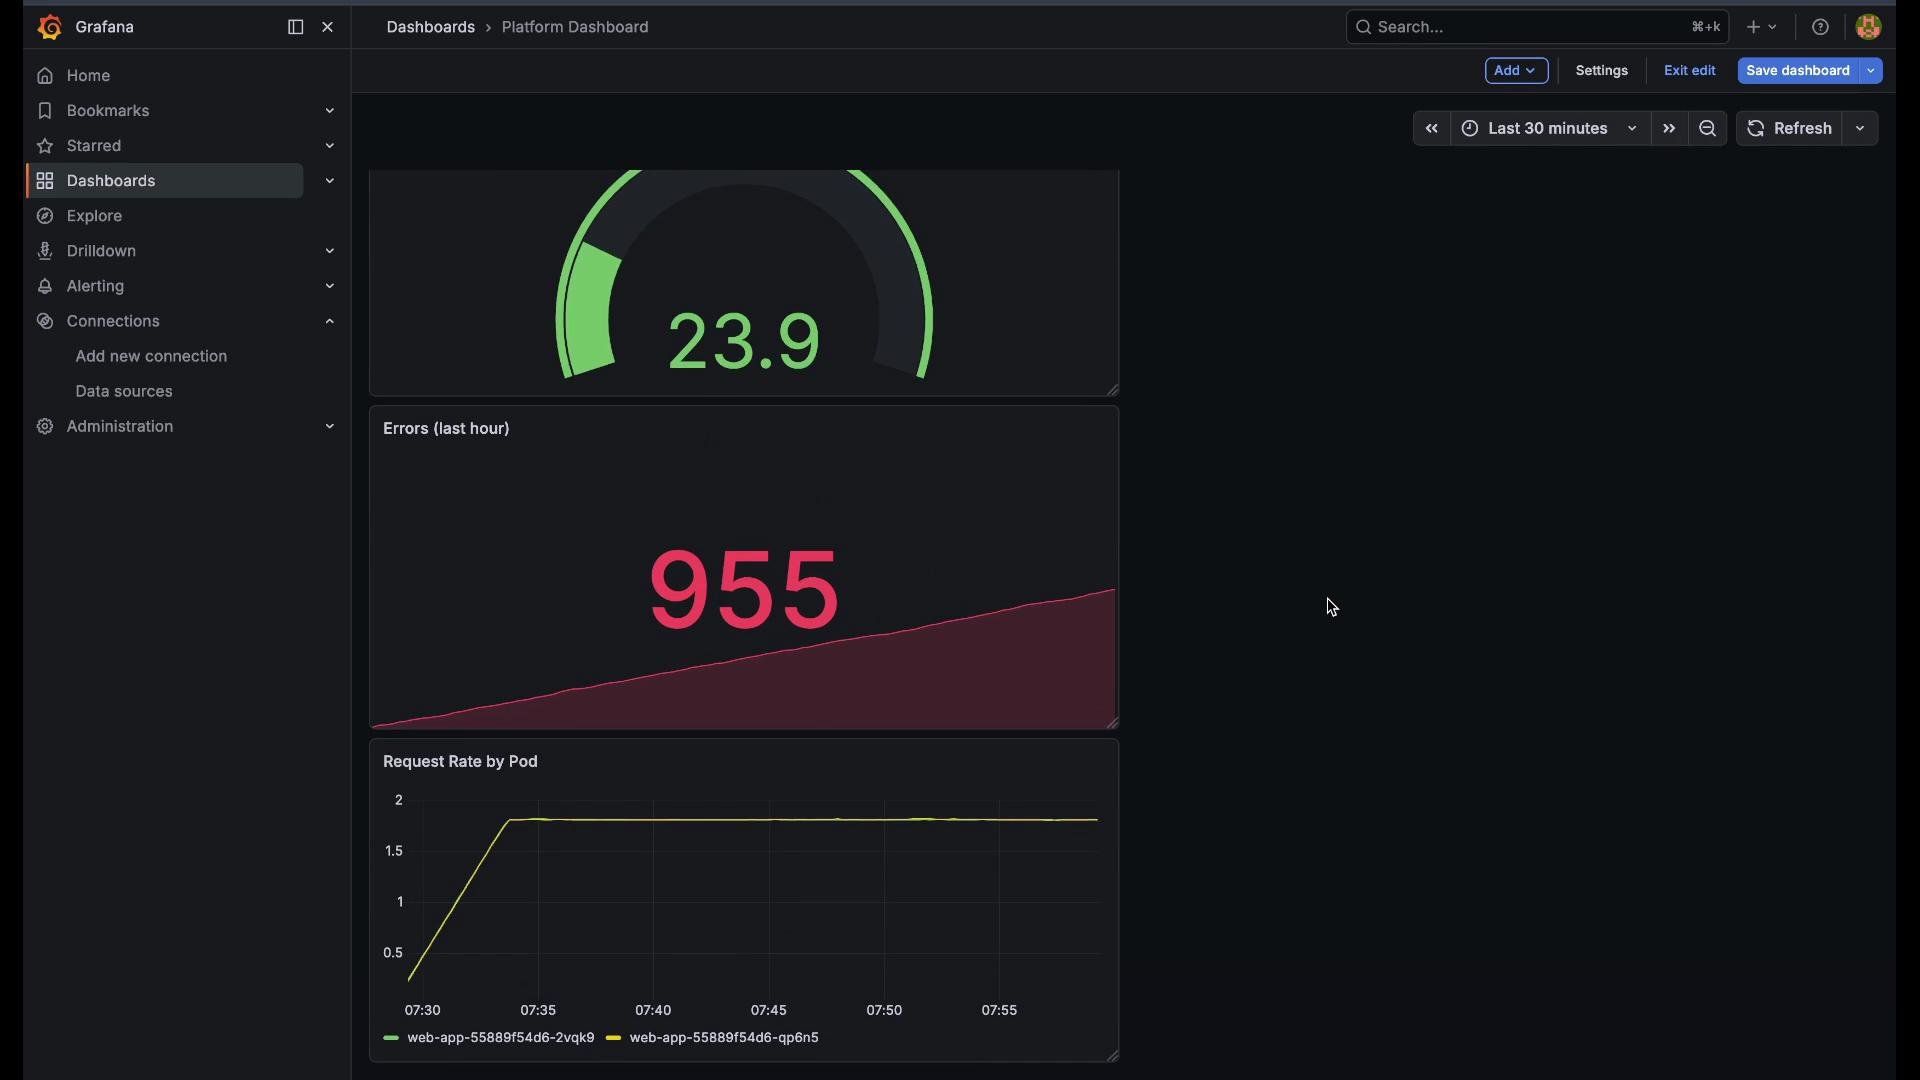
- Set the panel title to “Request Rate by Pod”.
- Adjust the dashboard time range (e.g., last 30 minutes) so the chart reflects the desired window.
- Save the panel and then save the dashboard as “Platform Dashboard”.
- Stat — Errors in the last hour
- Use a Stat panel when you need one prominent current value.
- Query total application errors over the past hour with:
- Title the panel “Errors — Last Hour”.
- Add thresholds to color the stat (for example, green/yellow/red) and show a sparkline if you want a mini trend.
- Save the panel to include it on the dashboard.
Use
increase() when you want total counts over a window (e.g., errors during the last hour). Use rate() for per-second throughput or when plotting time-series rates.- Gauge — Memory Used (%)
- Gauges are ideal for capacity metrics and clear thresholding.
- Compute used memory percentage with this PromQL:
- Title the panel “Memory Used (%)” or a descriptive variant.
- Configure thresholds, for example:
- 0–70: green
- 70–90: yellow
- 90+: red
- Save the panel. The gauge needle changes color as thresholds are crossed, giving an immediate view of capacity pressure.
- Pie chart — Request distribution by HTTP status
- Use a Pie chart for proportional breakdowns across categories.
- Use
increase()so each slice represents total counts during the chosen window (not instant rates):
- Title the panel (for example, “Requests by HTTP Status — Last Hour”).
- Enable legend and show values so slices are clearly labeled with counts and percentages.
- Save the panel and refresh the dashboard.
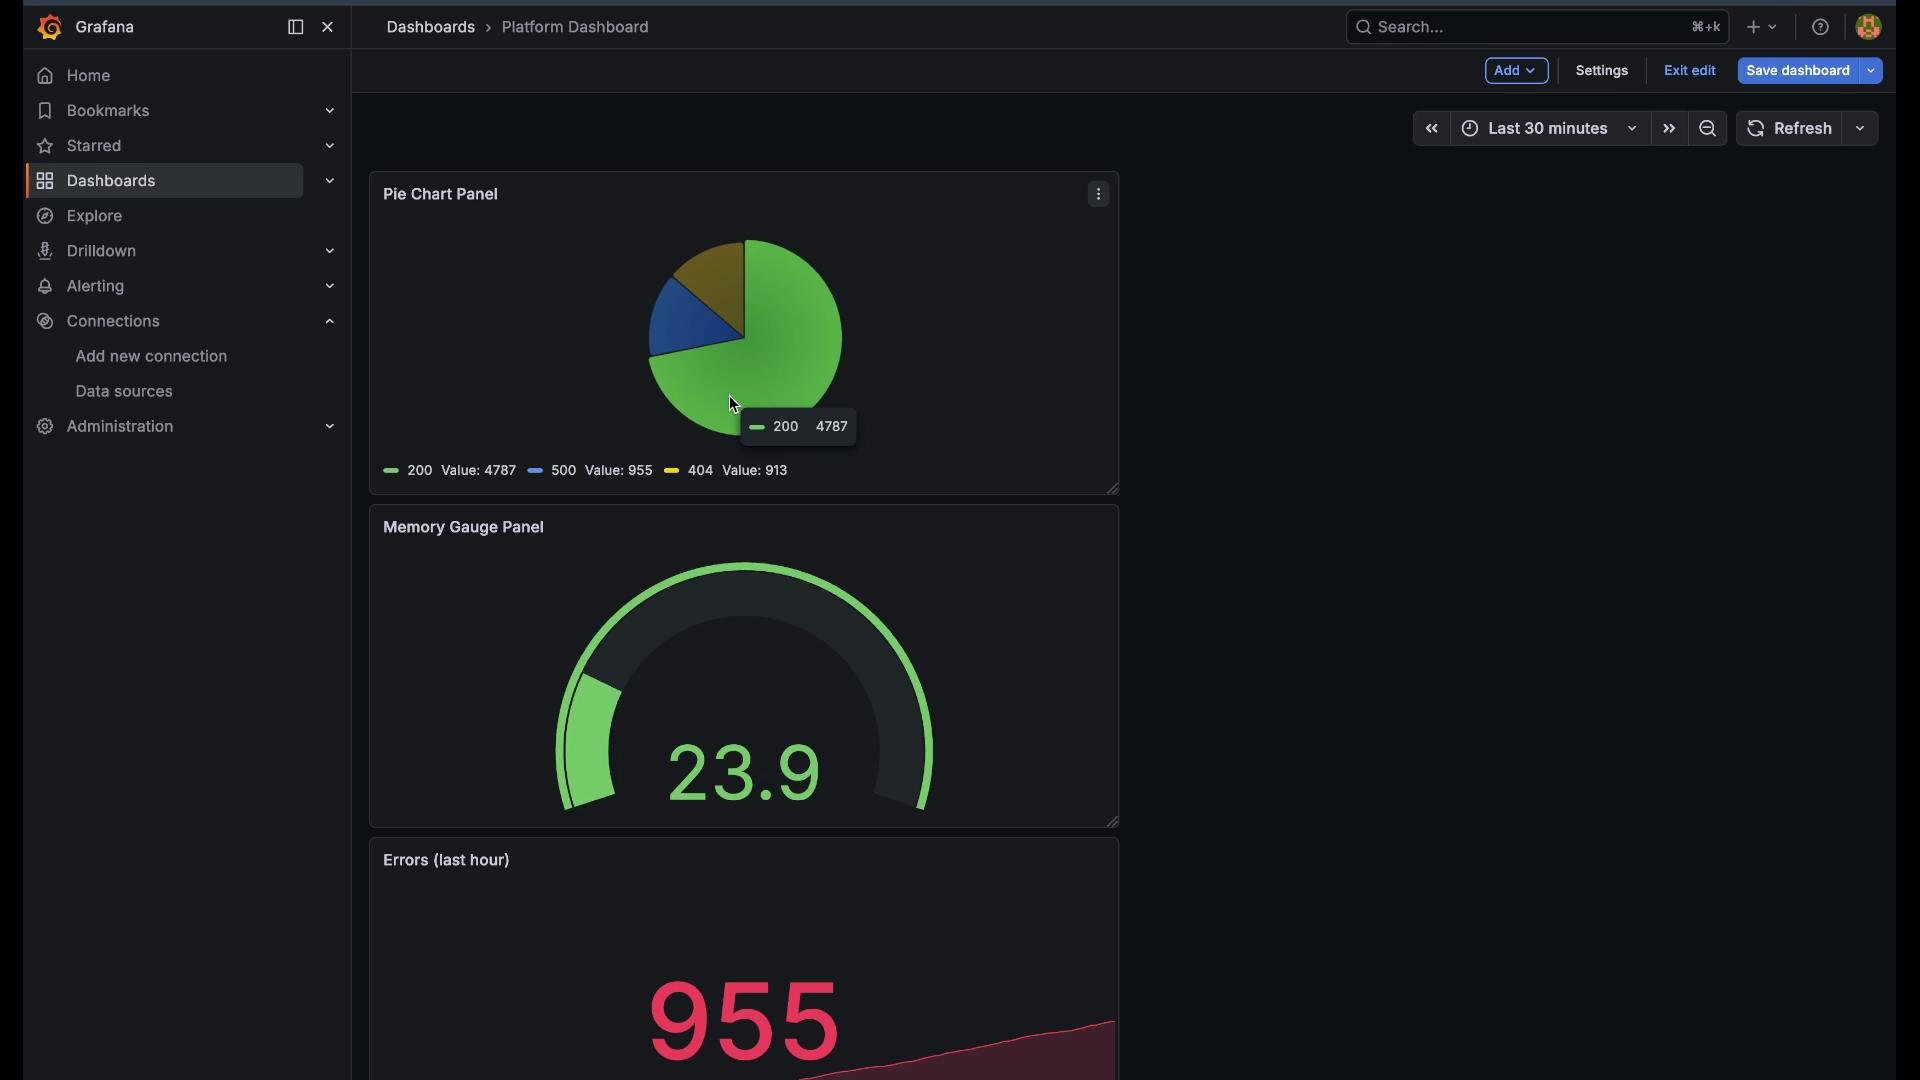
- Trend analysis: Time series (request patterns over time).
- Immediate health: Stat (current error count).
- Thresholded resource usage: Gauge (memory utilization with thresholds).
- Distribution: Pie chart (categorical splits like HTTP status codes).
Further reading and references
- Grafana: https://grafana.com/docs/
- Prometheus: https://prometheus.io/docs/
- PromQL basics: https://prometheus.io/docs/prometheus/latest/querying/basics/