

Verify the monitoring stack
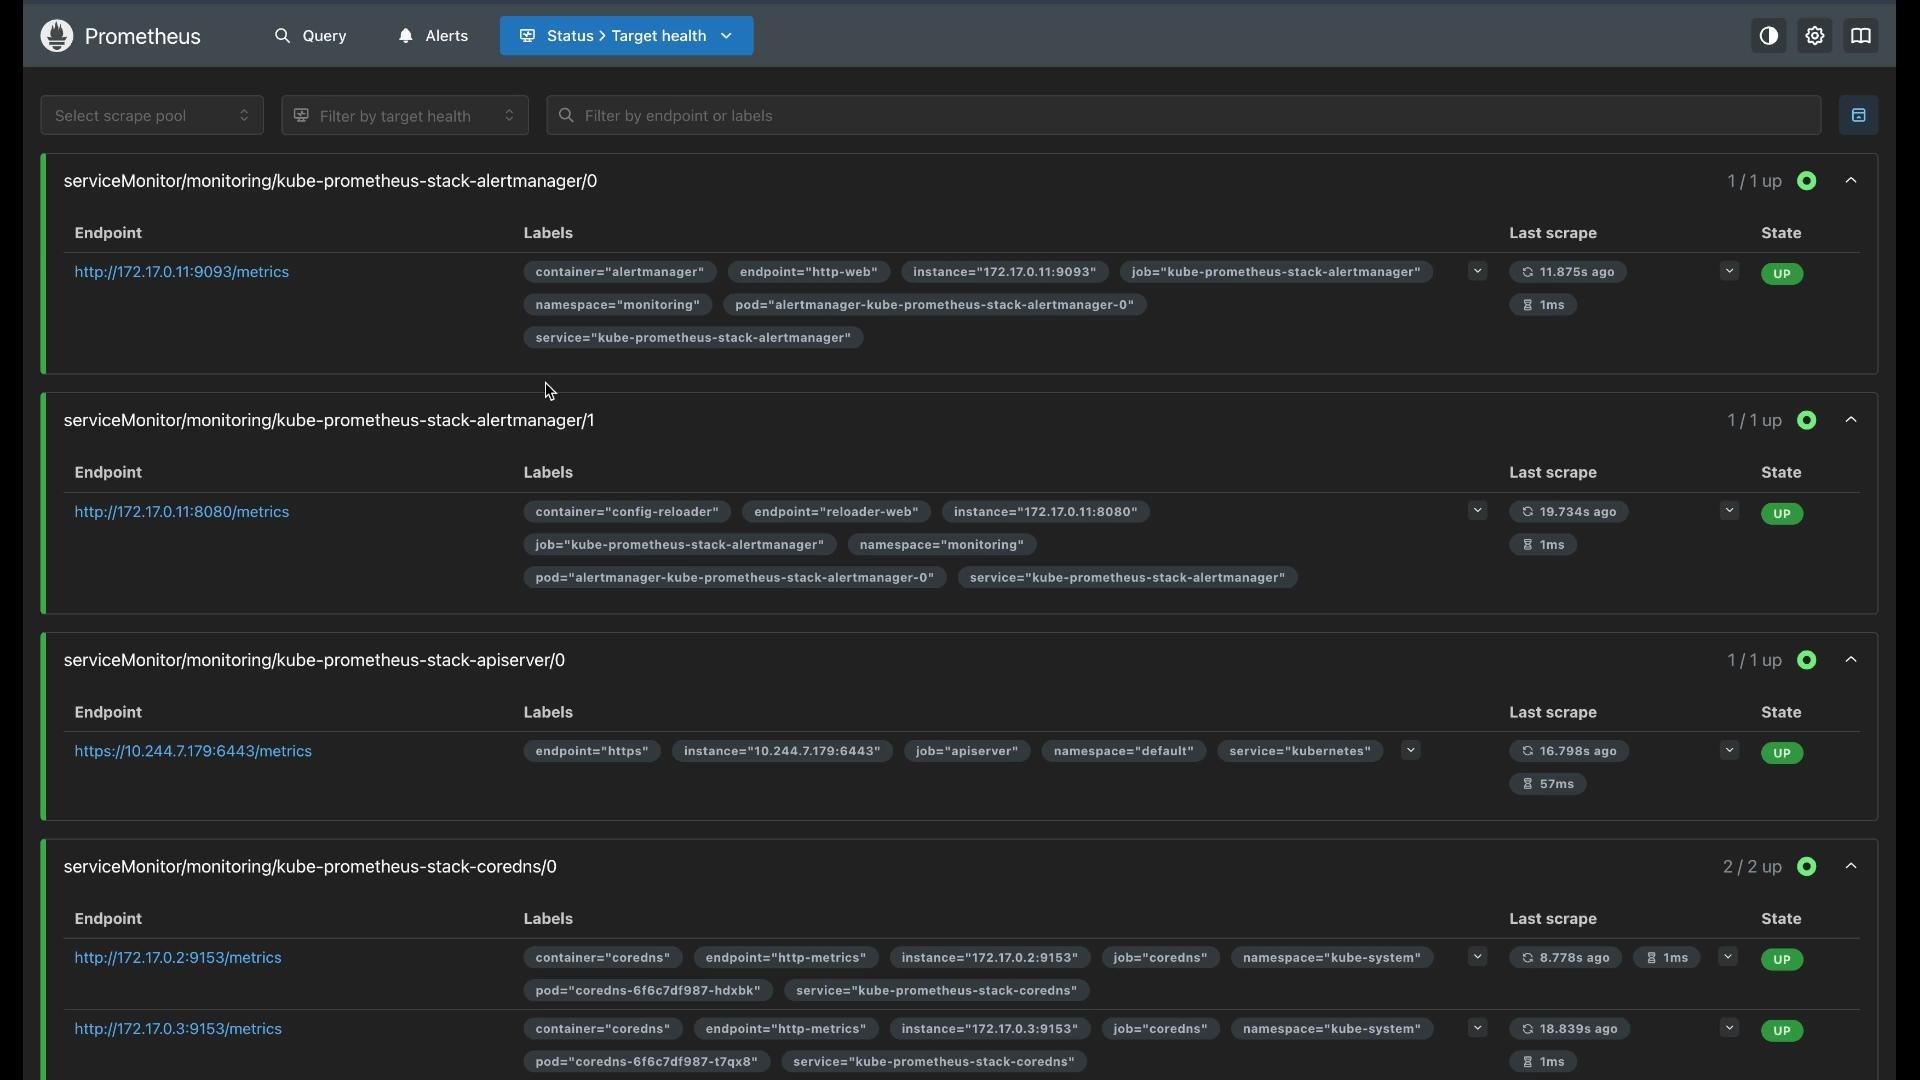
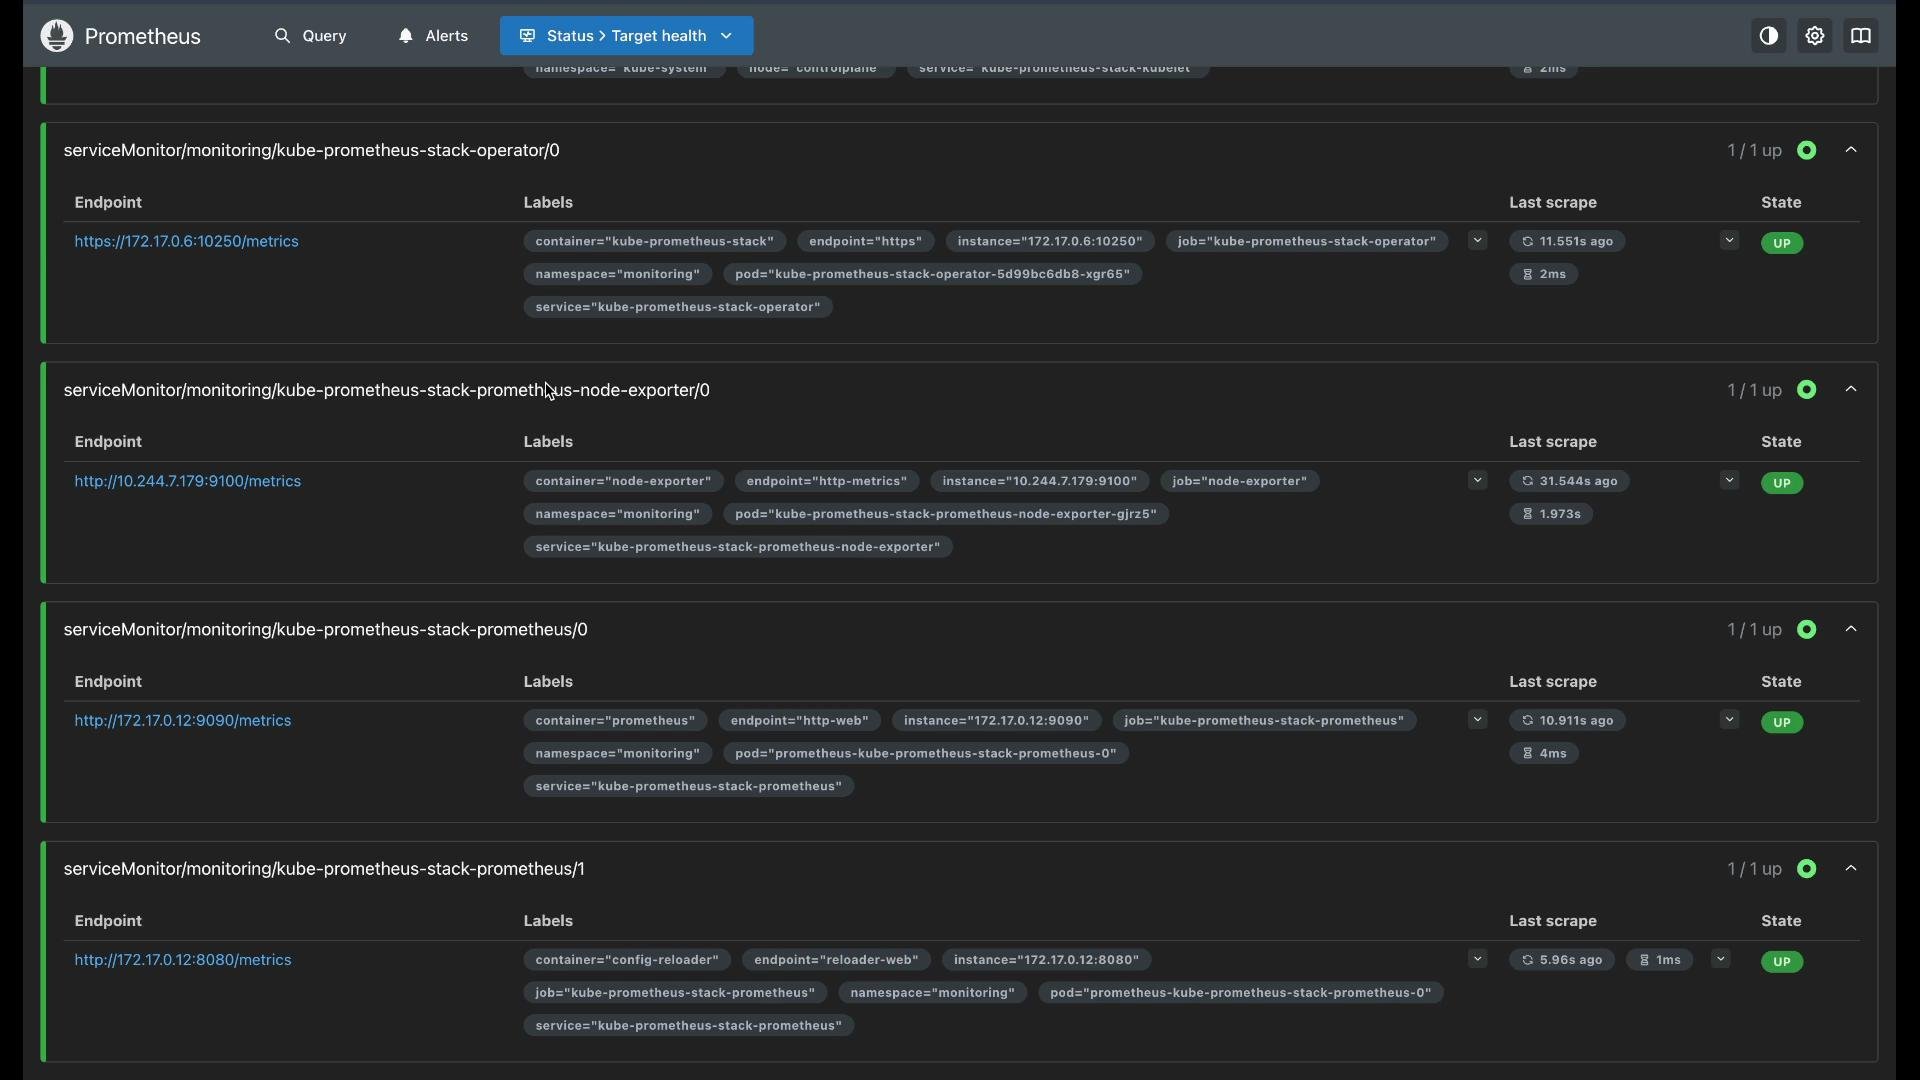
Confirm the monitoring namespace pods are running:Prometheus’ pull model gives central control over what and when to scrape. You control scrape intervals, relabeling, and which endpoints are collected — applications only need to expose metrics.
Querying metrics: Gauges vs Counters
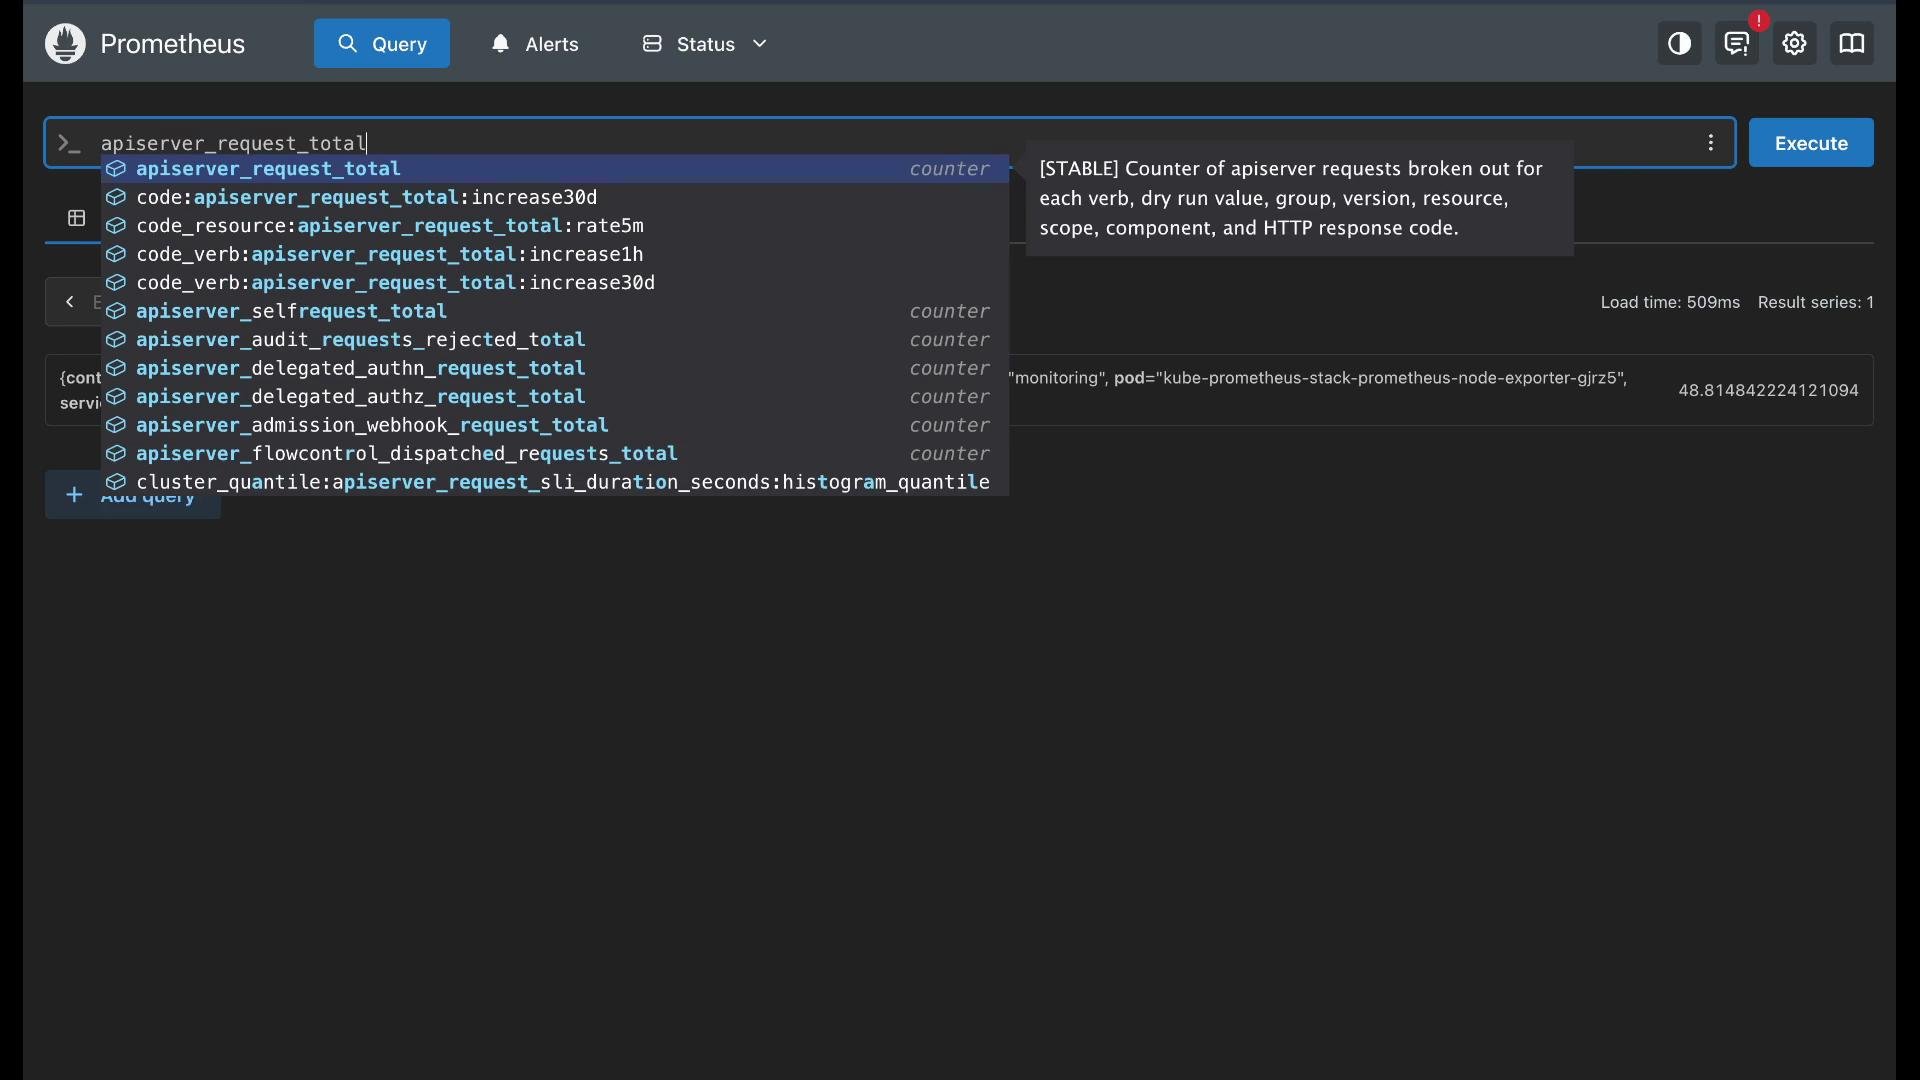
Use the Query tab to inspect raw metrics, test PromQL, and preview series for dashboard panels.- Gauges represent current states and can go up or down (example: available memory).
- Counters only increase (monotonic) and represent totals over time (example: number of HTTP requests since process start).
Gauges — example (available memory)
Raw metric:48.8148, representing ~48.8 GiB.
Counters — example (request rates)
Counters accumulate. To measure velocity userate() (or irate() for instant rate) over a range vector. For example, requests per second over the last 5 minutes:
Aggregation patterns for dashboards
Two common aggregation patterns used in platform dashboards:- Distribution (e.g., requests by verb or status code)
- Error rate percentage (ratio of error requests to total requests)
Note: In table examples, label selectors and brace syntax are shown inline in backticks to avoid MDX parsing issues.
Examples:
- Per-verb request rate aggregated across instances:
- Total requests over the last hour, grouped by HTTP status code (useful for pie charts or totals):
Use
rate() (or irate() for instant rate) with counters when you want a per-second velocity. Use increase() when you want the total increment of a counter over a time window (useful for totals and pie charts).Error rate percentage
A common SRE/platform metric is the percentage of requests that resulted in 5xx responses over a short window. Compute it as:Quick troubleshooting checklist
- Check Prometheus → Status → Targets first when metrics are missing.
- Confirm pods and endpoints are Ready and reachable from the Prometheus server.
- Review ServiceMonitor/PodMonitor relabel configs for unintended label drops.
- Use the Query tab to validate that the expected metric names and labels exist.
- Convert raw units (bytes, nanoseconds) into human-friendly units in queries for dashboards.
Summary
- Prometheus scrapes targets (pull model) — verify targets in Status → Targets if metrics are missing.
- Gauges: read current state; convert units for readability.
- Counters: use
rate()/irate()for velocity andincrease()for totals. - Filter using label selectors (e.g.,
{verb="GET", code="200"}) and aggregate withsum(...) by (...)for dashboard-friendly series.
Links and references
- Prometheus Documentation
- PromQL Reference
- Kubernetes Concepts — Monitoring
- Grafana — Visualize Prometheus Metrics