

Why consistent labeling matters — a concrete example
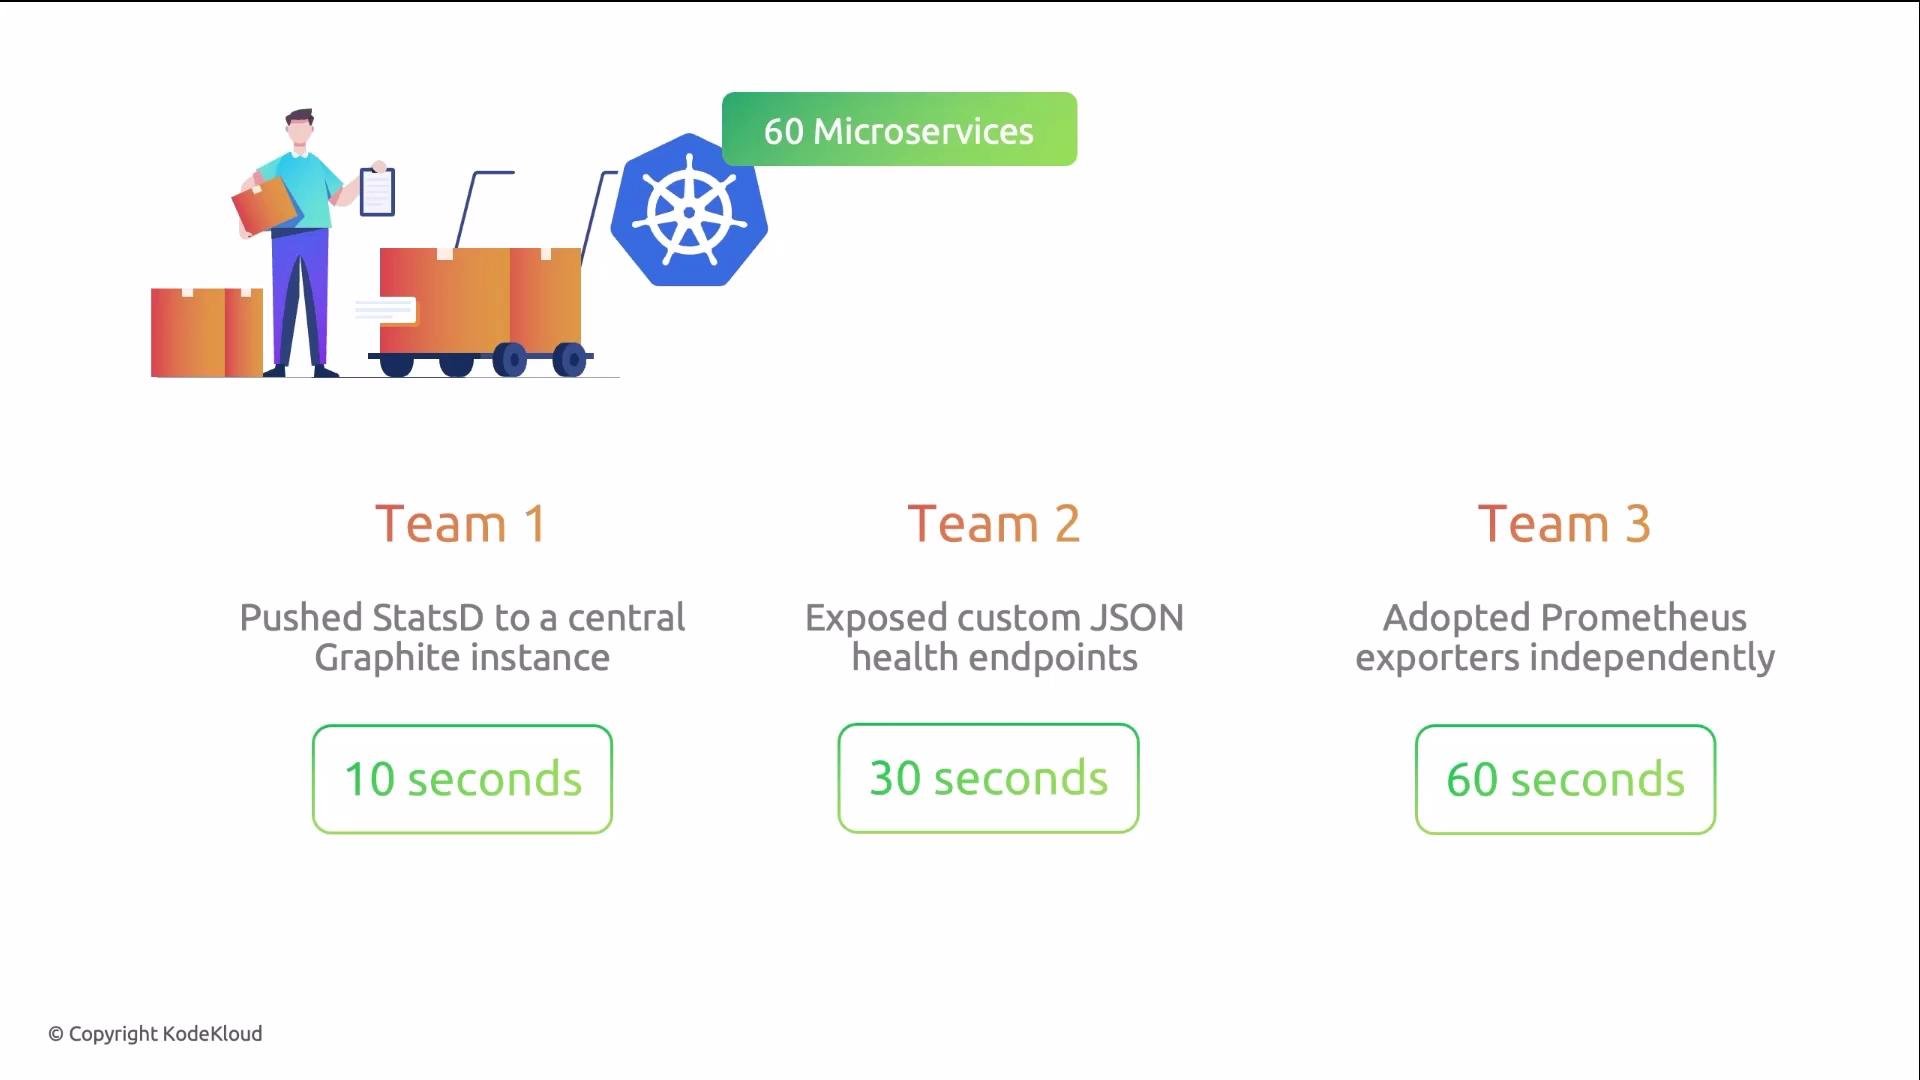
A logistics platform ran 60 microservices across three Kubernetes clusters. Each team chose different metric approaches. During a database connection-pool exhaustion incident, the platform team needed to correlate:- API error rates
- Database connection counts
- Pod memory usage
The problem: data everywhere
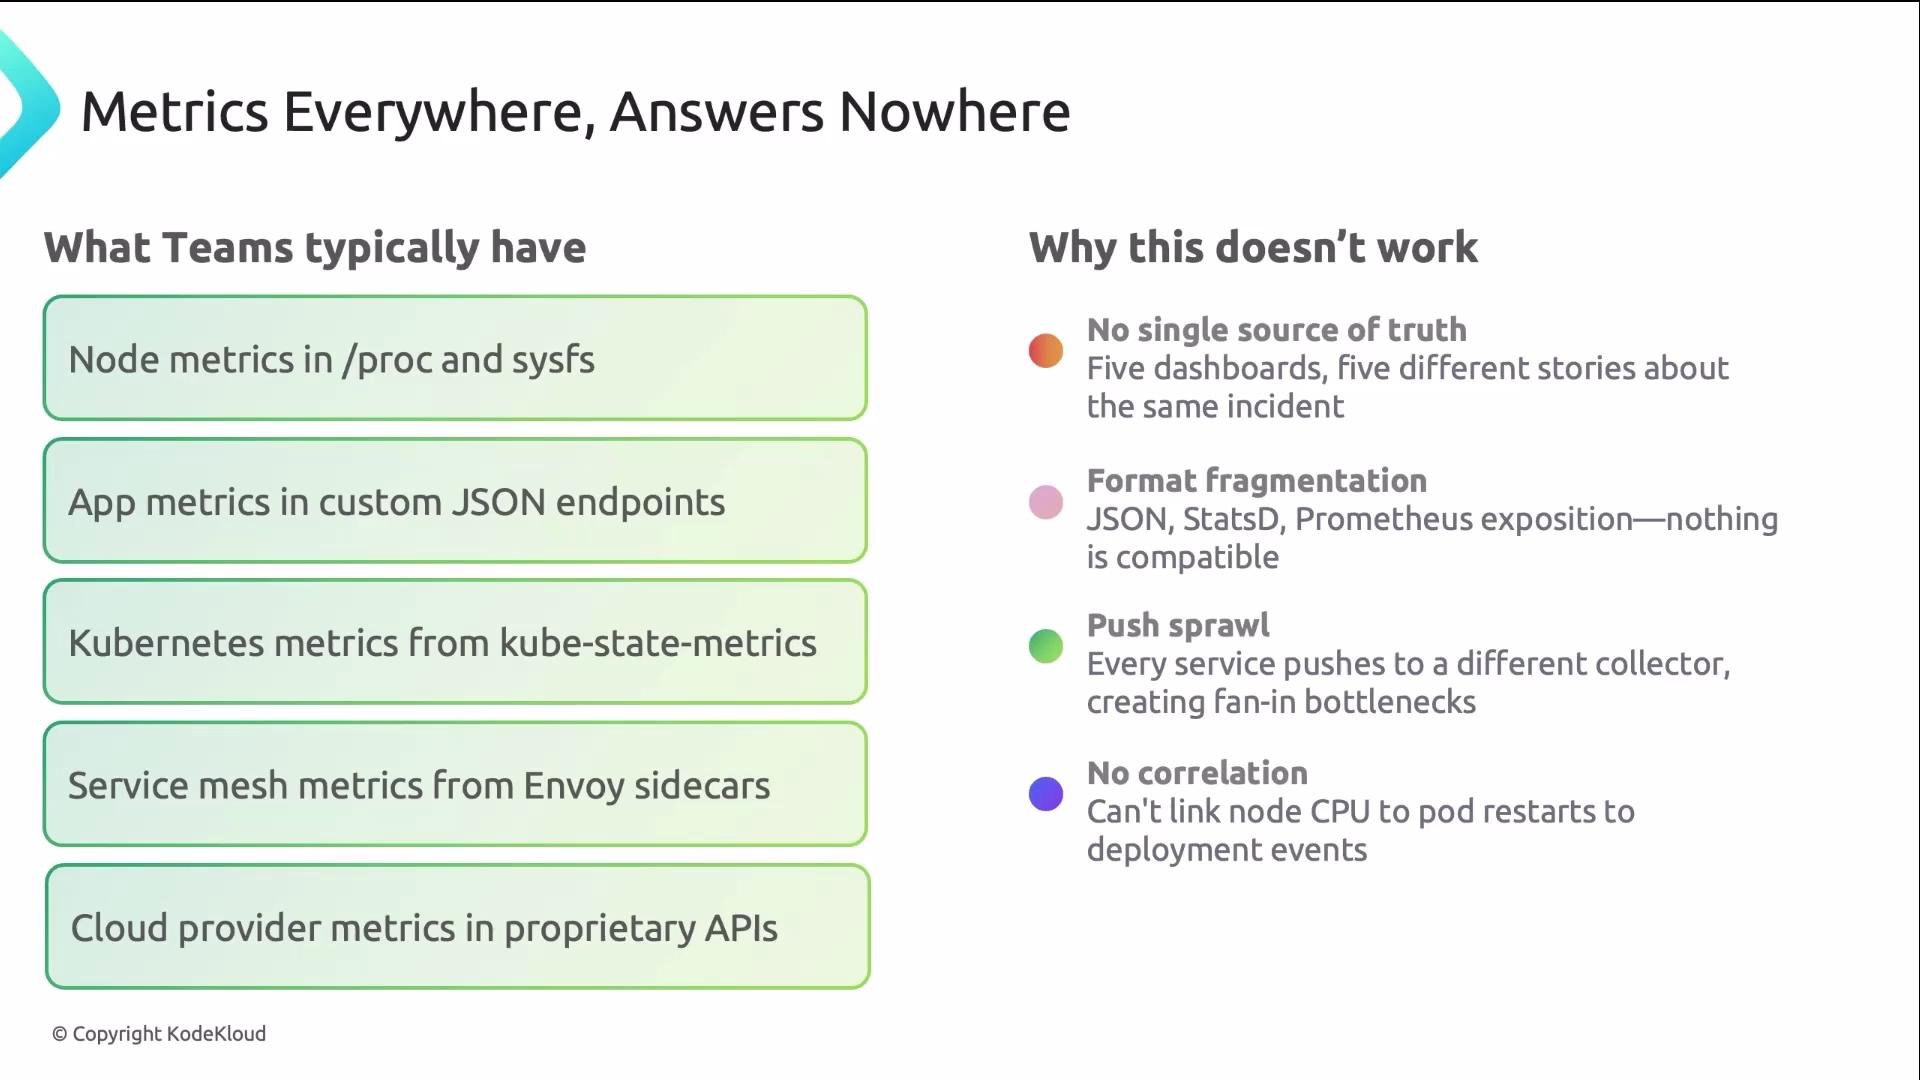
Without a unified approach you get:- No single source of truth
- Format fragmentation
- Push-sprawl
- Difficult correlation and inconsistent dashboards
Prometheus architecture — four conceptual layers
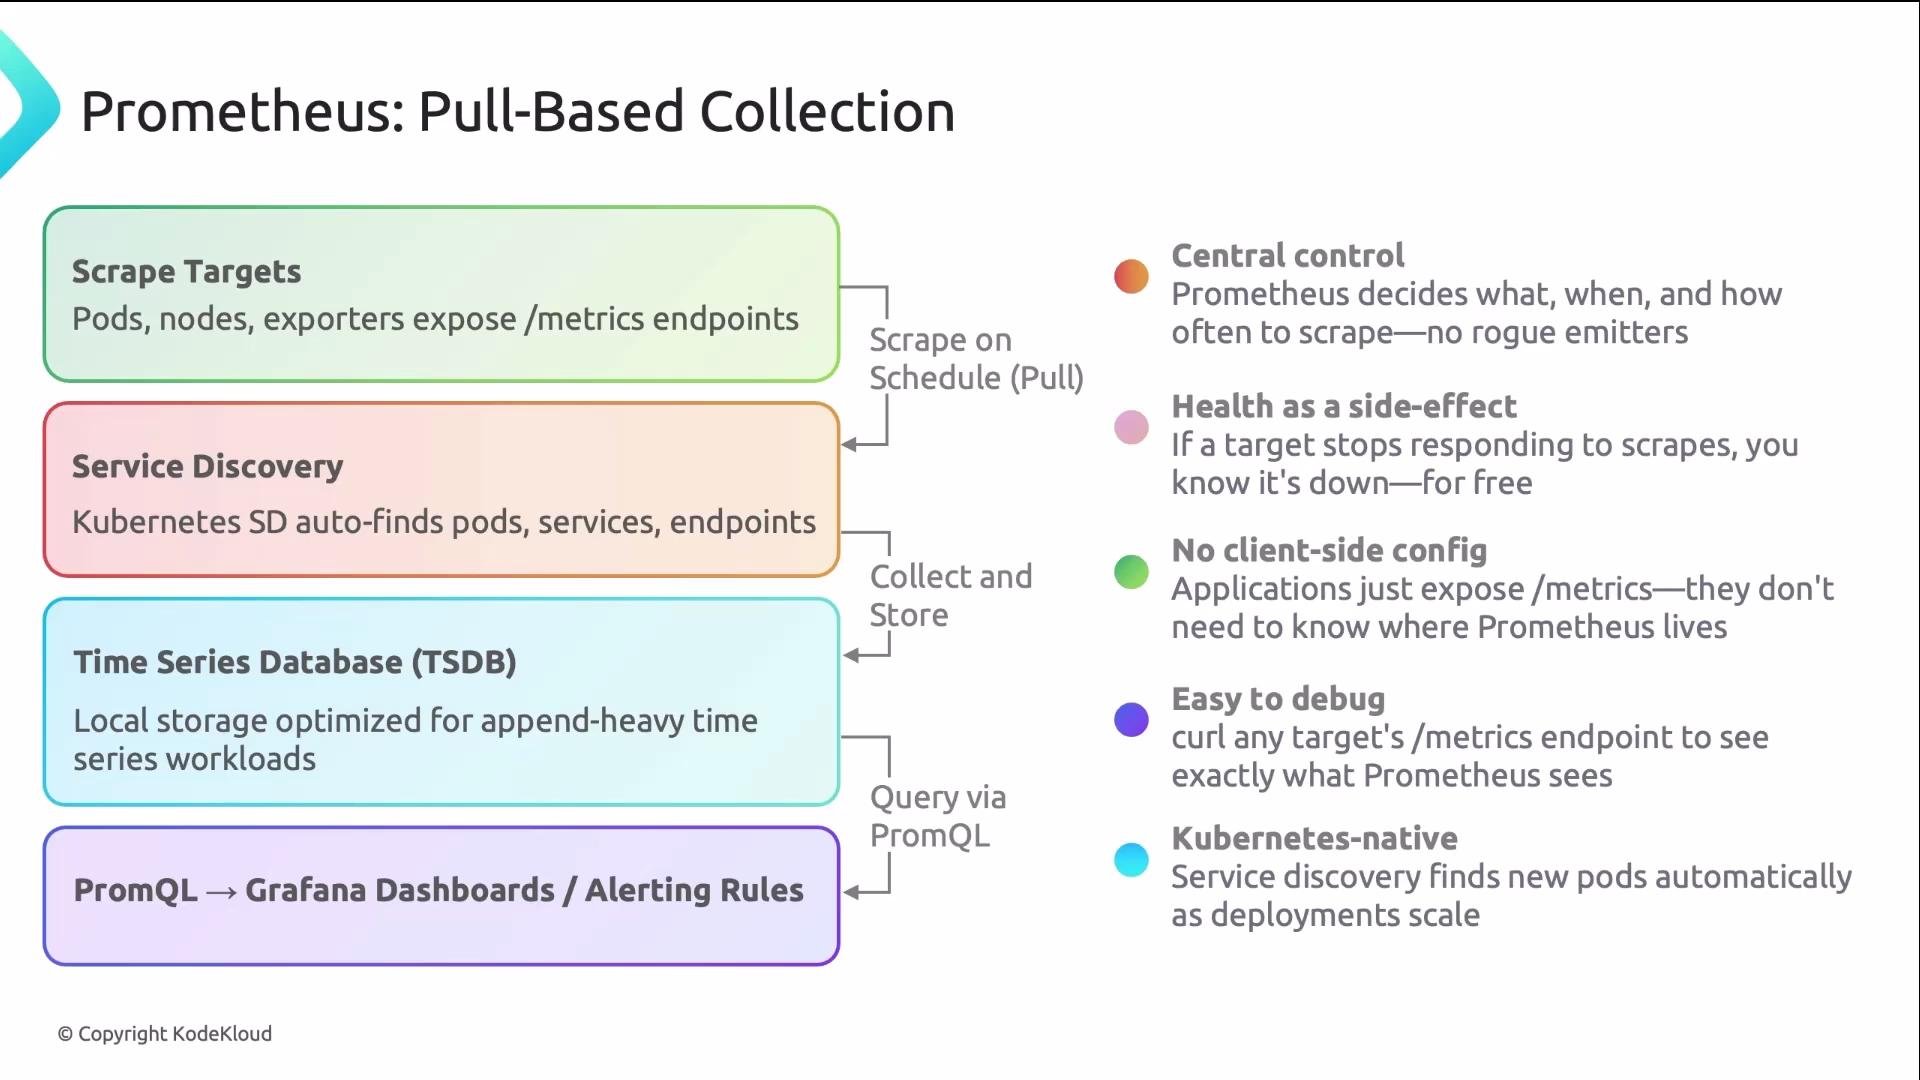
Prometheus provides a predictable, Kubernetes-native collection model. Conceptually it has four layers:- Targets: applications expose a
/metricsHTTP endpoint. - Service discovery: finds targets automatically (Kubernetes, Consul, etc.).
- Prometheus server: scrapes targets and stores time-series samples in its TSDB.
- PromQL: queries the time-series database for analysis, dashboards, and alerts.
- Central control: scrape intervals and targets are controlled centrally.
- Health detection and debugging: if a target stops responding, Prometheus notices immediately and you can inspect the exact
/metricsoutput.
- No client-side scrape scheduling
- Easier debugging (query the target directly)
- Strong Kubernetes-native integration
Prometheus is primarily pull-based. For short-lived batch jobs that can’t be scraped, the official escape hatch is the Pushgateway. Use Pushgateway sparingly — it’s an exception, not the default pattern. See the Prometheus push practices for details: https://prometheus.io/docs/practices/pushing/
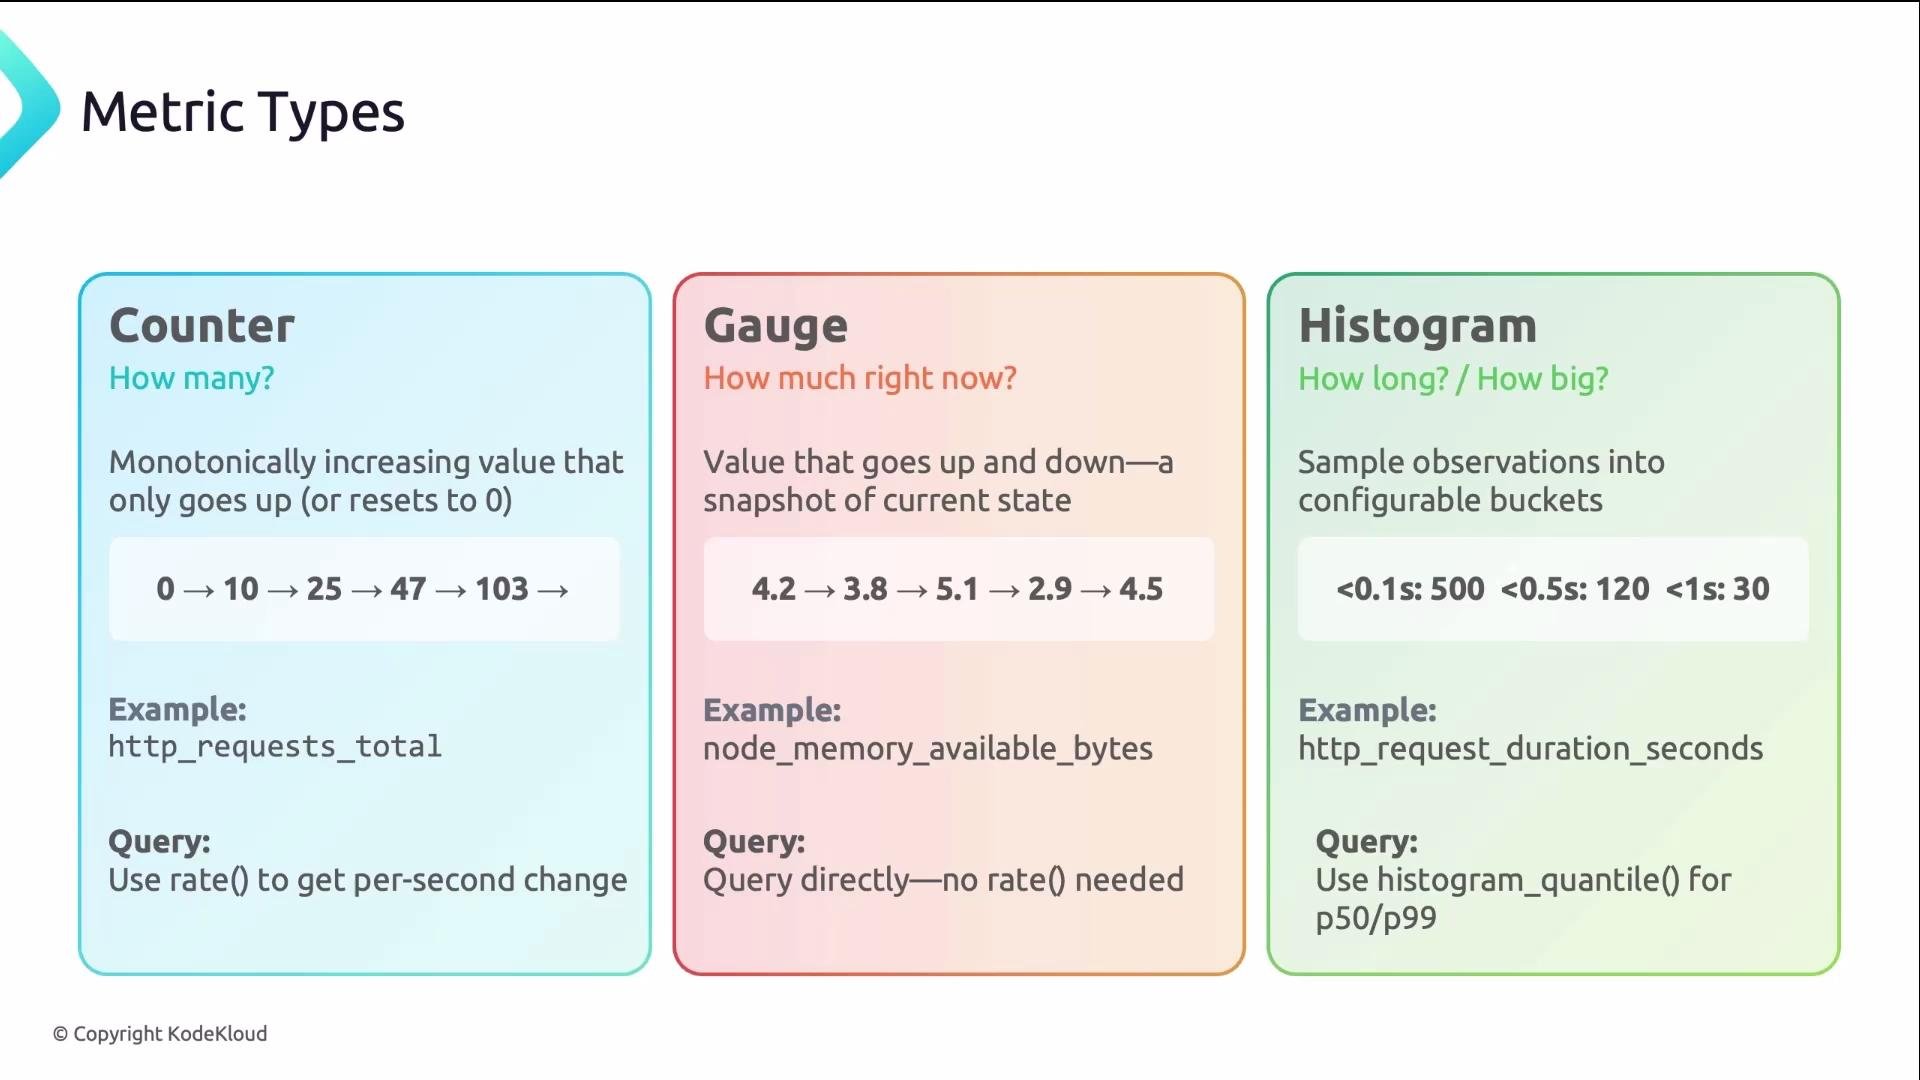
Metric types — what to use and how to query them
Choosing the correct metric type and query pattern is critical. Applying the wrong PromQL function to a metric type is the most common mistake.
Key rules:
- Avoid
rate()on gauges — use the raw gauge or appropriate functions. - To interpret counters, always use
rate()orincrease(). - For histograms, operate on the bucket counters (often with
rate()) and usehistogram_quantile()for percentiles.
Labels: dimensionality by design
Labels are one of Prometheus’s most powerful features. Without labels you’d need a unique metric name for every dimension combination — that doesn’t scale. Labels let you:- Filter subsets (e.g., by
namespace,pod,service) - Group and aggregate (e.g.,
sum by (service)) - Correlate metrics across services when labels are consistent
namespace). Establish platform-wide labeling conventions (team, service, environment) to make cross-service queries straightforward.
PromQL patterns you’ll use daily
PromQL can look intimidating, but most needs are covered by three patterns:- Instant vector — current values
- Range vector + function — rates/changes over time
- Aggregation — group and summarize by labels
Remember: counters may reset when a process restarts. Functions like
rate() and increase() are resilient to resets. Use gauges for instantaneous values and avoid rate() on non-monotonic series.Prometheus in Kubernetes — discovery and common targets
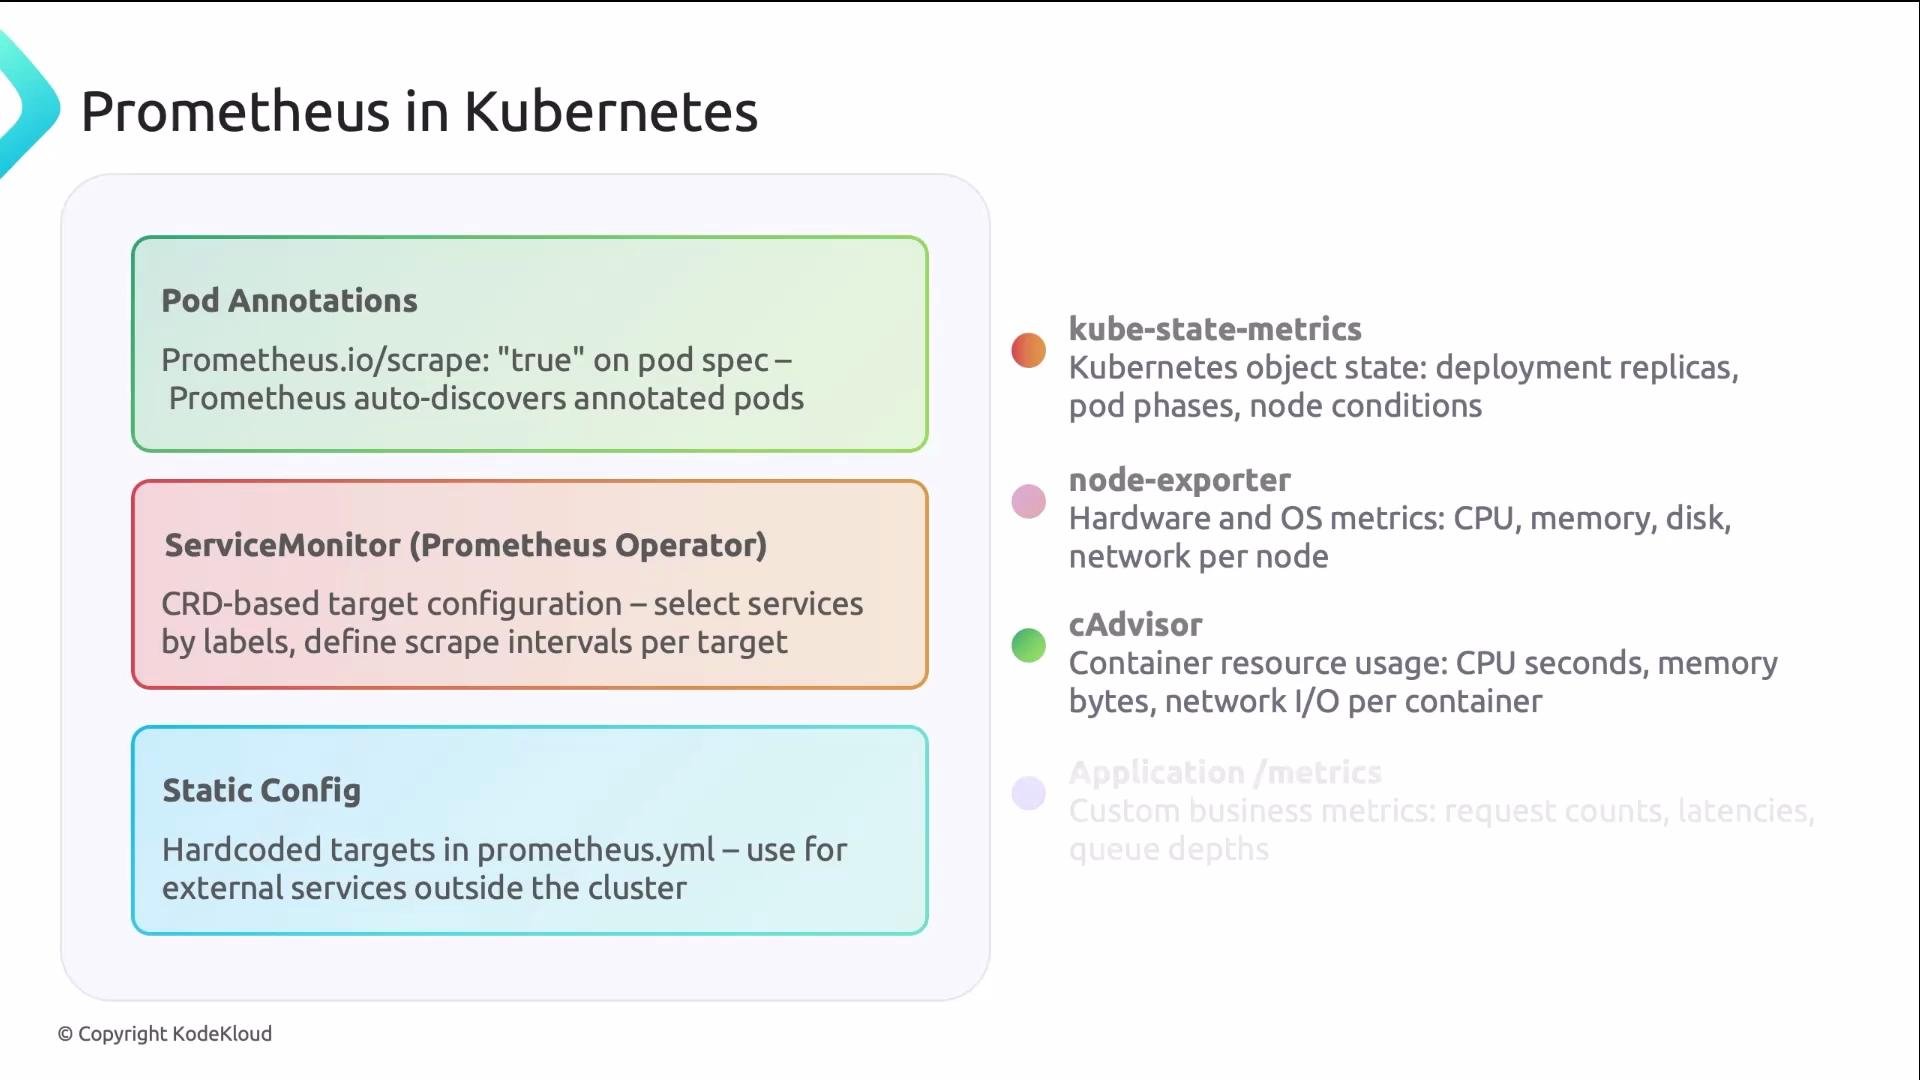
Common discovery methods in Kubernetes:- Pod annotations: quick for simple setups. Example:
- ServiceMonitor: CRD from the Prometheus Operator (recommended for scale). ServiceMonitors let you declaratively manage scrape targets and relabeling.
- Static configuration: use for external systems or legacy services that are not discovered via Kubernetes.
- kube-state-metrics: exposes desired/actual state of Kubernetes objects — deployments, replicasets, pods. (https://github.com/kubernetes/kube-state-metrics)
- node-exporter: node-level hardware metrics — CPU, memory, disk, network. (https://github.com/prometheus/node_exporter)
- cAdvisor: container-level CPU and memory metrics. (https://github.com/google/cadvisor)
- Your app’s
/metricsendpoint: business and application-specific metrics.
Quick reference — common PromQL snippets
- Current memory per pod:
- Requests per second (5m):
- Aggregate 5xx error rate by service:
- 95th percentile latency from histograms:
Summary — core takeaways
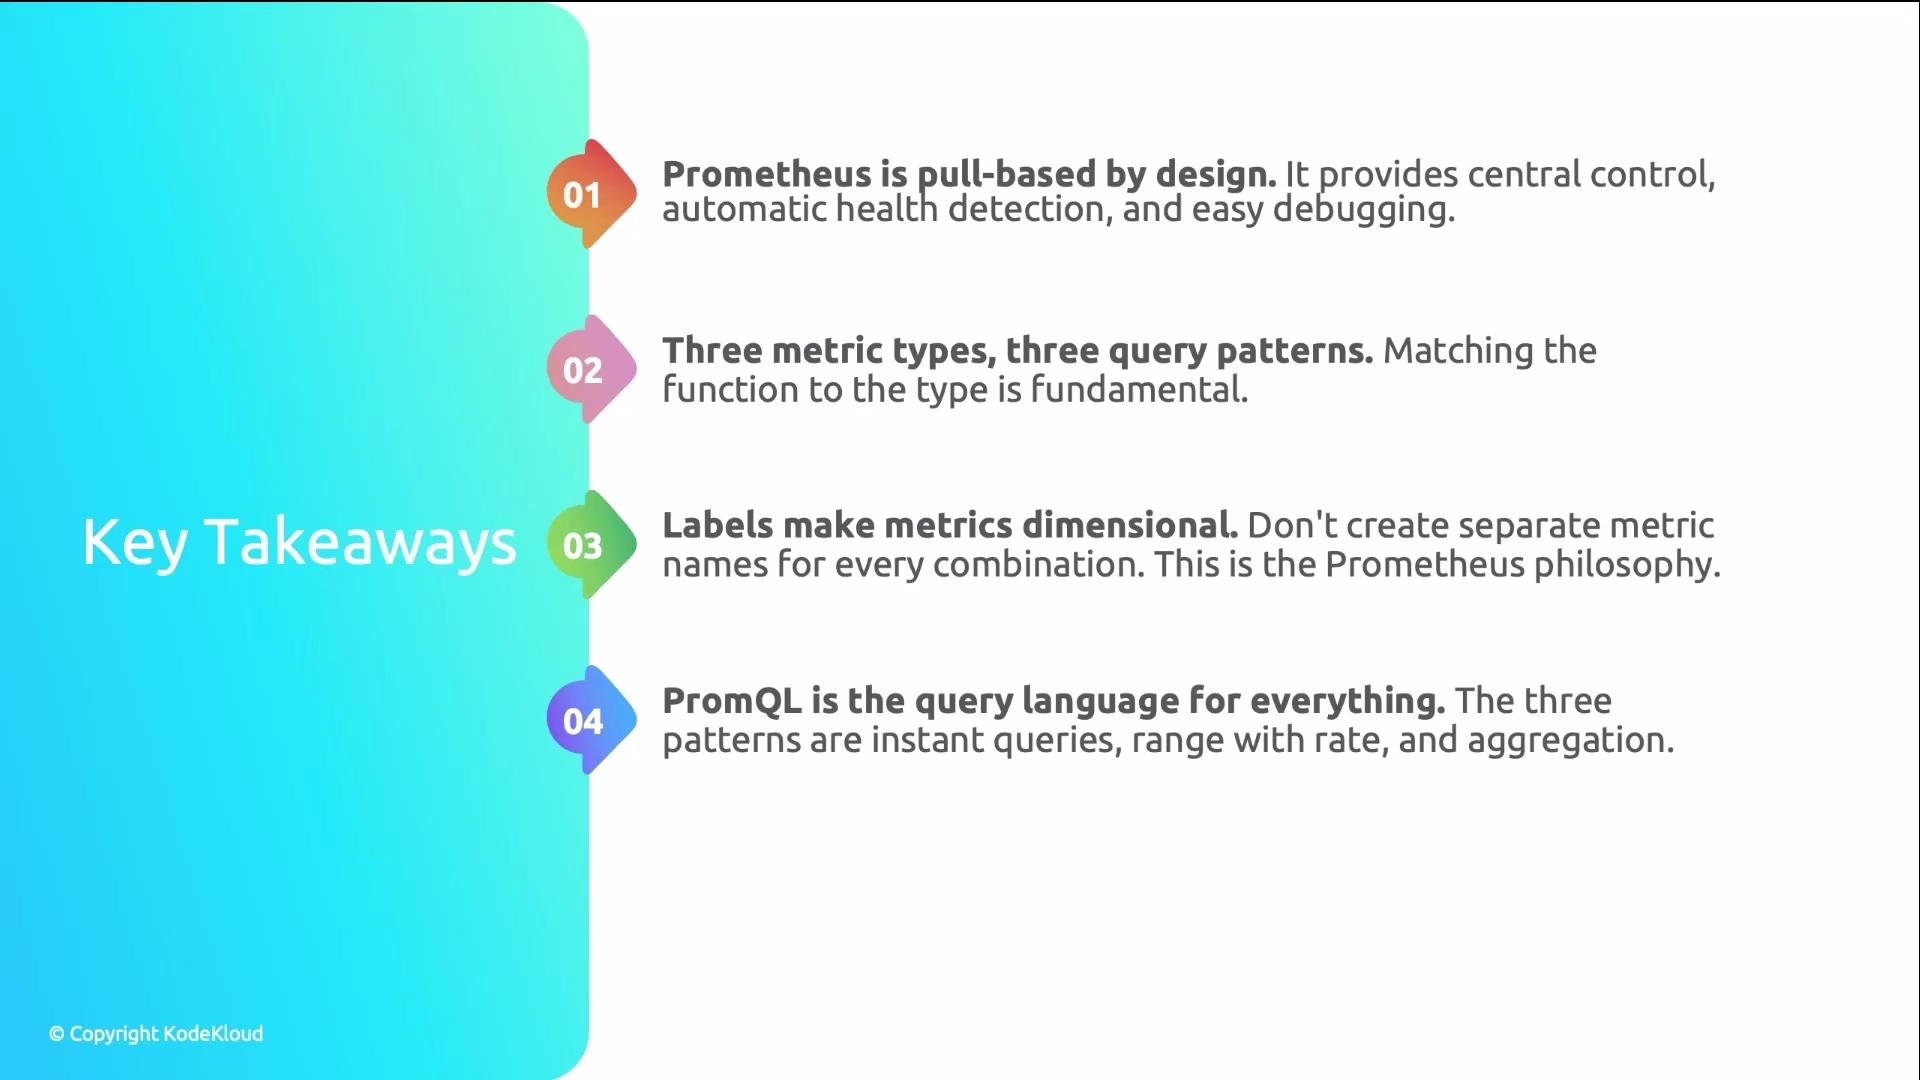
- Prometheus is pull-based: this enables central control and automatic health detection.
- There are three primary metric types (counter, gauge, histogram). Use the proper query patterns:
- Counters →
rate()/increase() - Gauges → instant values or non-monotonic functions
- Histograms → operate on bucket counters and use
histogram_quantile()
- Counters →
- Labels make metrics dimensional and enable filtering, grouping, and correlation. Enforce consistent labeling conventions.
- PromQL supports instant, range, and aggregation queries — these cover most dashboarding and alerting needs.
Links and further reading
- Prometheus docs: https://prometheus.io/docs/
- PromQL basics: https://prometheus.io/docs/prometheus/latest/querying/basics/
- Prometheus Operator and ServiceMonitor: https://github.com/prometheus-operator/prometheus-operator
- kube-state-metrics: https://github.com/kubernetes/kube-state-metrics
- node-exporter: https://github.com/prometheus/node_exporter
- Pushgateway best practices: https://prometheus.io/docs/practices/pushing/