

This lesson assumes you already understand Kubernetes fundamentals, CI/CD concepts, and common
kubectl workflows. If you haven’t completed the Certified Kubernetes Administrator (CKA) preparation yet, please do that first and then return — CNPE builds on that foundation.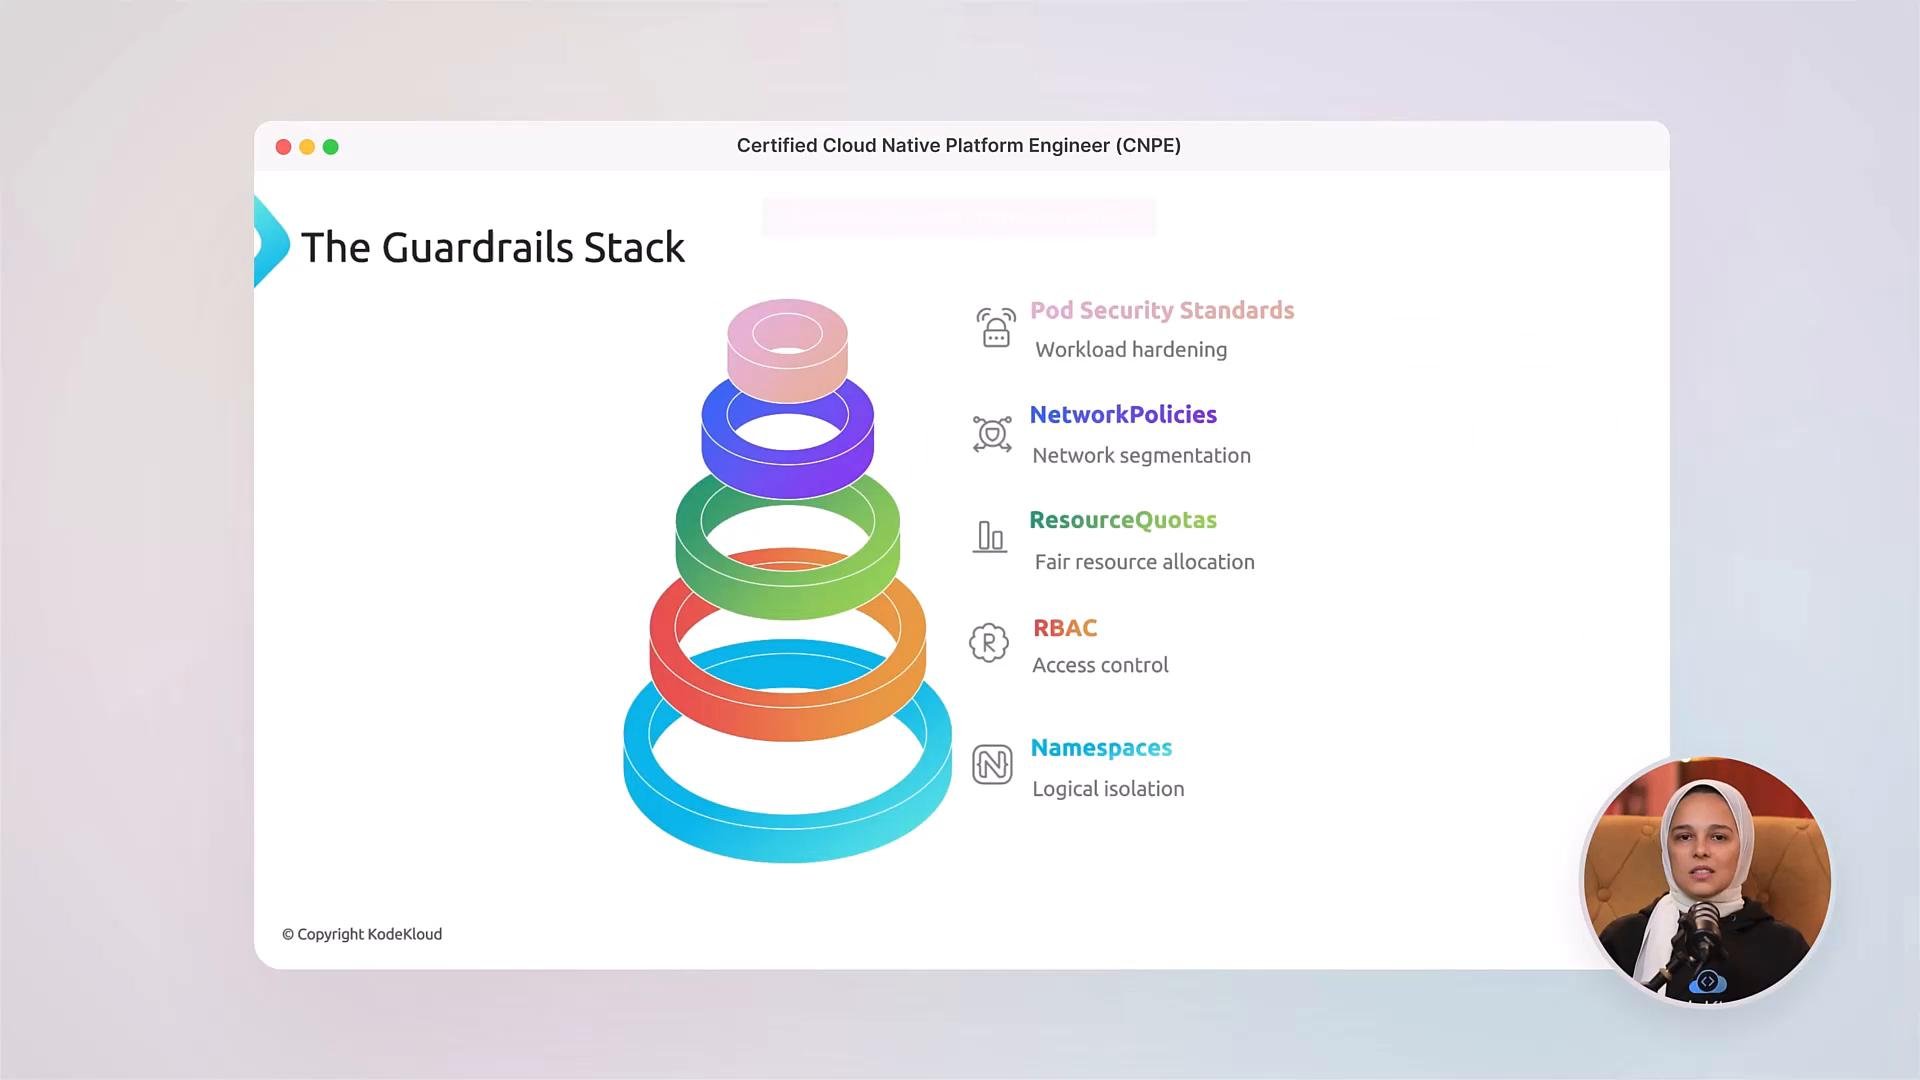
- Build the foundation for a modern platform: compute, storage, and networking.
- Design platforms for multi‑tenancy and cost optimization.
- Apply platform guardrails (namespaces, RBAC, resource quotas, network policies, and Pod Security Standards) so teams can self‑service safely.
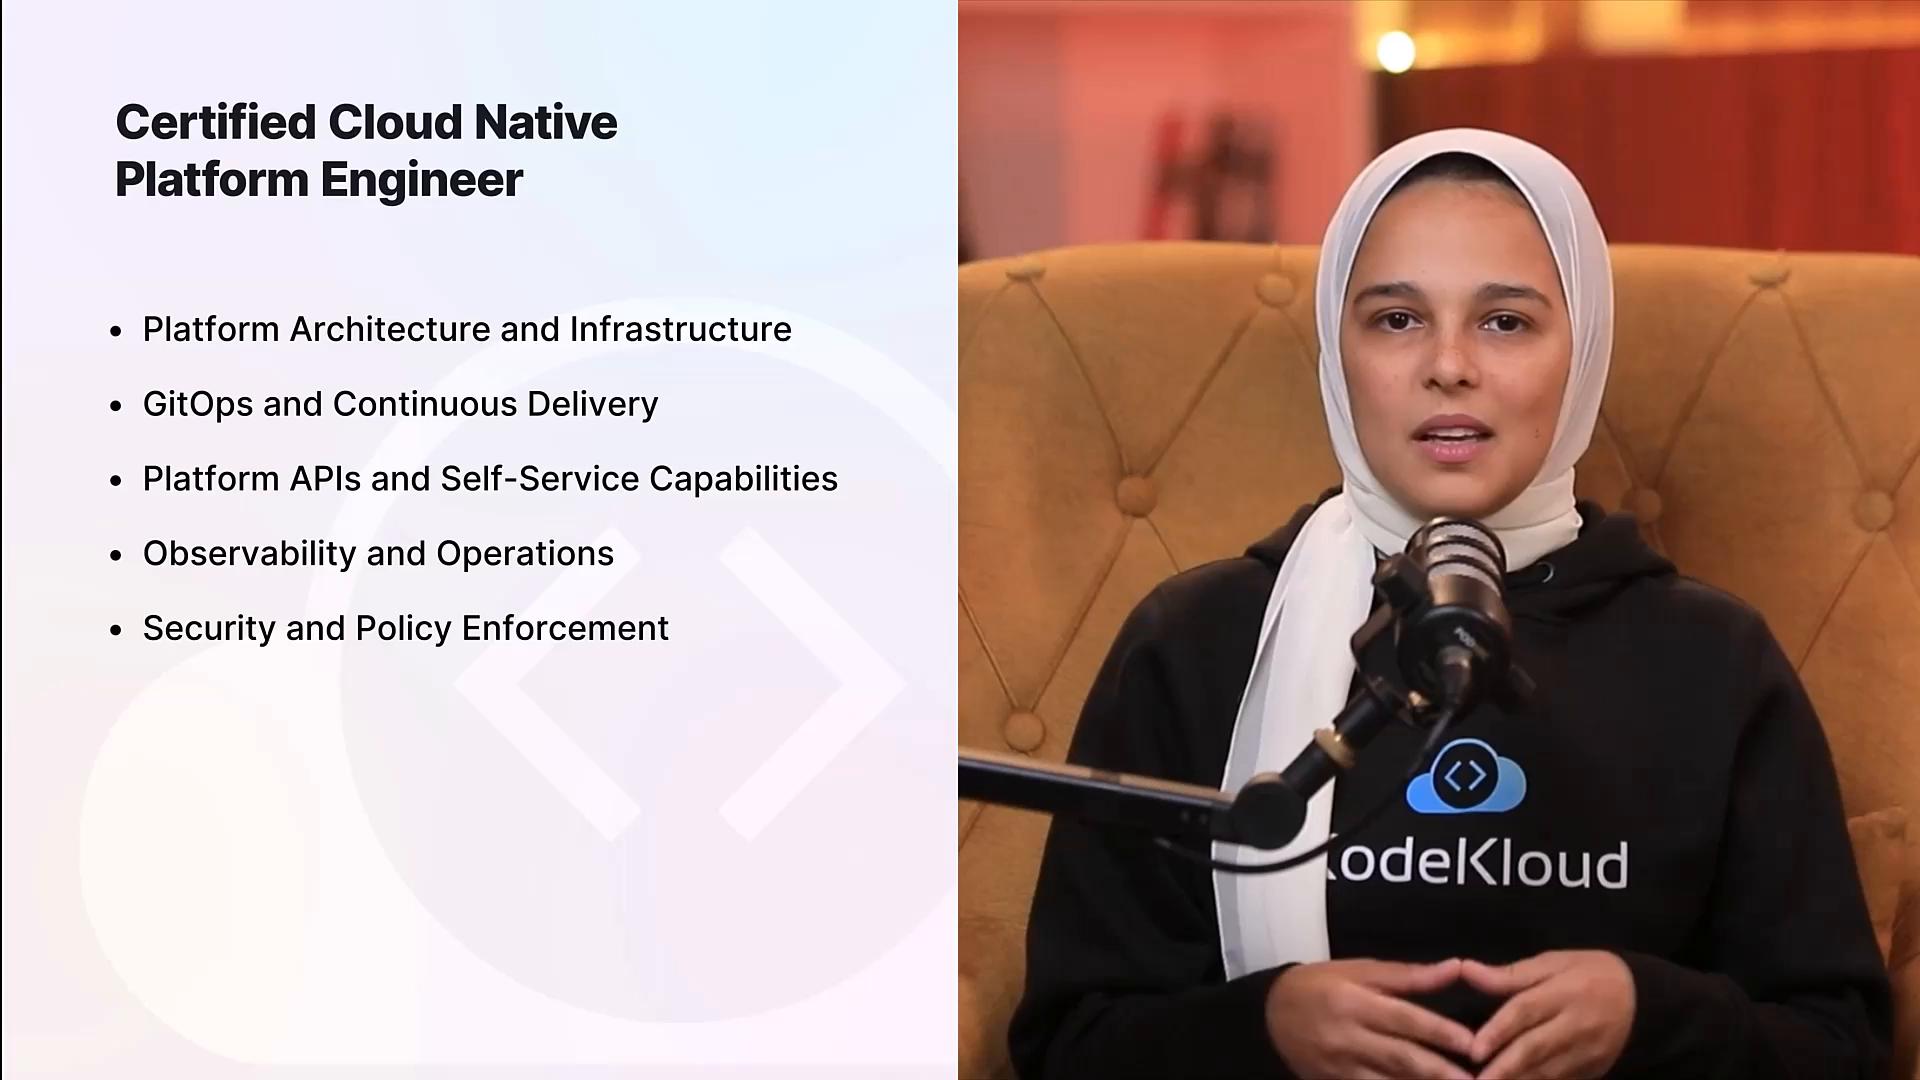
- Implement GitOps workflows and reconcile declared state from Git to clusters.
- Integrate CI pipelines with Kubernetes and apply progressive delivery strategies (canary, blue/green, feature flags).
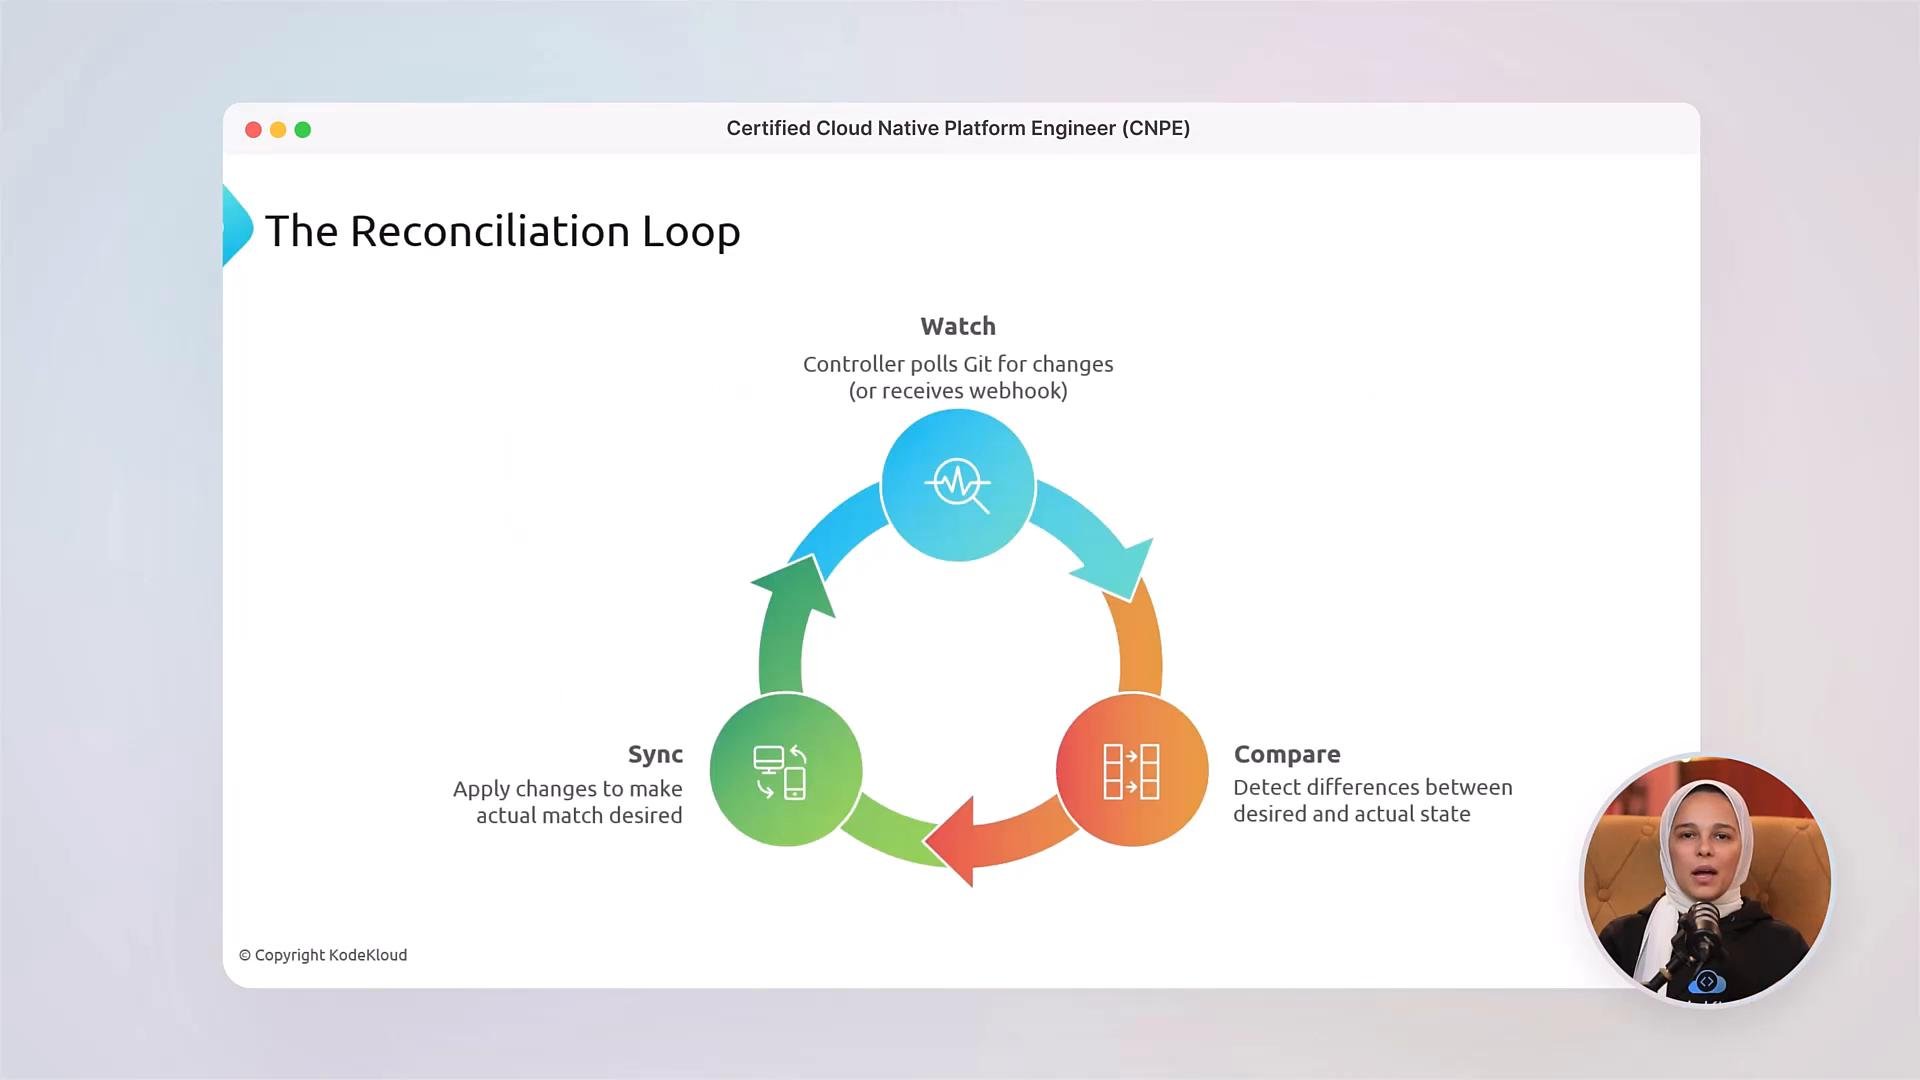
- Understand the reconciliation loop: detect differences between desired and actual state, then apply changes reliably.
- Design Custom Resource Definitions (CRDs) and build controllers/operators to automate platform tasks.
- Provide self‑service provisioning and developer APIs while preserving safe guardrails and governance.
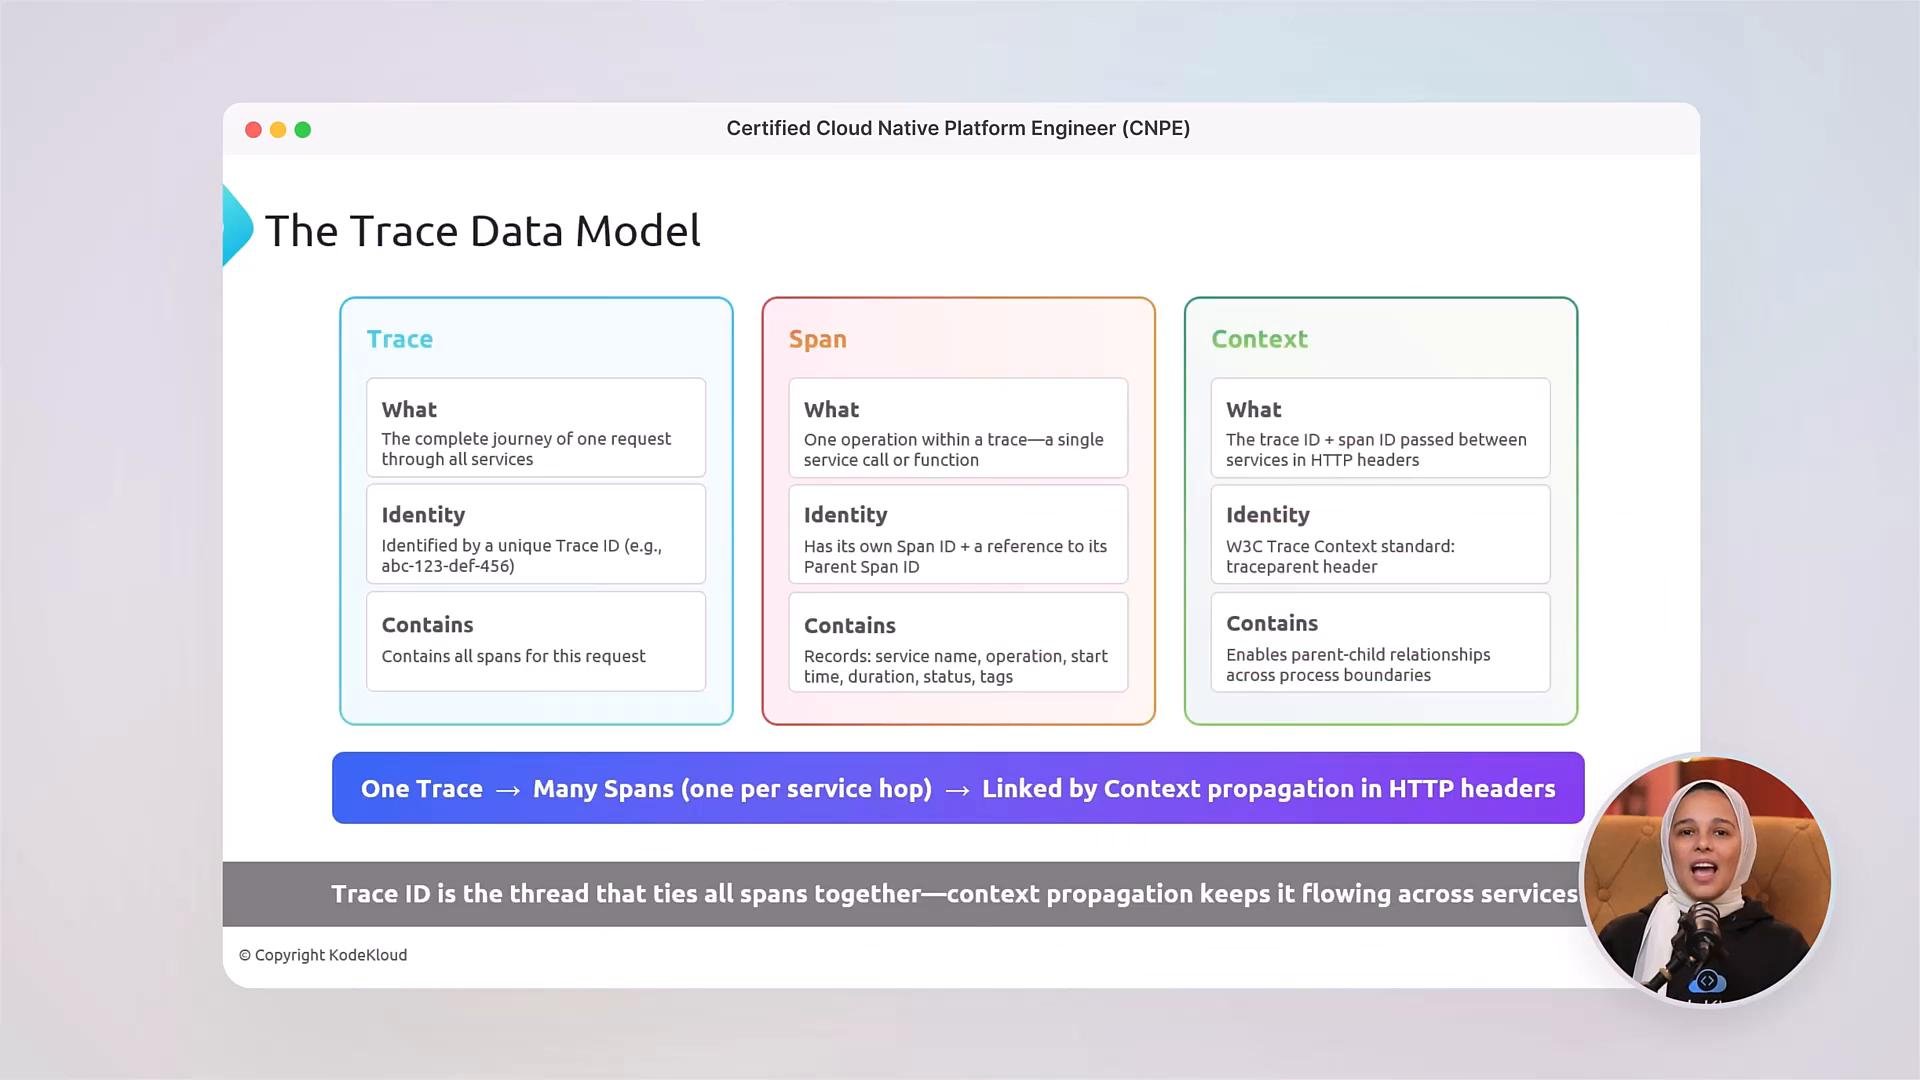
- Implement monitoring, logging, alerting, and distributed tracing to operate production systems.
- Use telemetry to detect incidents, diagnose root causes, and validate platform changes.
- Implement Role‑Based Access Control (RBAC), secure communication, and policy controls.
- Apply compliance and hardening practices across clusters and platform components.
- Hands‑on labs that mirror CNPE tasks (platform setup, GitOps reconciliation, CRD design, observability pipelines, and RBAC/policy enforcement).
- Quizzes after each module to test conceptual understanding.
- Full‑length mock exams that reproduce the CNPE exam format and time pressure so you learn to work efficiently in a live environment.
- Community support on KodeKloud channels to ask questions, share progress, and collaborate with peers during preparation.
Links and references
- Certified Kubernetes Administrator (CKA) — KodeKloud course
- Kubernetes documentation — Concepts overview
- GitOps principles and tools — Argo CD and Flux docs (example reference)