

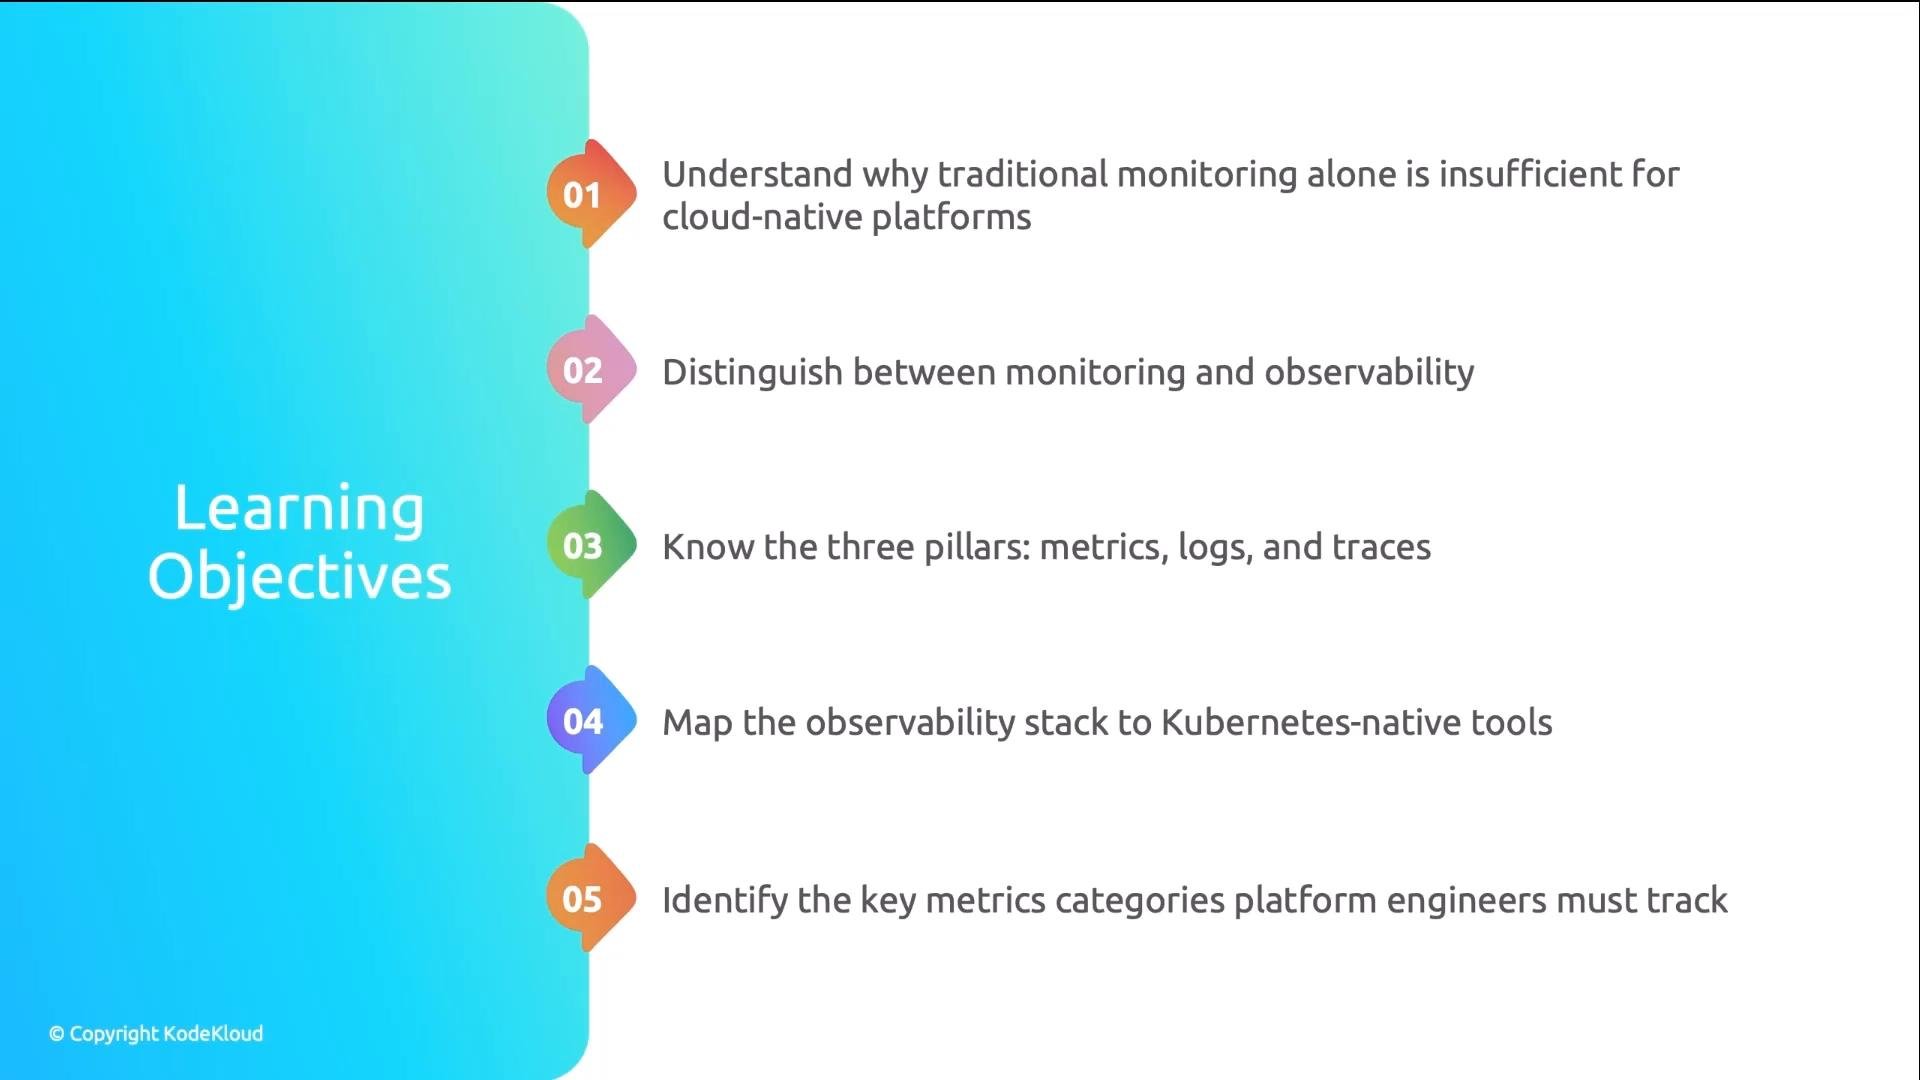
- What happened?
- Why did it happen?
- Where did it happen?
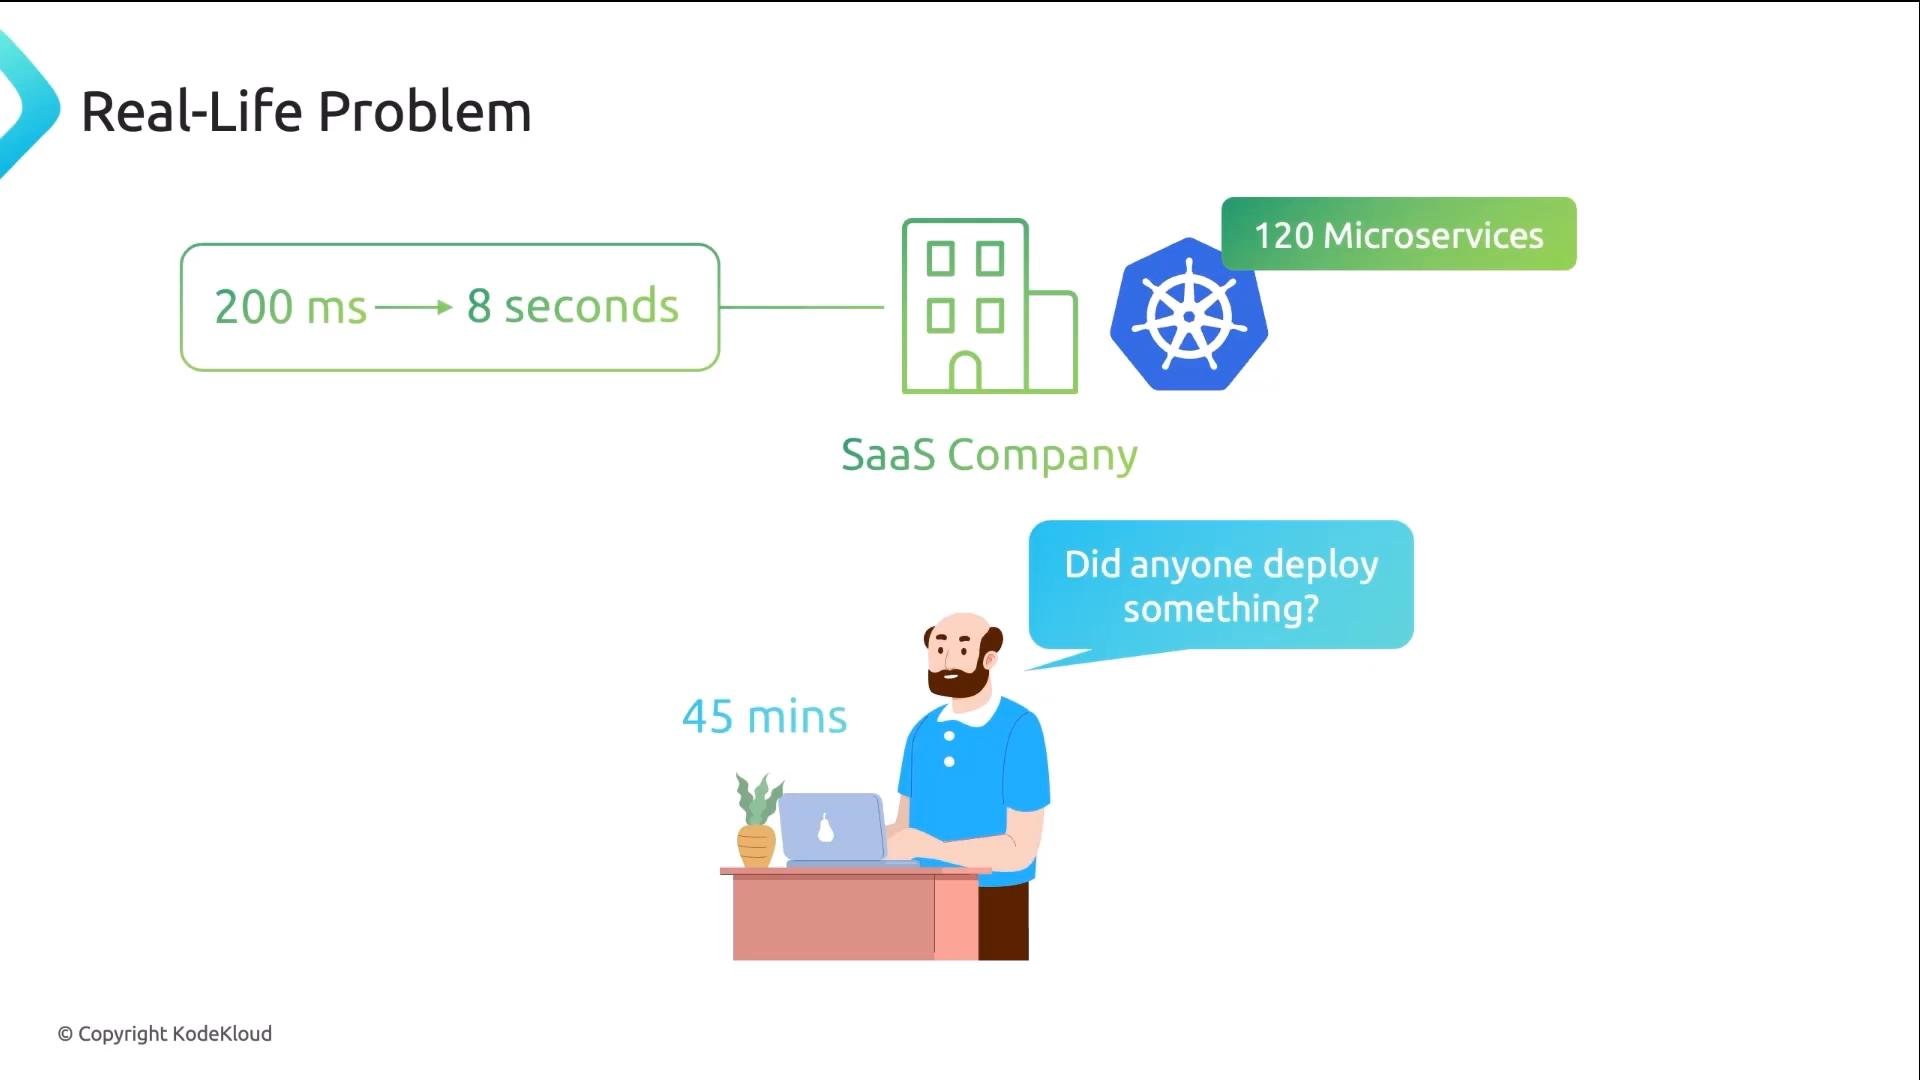
- Monitoring: predefined probes, thresholds, and alerts to answer “Is something wrong?” It detects known failure modes with checks and alarms.
- Observability: the property that lets you ask arbitrary questions about behavior and cause — including ones you didn’t plan for — by correlating multiple signals (metrics, traces, logs) to answer “What happened, why, and where?”
- Metrics: compact numeric time series (e.g., P50/P95/P99 latency, error rate, throughput). Ideal for dashboards, alerts, and trend analysis. Common tools: Prometheus (collector), Grafana (visualization).
- Logs: detailed, time-stamped text events and structured payloads that give context and human-readable failure messages. Tools to collect/forward logs: Fluentd, Fluent Bit; stores: Elasticsearch, Loki, or cloud logs.
- Traces: distributed request flows showing each hop and latency across services. Traces reveal which service/span is responsible for latency or errors. Instrumentation: OpenTelemetry SDKs and collectors; visualization: Jaeger, Tempo, or commercial tracing backends.
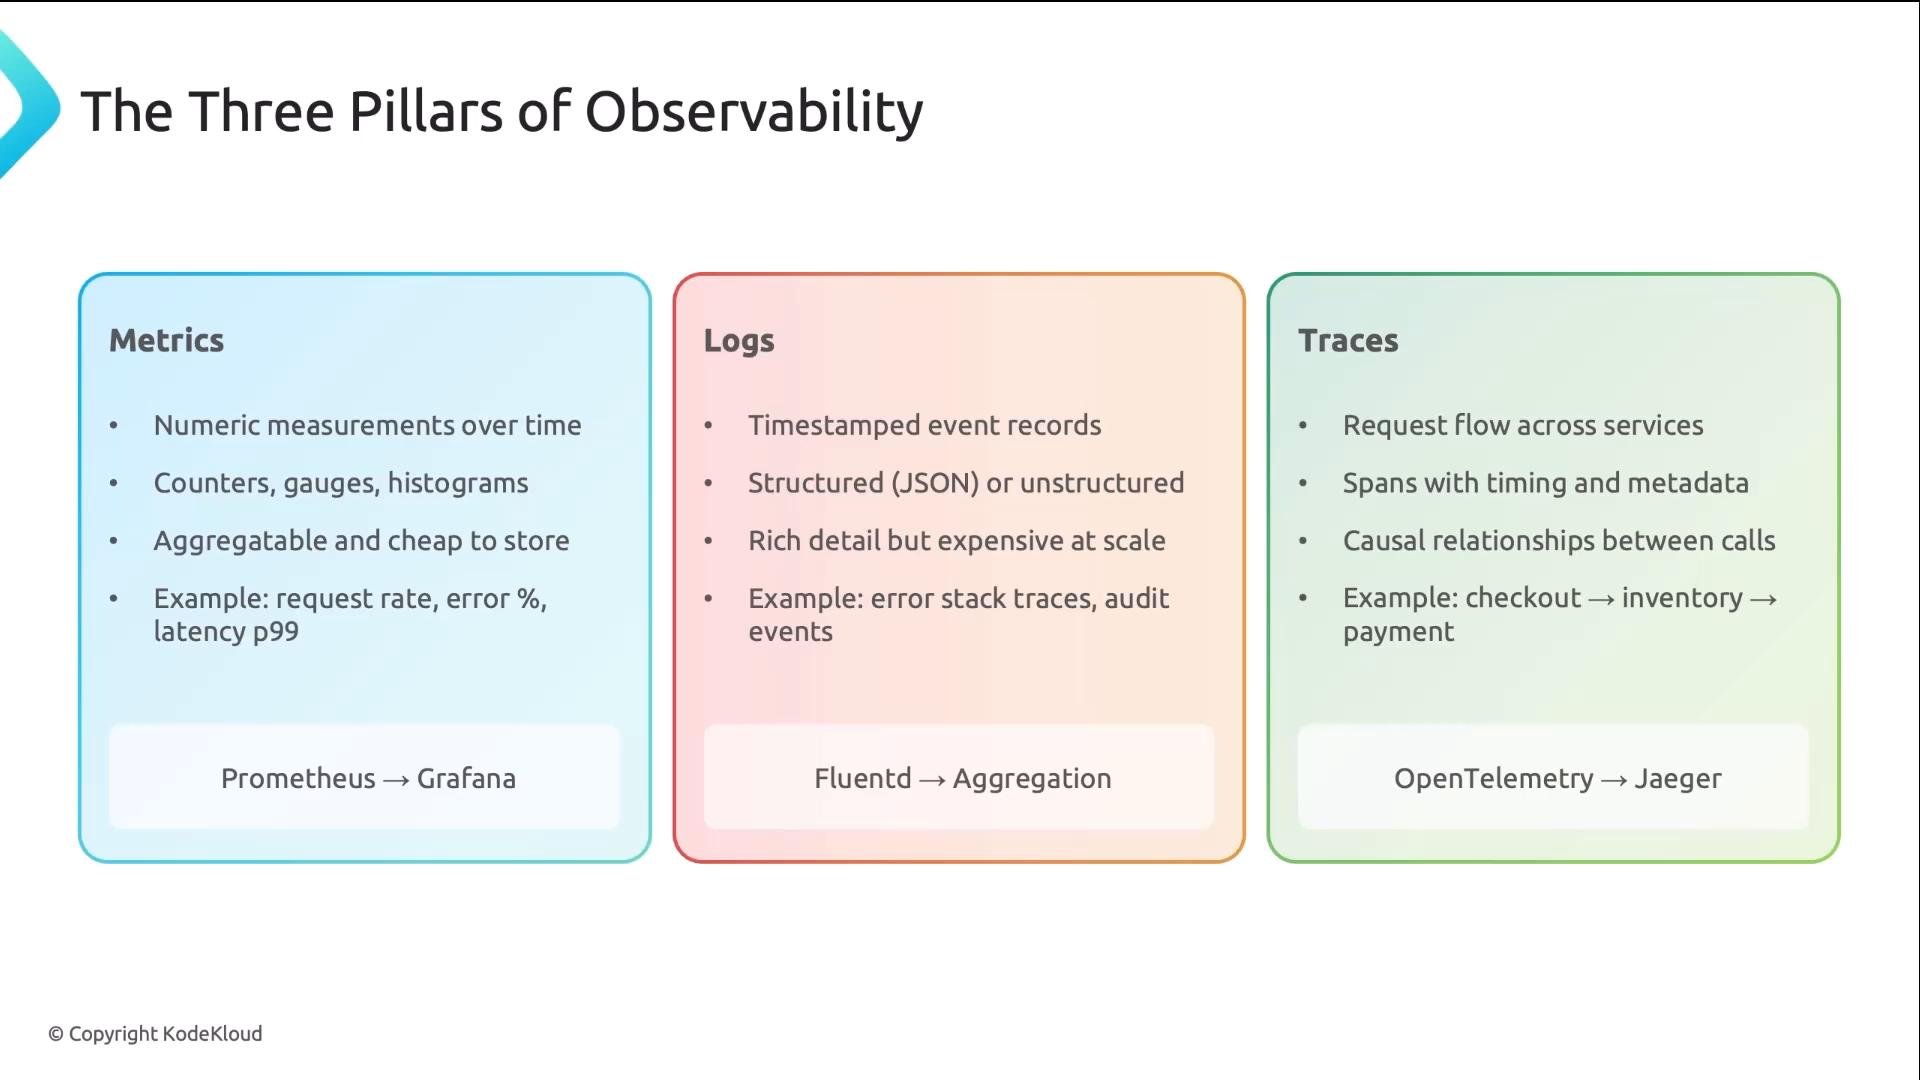
Use metrics to detect anomalies, traces to locate the impacted request path, and logs to understand the precise root cause. Combining all three is essential for investigating unknown or complex failures.
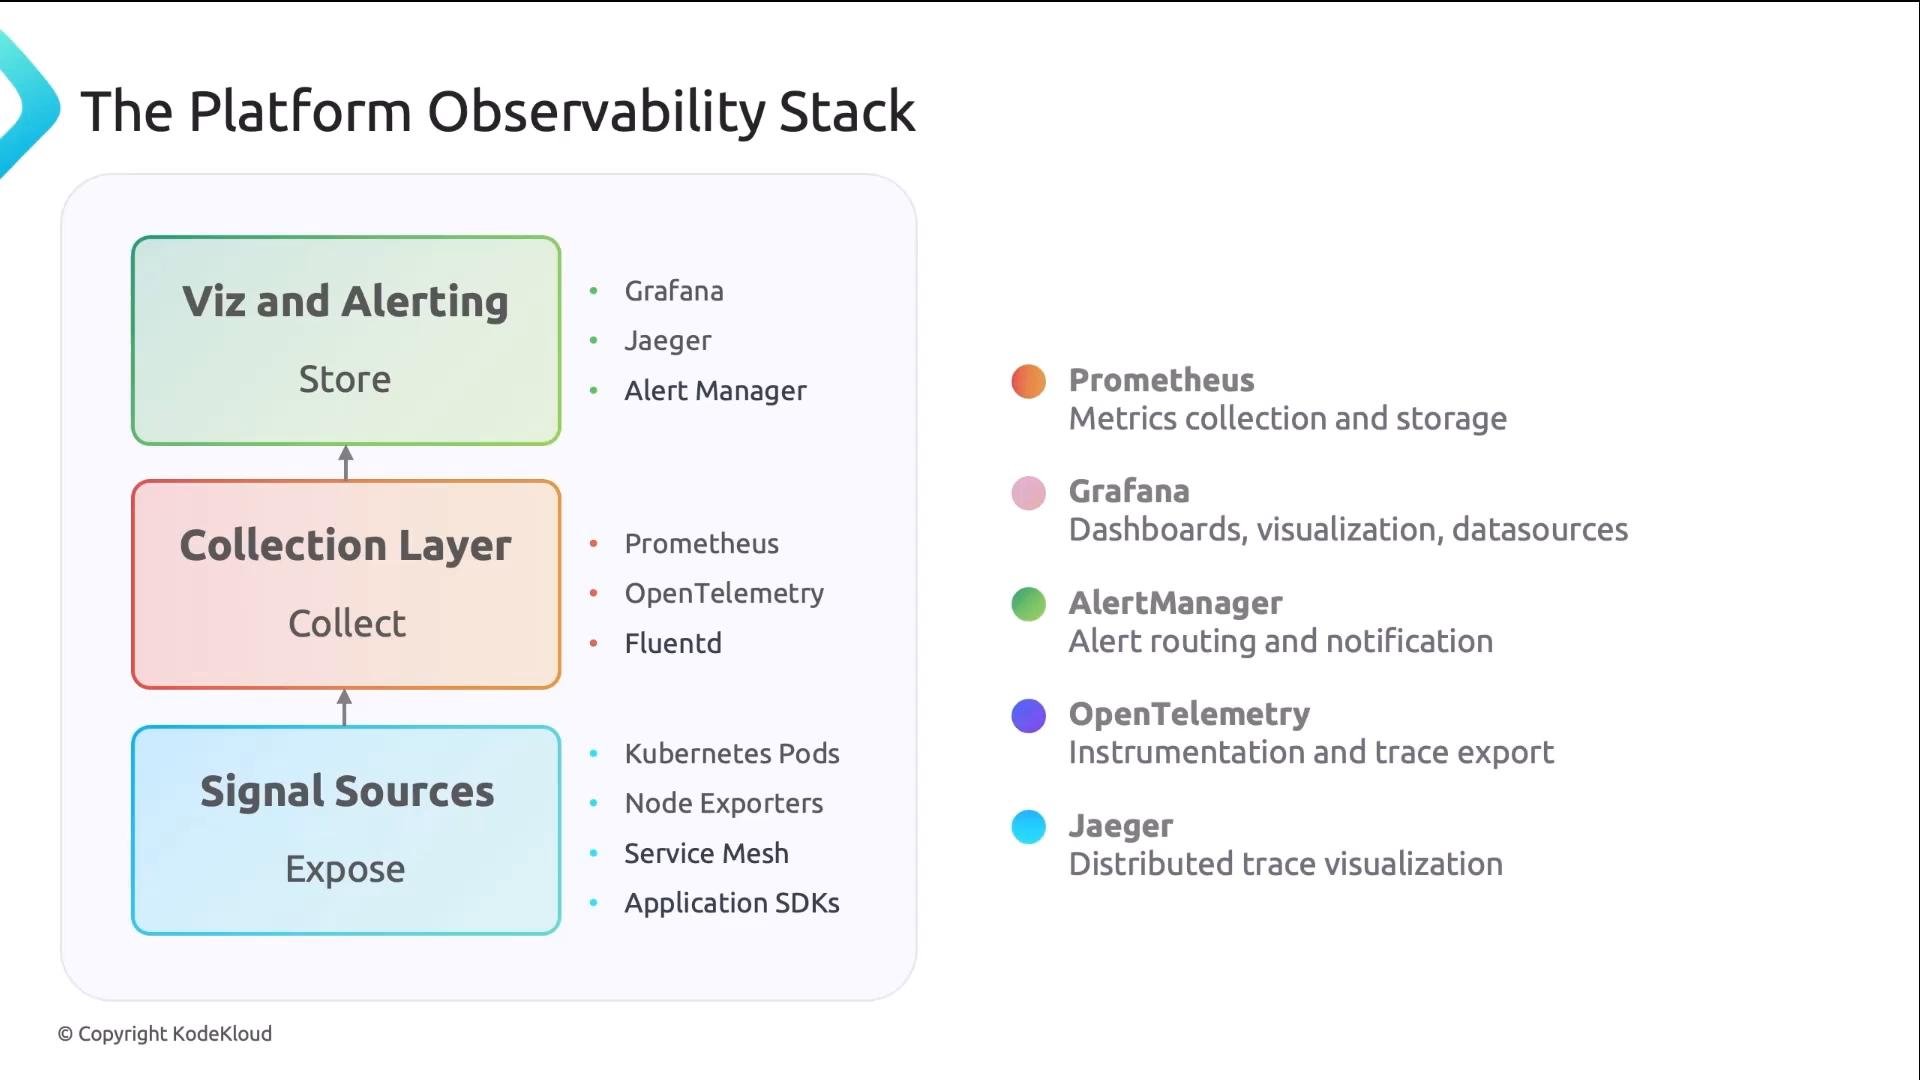
- Signal sources (Expose): instrumented apps, kubelets, node exporters, service meshes.
- Collection layer (Collect): Prometheus scrapes metrics; OpenTelemetry collects traces; Fluentd/Fluent Bit forwards logs.
- Storage, visualization, and alerting (Store/Viz): Grafana dashboards, Jaeger (or Tempo) for traces, and Alertmanager for alerts/escalation.
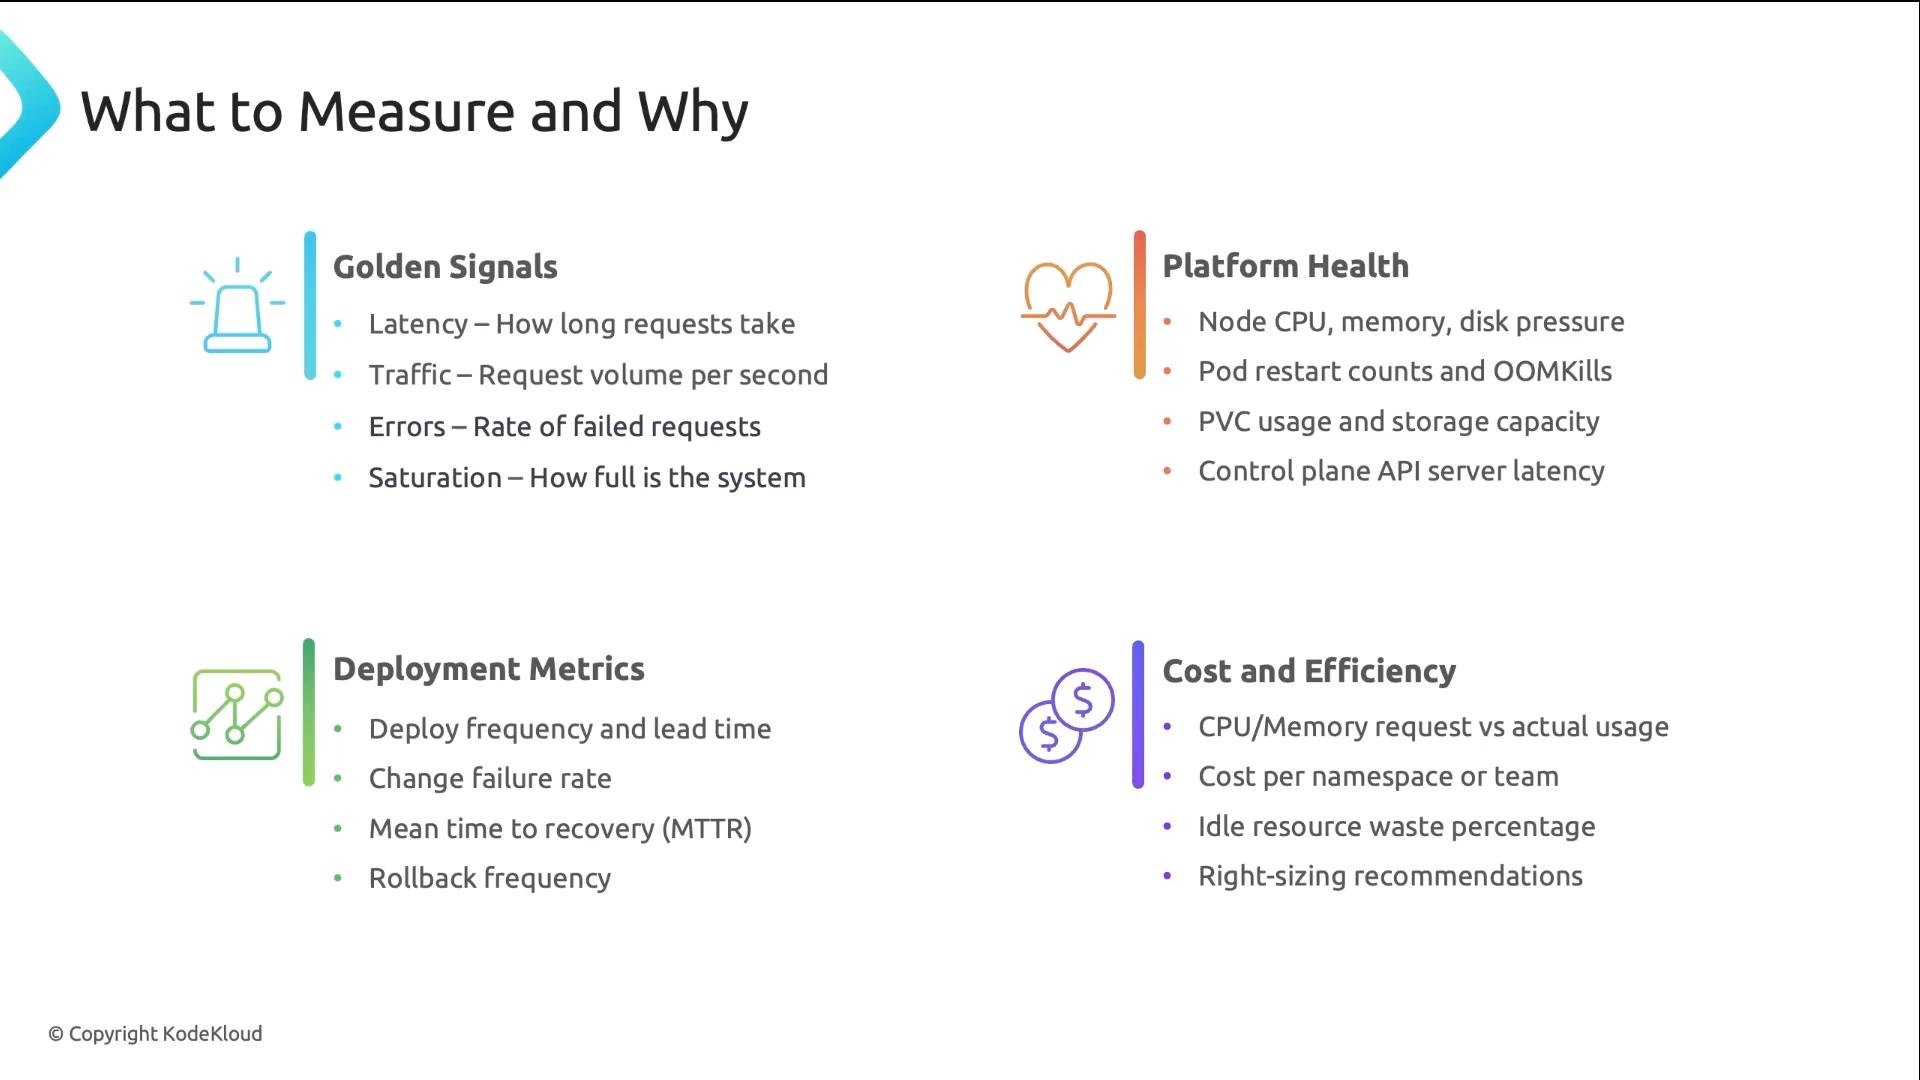
What to measure — four practical categories
When designing metrics and dashboards, group signals into these actionable categories:
-
Golden signals (from Google SRE)
- Latency: P50, P95, P99 request duration percentiles
- Traffic: requests per second (RPS), throughput
- Errors: error rate by endpoint/service
- Saturation: resource saturation (CPU, memory, disk, network) If you can only measure four things, start with these.
-
Platform health
- Node metrics: CPU, memory, disk I/O, network
- Pod metrics: restarts, OOMKills, container CPU/memory usage, probe failures
- Control plane: API server latency/errors, etcd health, scheduler latency These signals help detect infrastructure issues before they affect apps.
-
Deployment and delivery metrics (DORA)
- Deployment frequency
- Lead time for changes (commit → production)
- Change failure rate
- Mean time to recovery (MTTR) These show how your delivery pipeline impacts reliability and help prioritize platform improvements.
-
Cost and efficiency
- Requested vs actual CPU/memory usage
- Idle or over-provisioned resources
- Cost per namespace/service/environment Visibility into cost helps balance reliability with spend; tools like OpenCost make this analysis easier.
- Build and run collectors, storage, and visualization.
- Provide sane defaults: dashboards, alerting rules, tracing libraries, and onboarding guides.
- Offer templates and examples so application teams can instrument quickly and consistently.
- Define SLOs/SLIs and escalation policies so alerts are actionable and prioritized.
- Captures golden signals and platform health.
- Tracks delivery metrics (DORA) and cost/efficiency.
- Provides collectors, storage, visualization, and alerting as a managed self-service for application teams.
- Google SRE — Golden Signals: https://sre.google/sre-book/table-of-contents/
- DORA (DevOps Research & Assessment): https://devops-research.com/
- Prometheus: https://prometheus.io/
- Grafana: https://grafana.com/
- OpenTelemetry: https://opentelemetry.io/
- Jaeger: https://www.jaegertracing.io/
- OpenCost: https://opencost.io/