

Metrics tell you what happened, traces tell you where it happened, and logs explain why. By the end you’ll understand:
- why
kubectl logsfails at scale, - what structured logging looks like,
- how a log pipeline is built and operated,
- and how trace IDs tie logs to traces for rapid root-cause analysis.
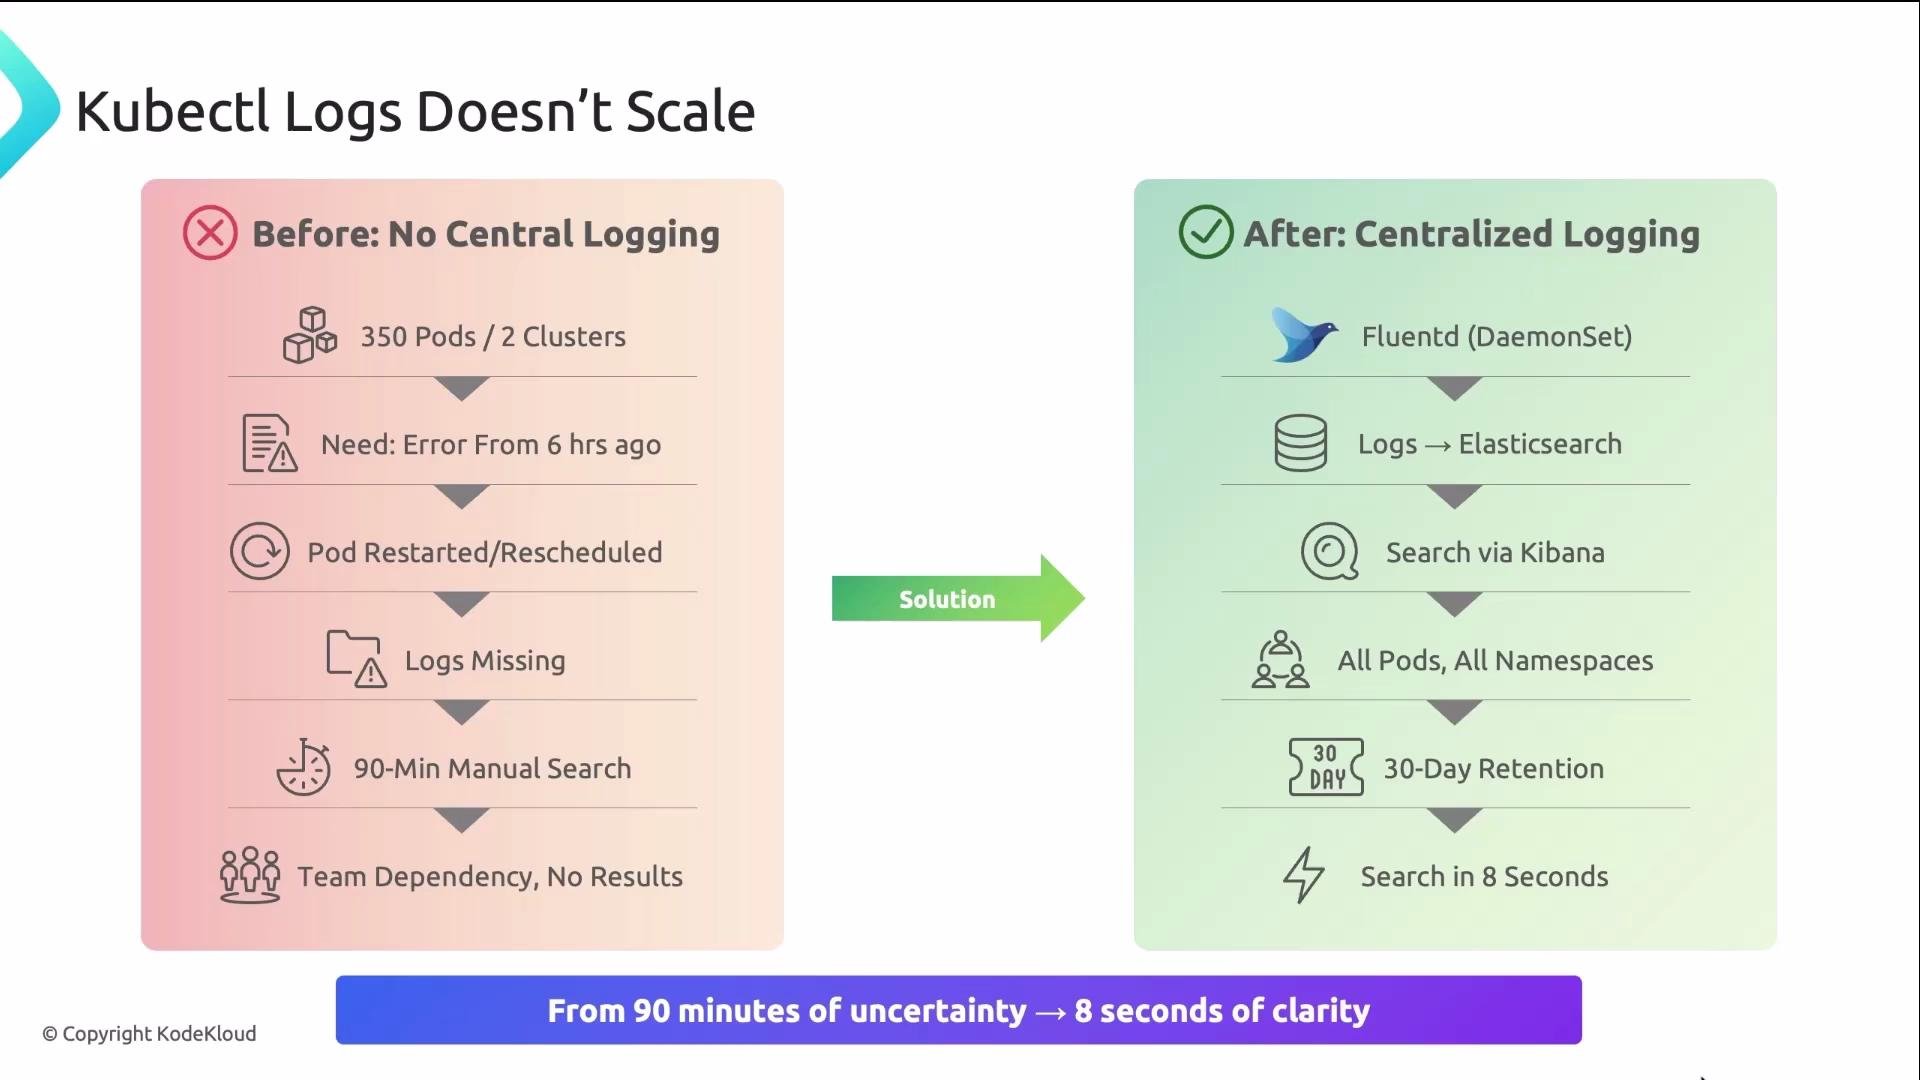
kubectl logs --previous can’t help because the pod was rescheduled to another node. Ninety minutes later, the team still doesn’t know the root cause.
After implementing centralized logging, the same investigation took eight seconds. What took 90 minutes of searching became an instant query.
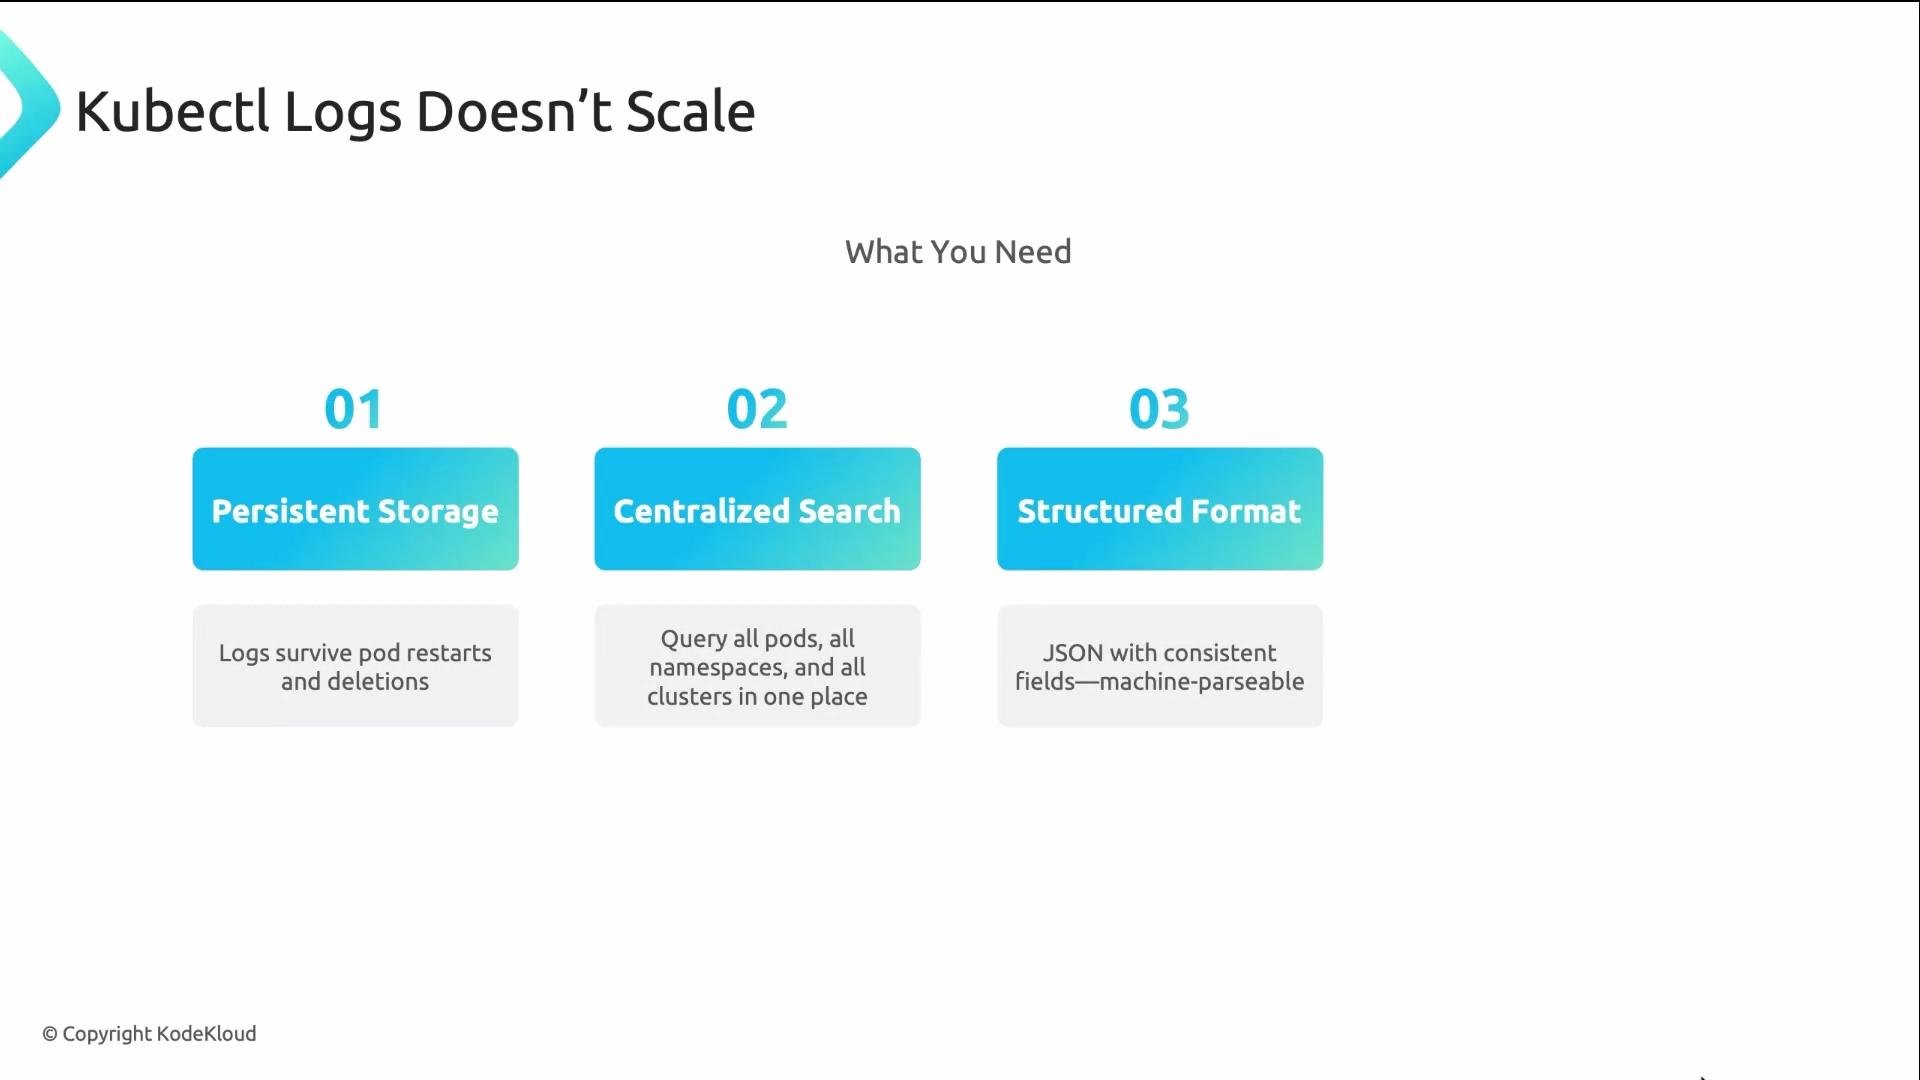
- Pods are ephemeral: restarts, evictions, and reschedules remove local log files.
- No global search across pods or clusters.
- Difficult or impossible to correlate events across services.
- No retention guarantees for the specific logs you need.
- persistent storage,
- centralized search and indexing,
- structured log format,
- and correlation IDs to link logs to traces.
trace_id field is the bridge between logs and traces. Click a trace_id in a log entry and jump to your tracing UI (for example, Jaeger) to see the full distributed trace.
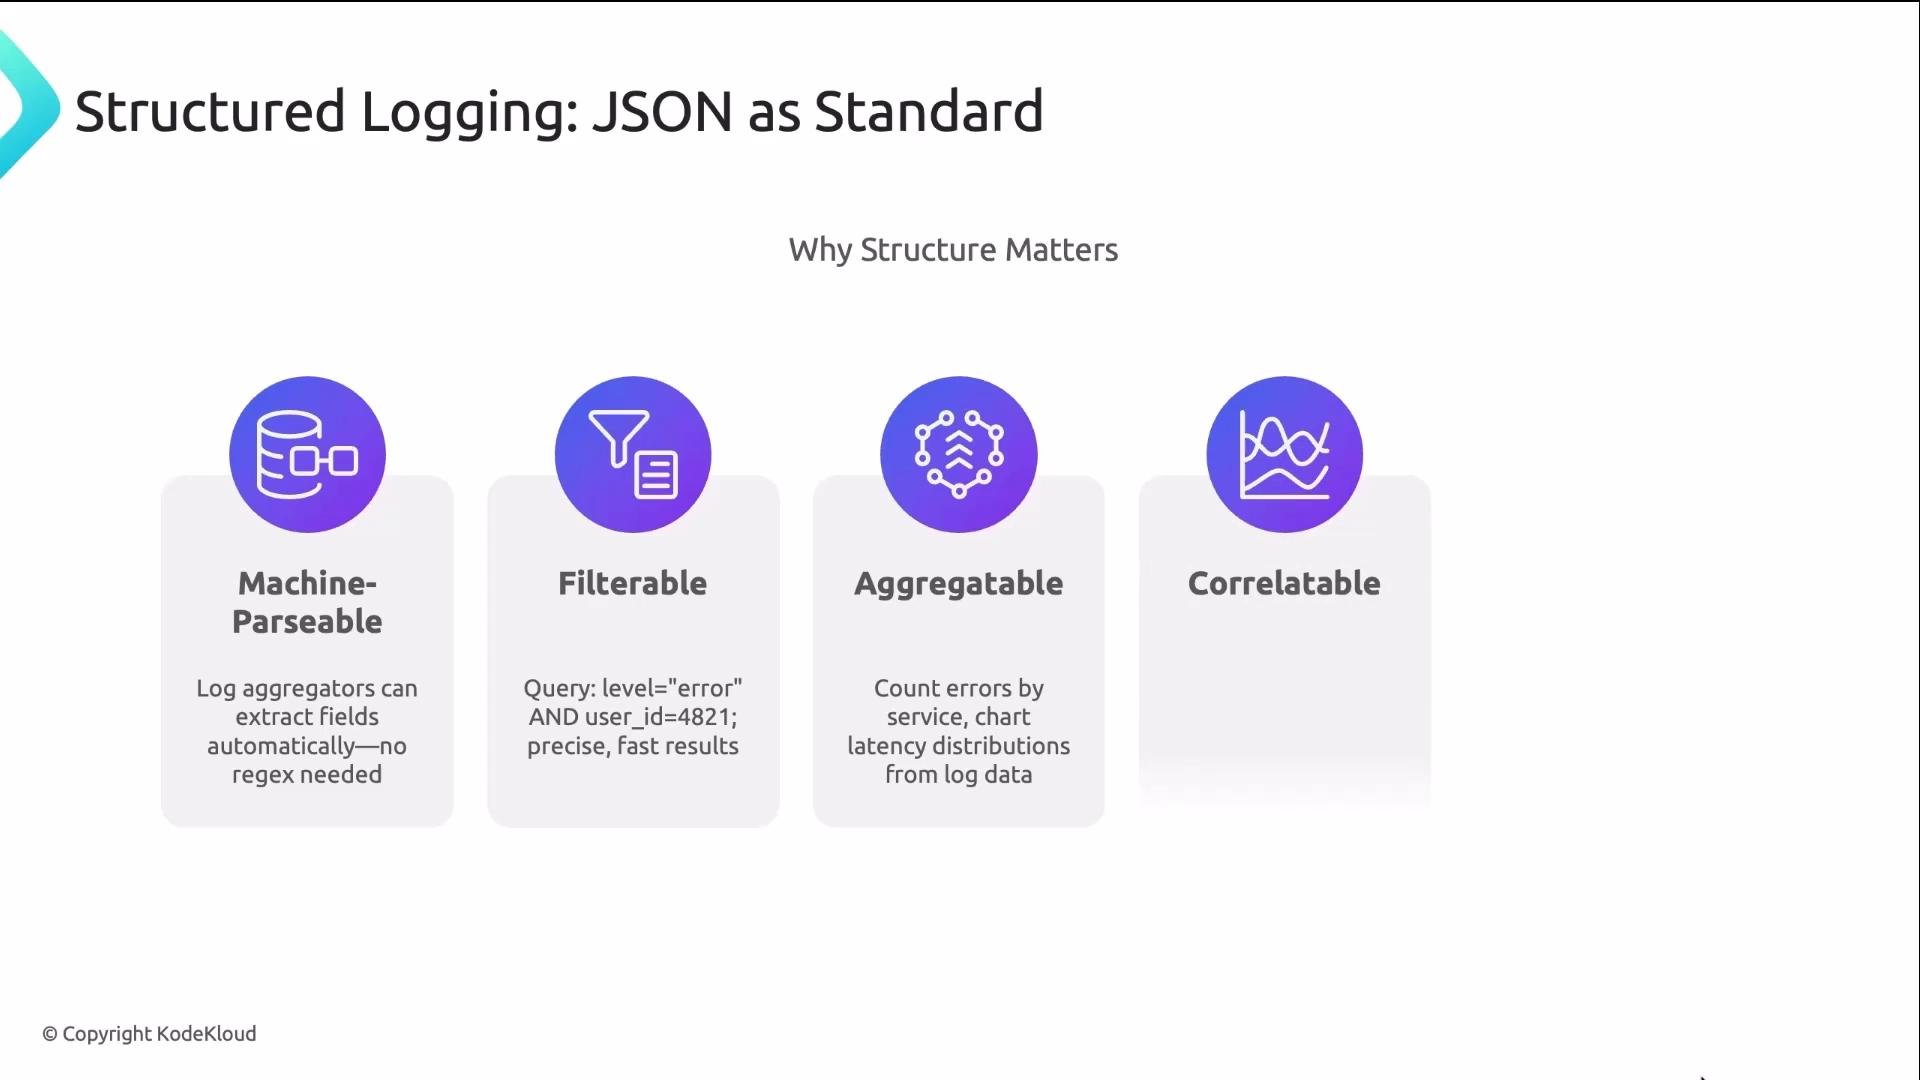
- Machine-parsable: avoids brittle regex extraction.
- Filterable: run precise queries such as
level="error" AND user_id=4821. - Aggregatable: count and group errors per service.
- Correlatable: link logs to traces using trace IDs.
Application teams should emit structured JSON to stdout. Platform teams are responsible for collection, enrichment, shipping, storage, and the query UI.
-
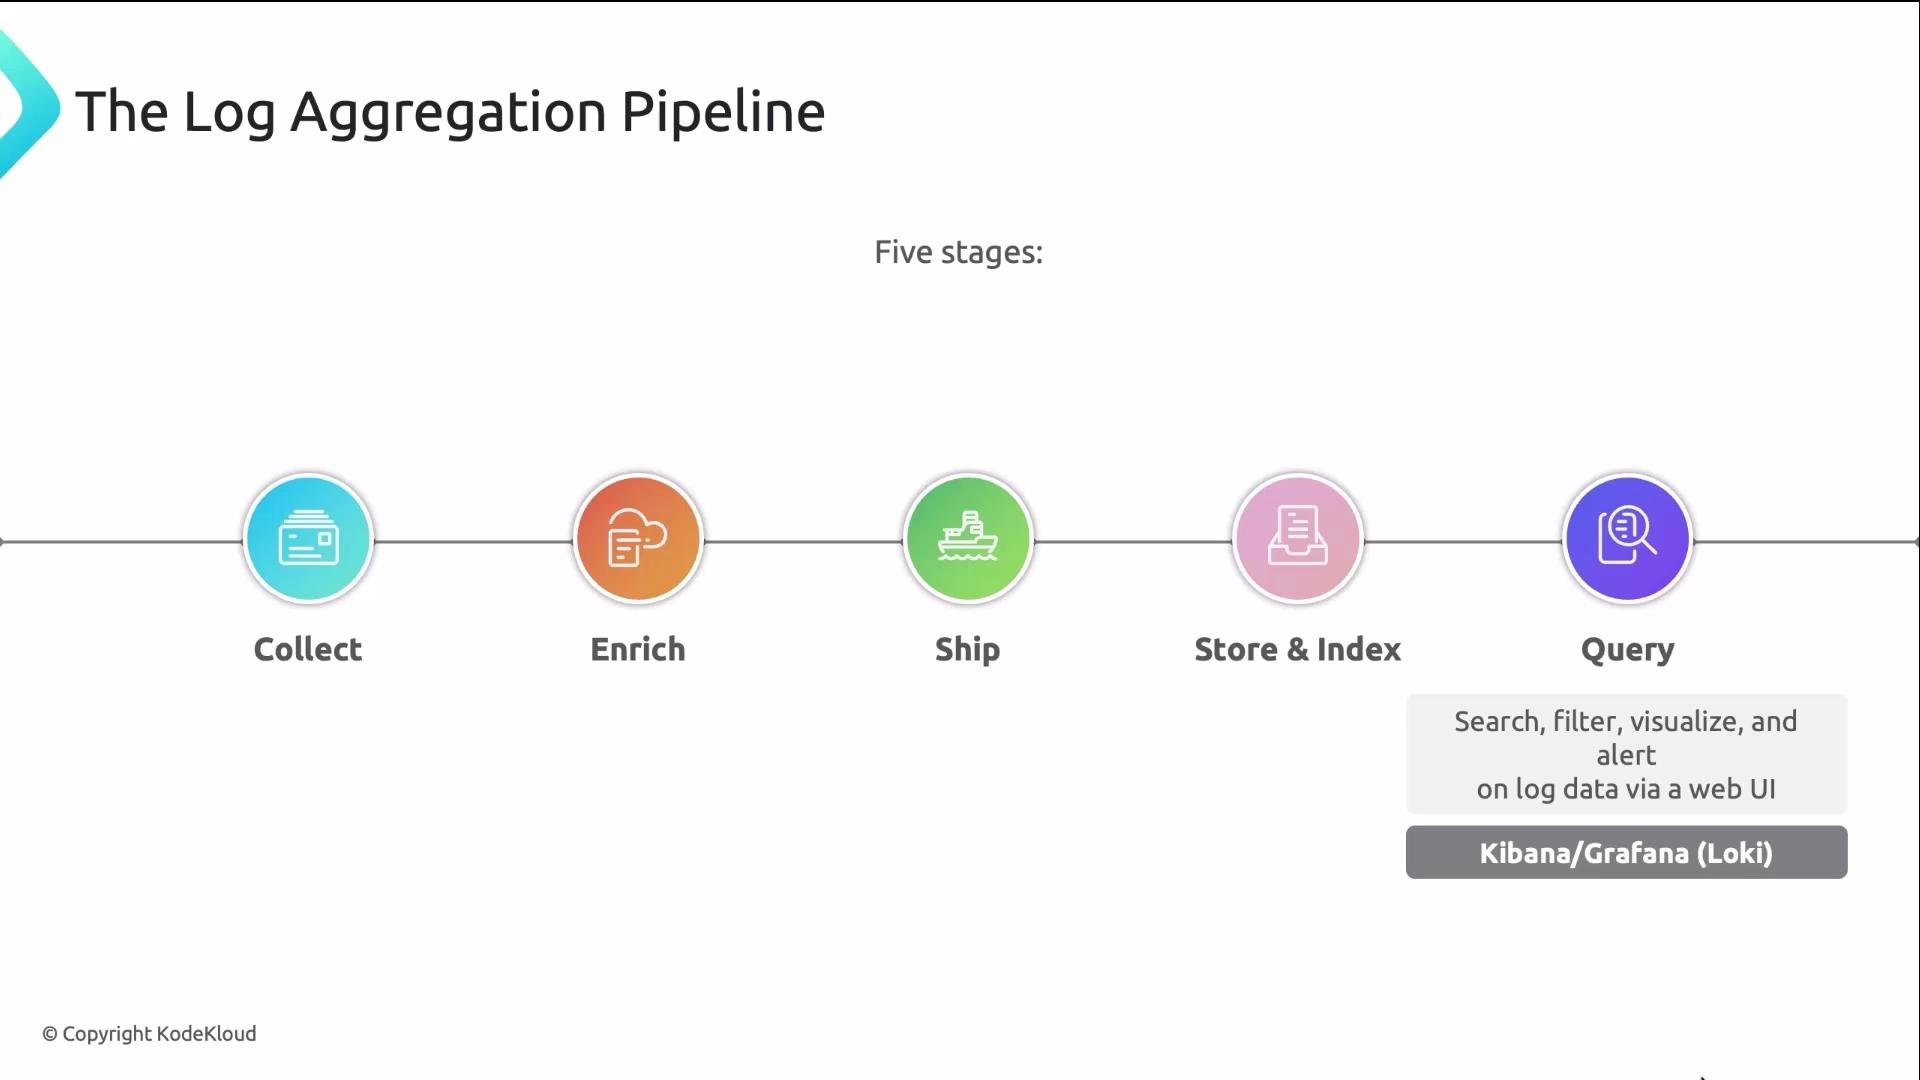
Collect
Run a collector as a DaemonSet on each cluster node to tail container logs from directories such as/var/log/containers. Popular collectors:- Fluentd — feature-rich aggregator (fluentd.org)
- Fluent Bit — lightweight (fluentbit.io)
- Promtail — for pushing to Loki (Grafana Loki)
-
Enrich
The collector attaches Kubernetes metadata (namespace, pod name, container, labels). This metadata powers label-based queries and dashboards. -
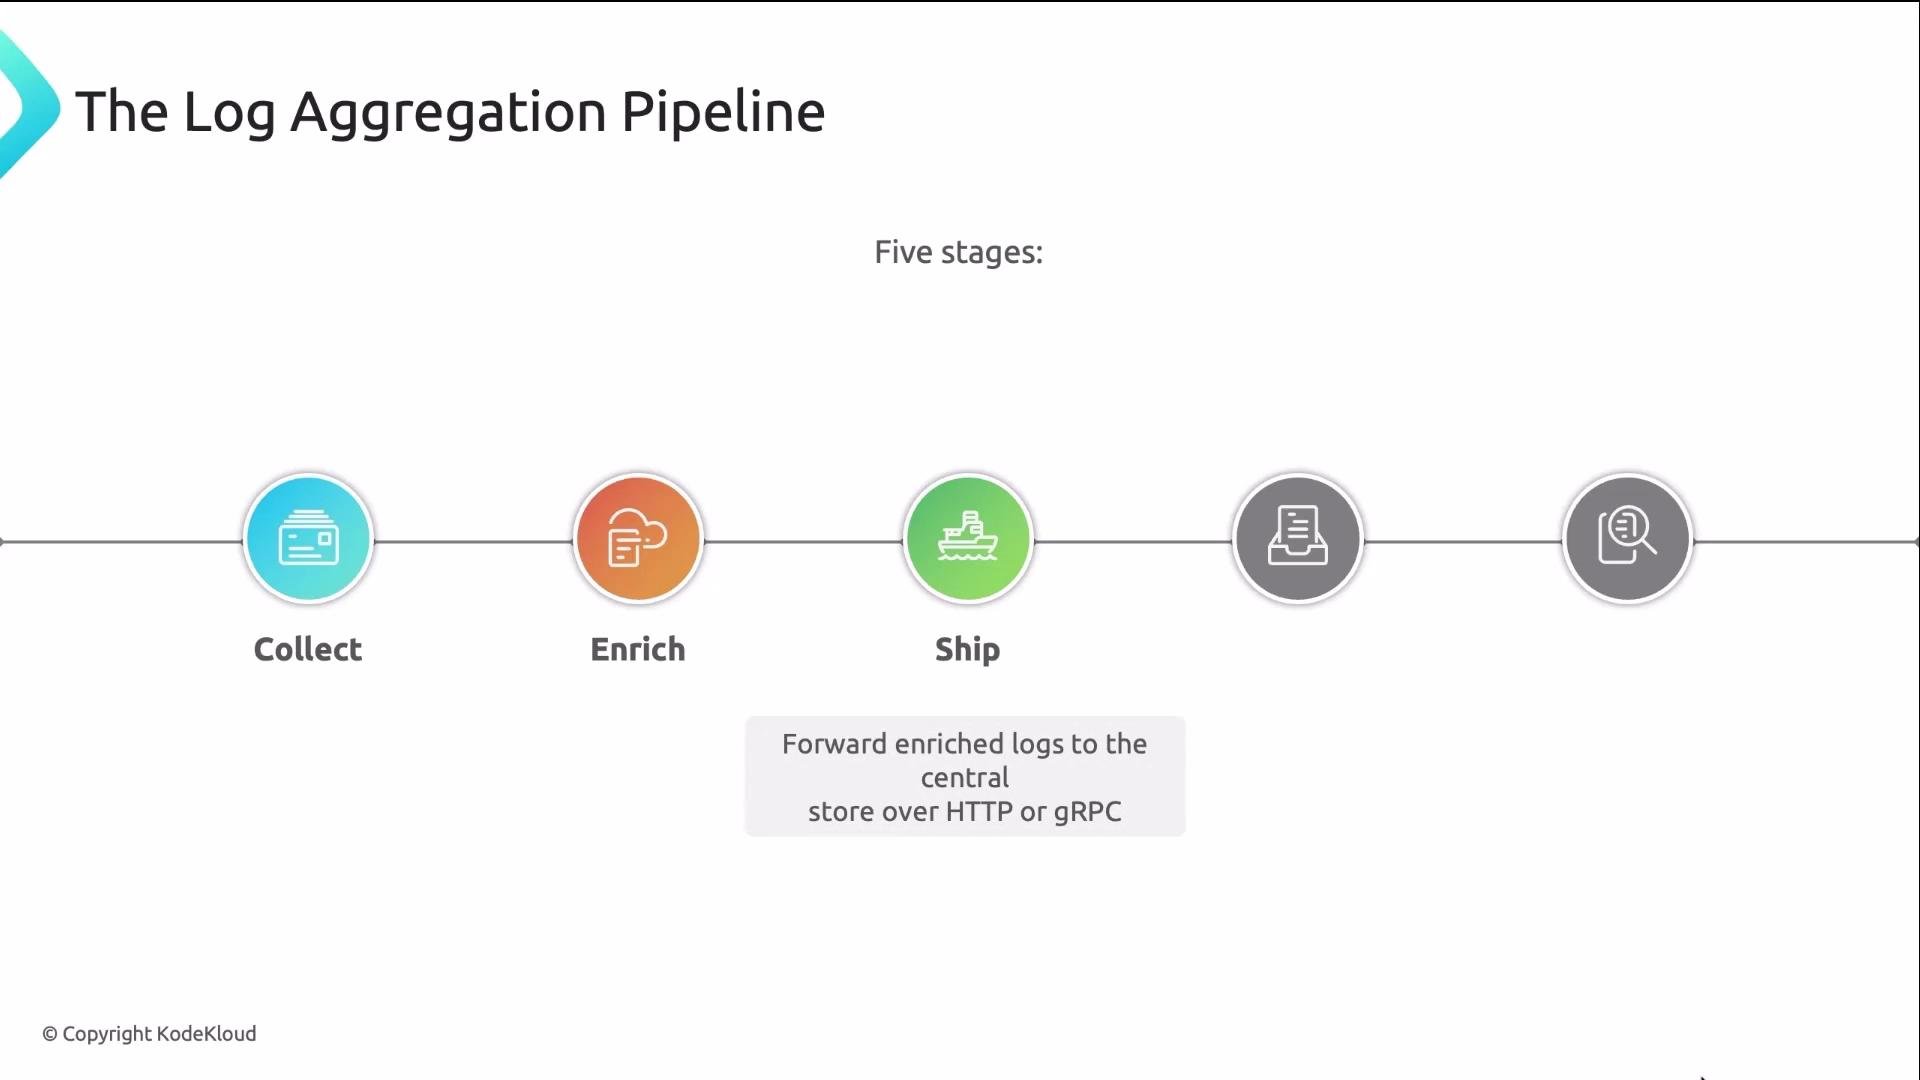
Ship
Forward enriched logs over HTTP/gRPC (or supported protocols) to a central ingestion endpoint or scaling message bus. -
Store & Index
Choose the storage/indexing trade-off:- Elasticsearch: full-text indexing, powerful search, higher cost (elastic.co)
- Loki: indexes labels only and stores log content efficiently, integrates with Prometheus/Grafana (grafana.com/oss/loki)
-
Query
Provide a UI for searching, filtering, and visualizing logs:- Kibana for Elasticsearch
- Grafana for Loki (and multi-source dashboards)
-
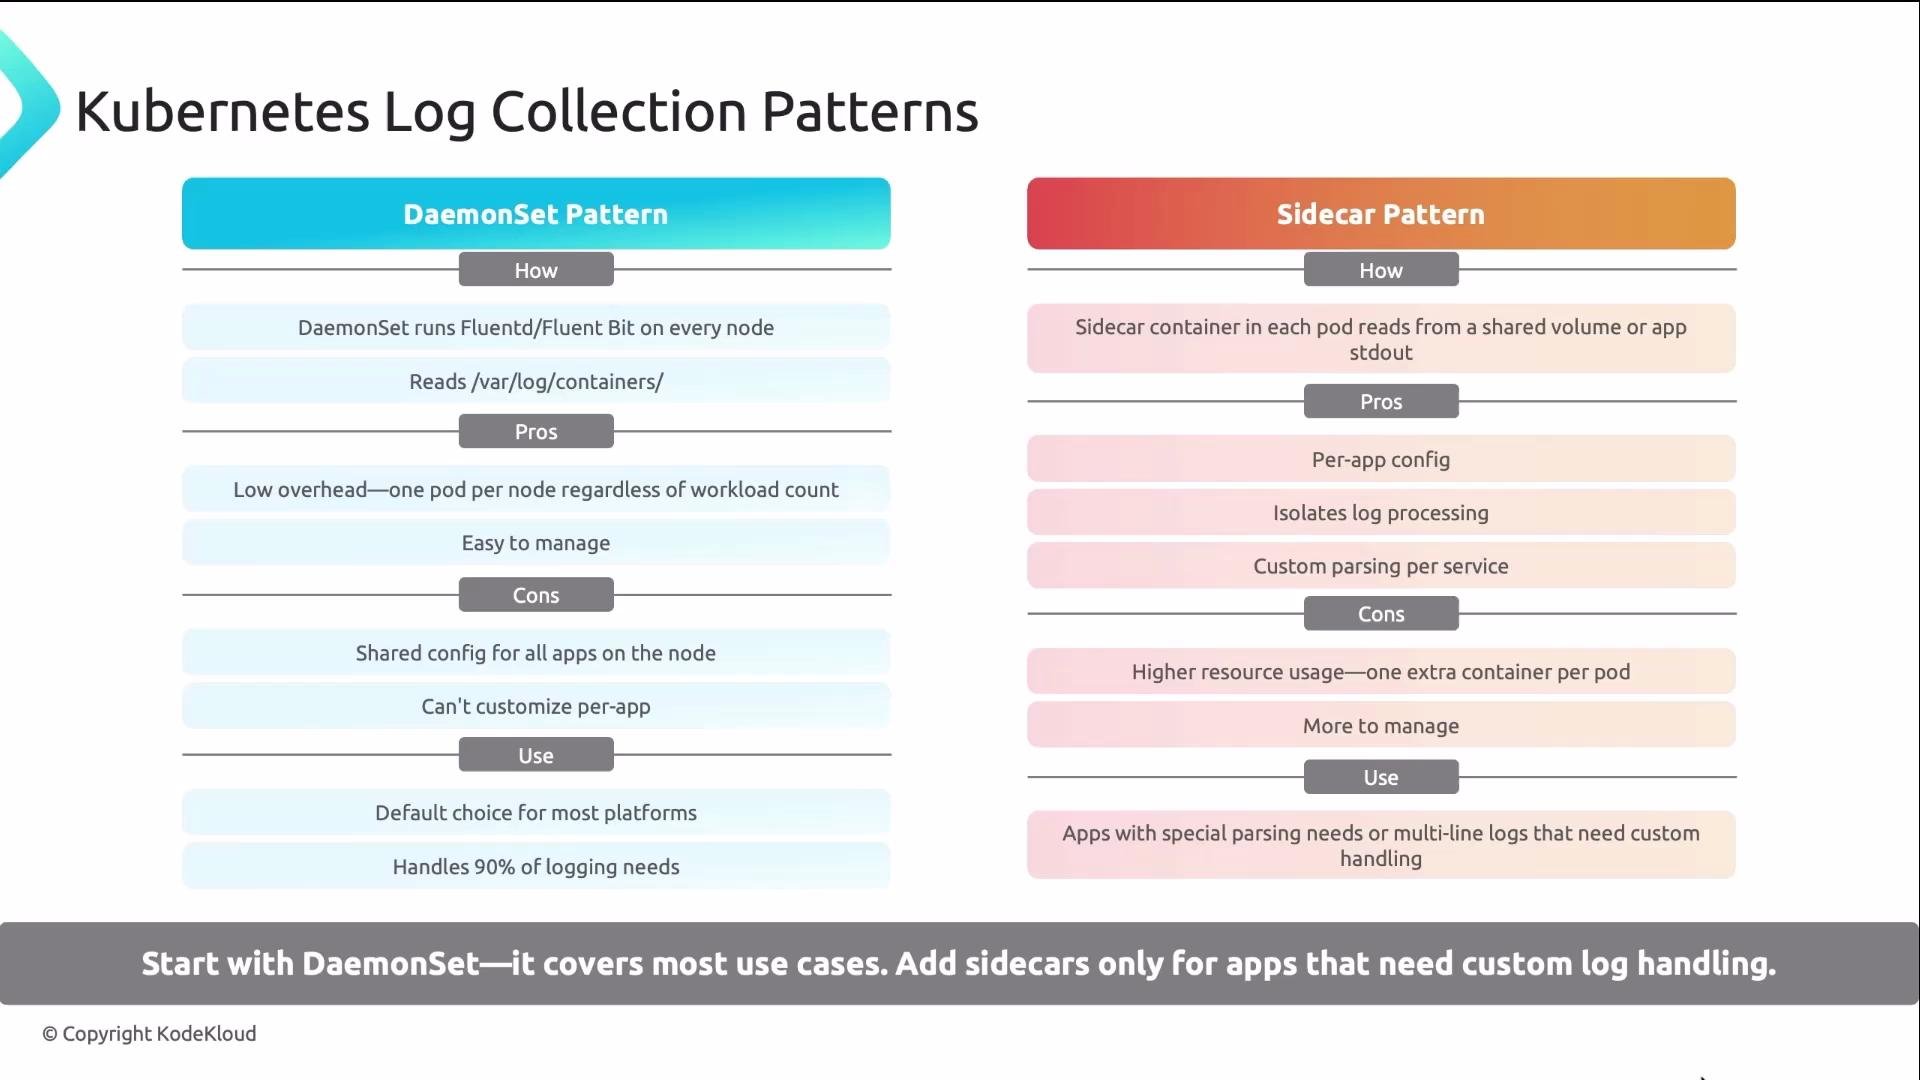
DaemonSet pattern (default)
One collector per node that mounts the host log directory and tails all containers. Pros: low overhead, simple, works for roughly 90% of use cases. Start here. -
Sidecar pattern (per-pod)
A per-pod sidecar collects stdout or file logs from the application. Useful for apps with unusual formats, multi-line logs, or when you need per-app customization. Cons: higher resource usage and more maintenance. Use only for exceptions.
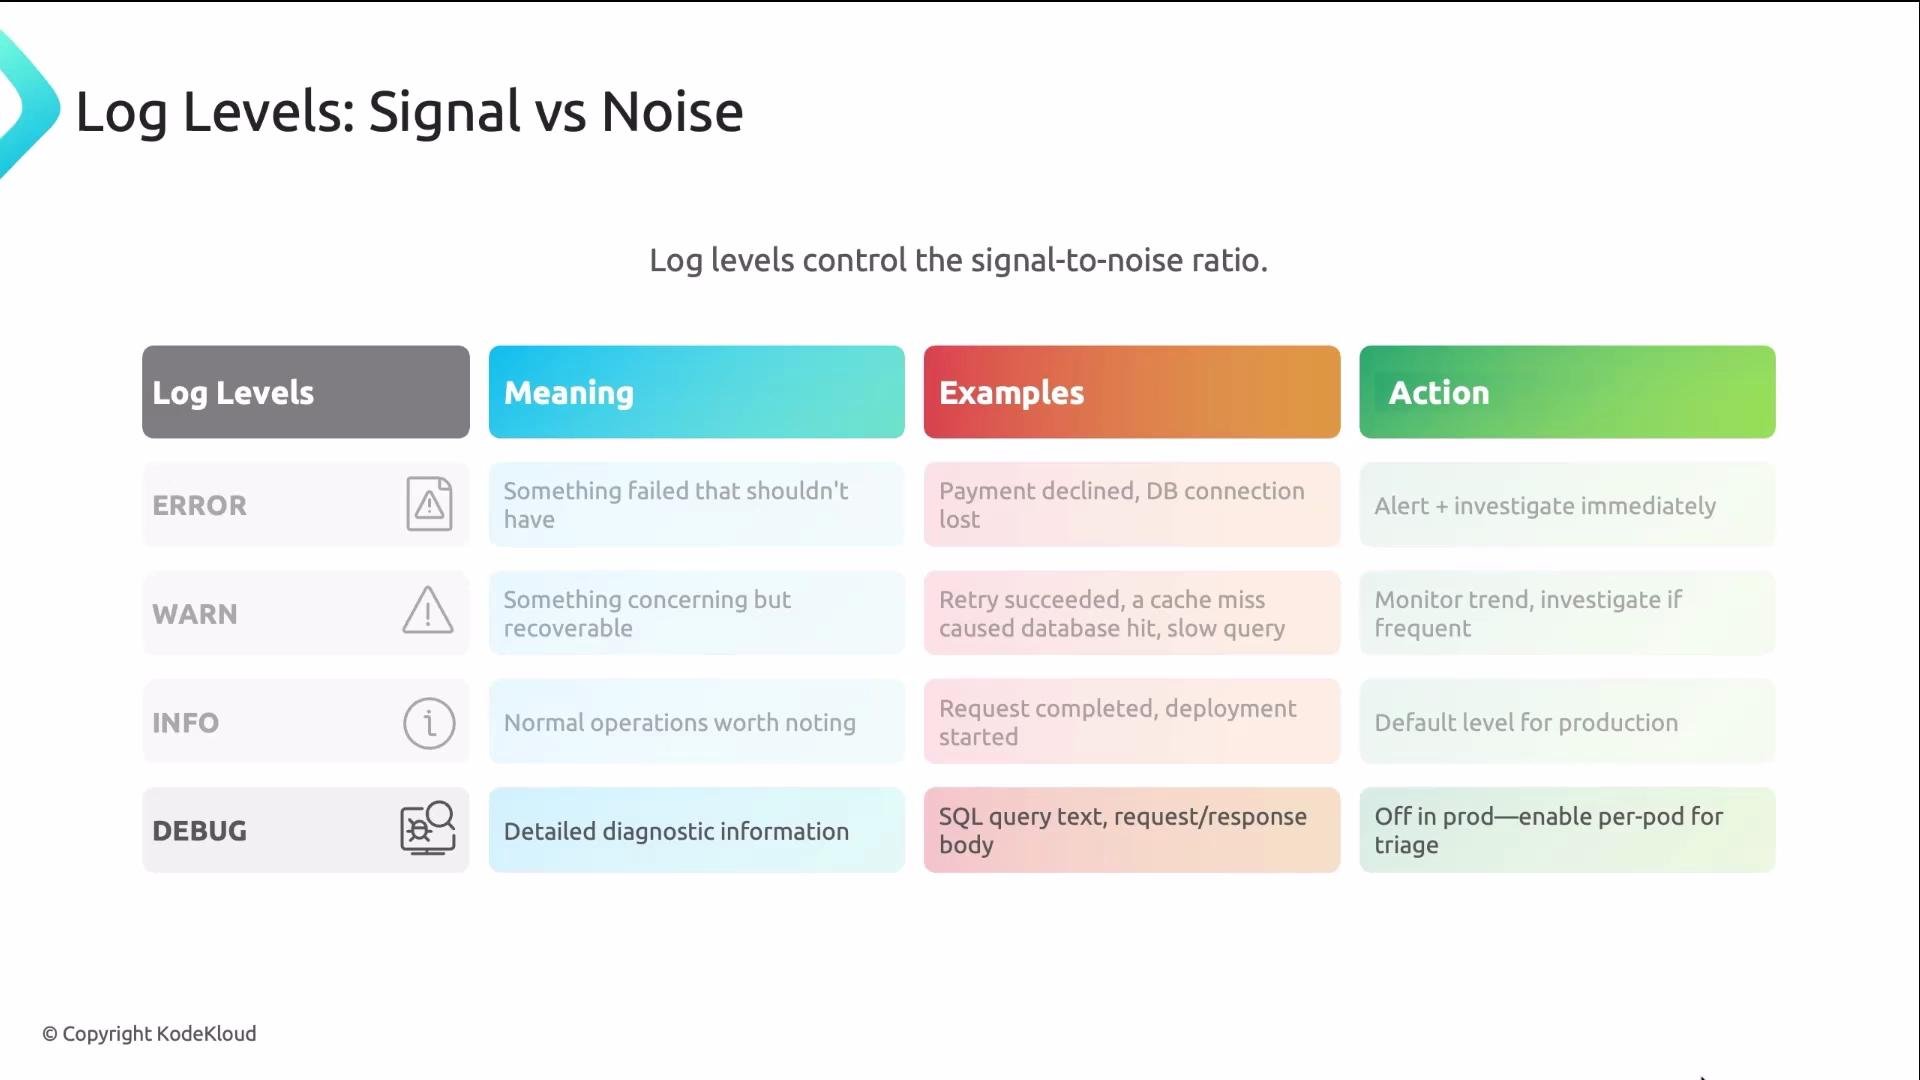
Do not run DEBUG logging globally in production — it generates high volume and may expose sensitive diagnostic data. Enable DEBUG only for targeted troubleshooting.
- Default to
INFO. - Alert on
ERROR. - Use dashboards to monitor
WARNtrends. - Enable
DEBUGonly for specific pods or short-lived investigations.
- Observe an error spike in metrics (Grafana/Prometheus).
- Filter logs for
level="error"in the time window and find entries with atrace_id. - Click the
trace_idto open your tracer (e.g., Jaeger). - The trace waterfall highlights the failing span — you now see where and why.
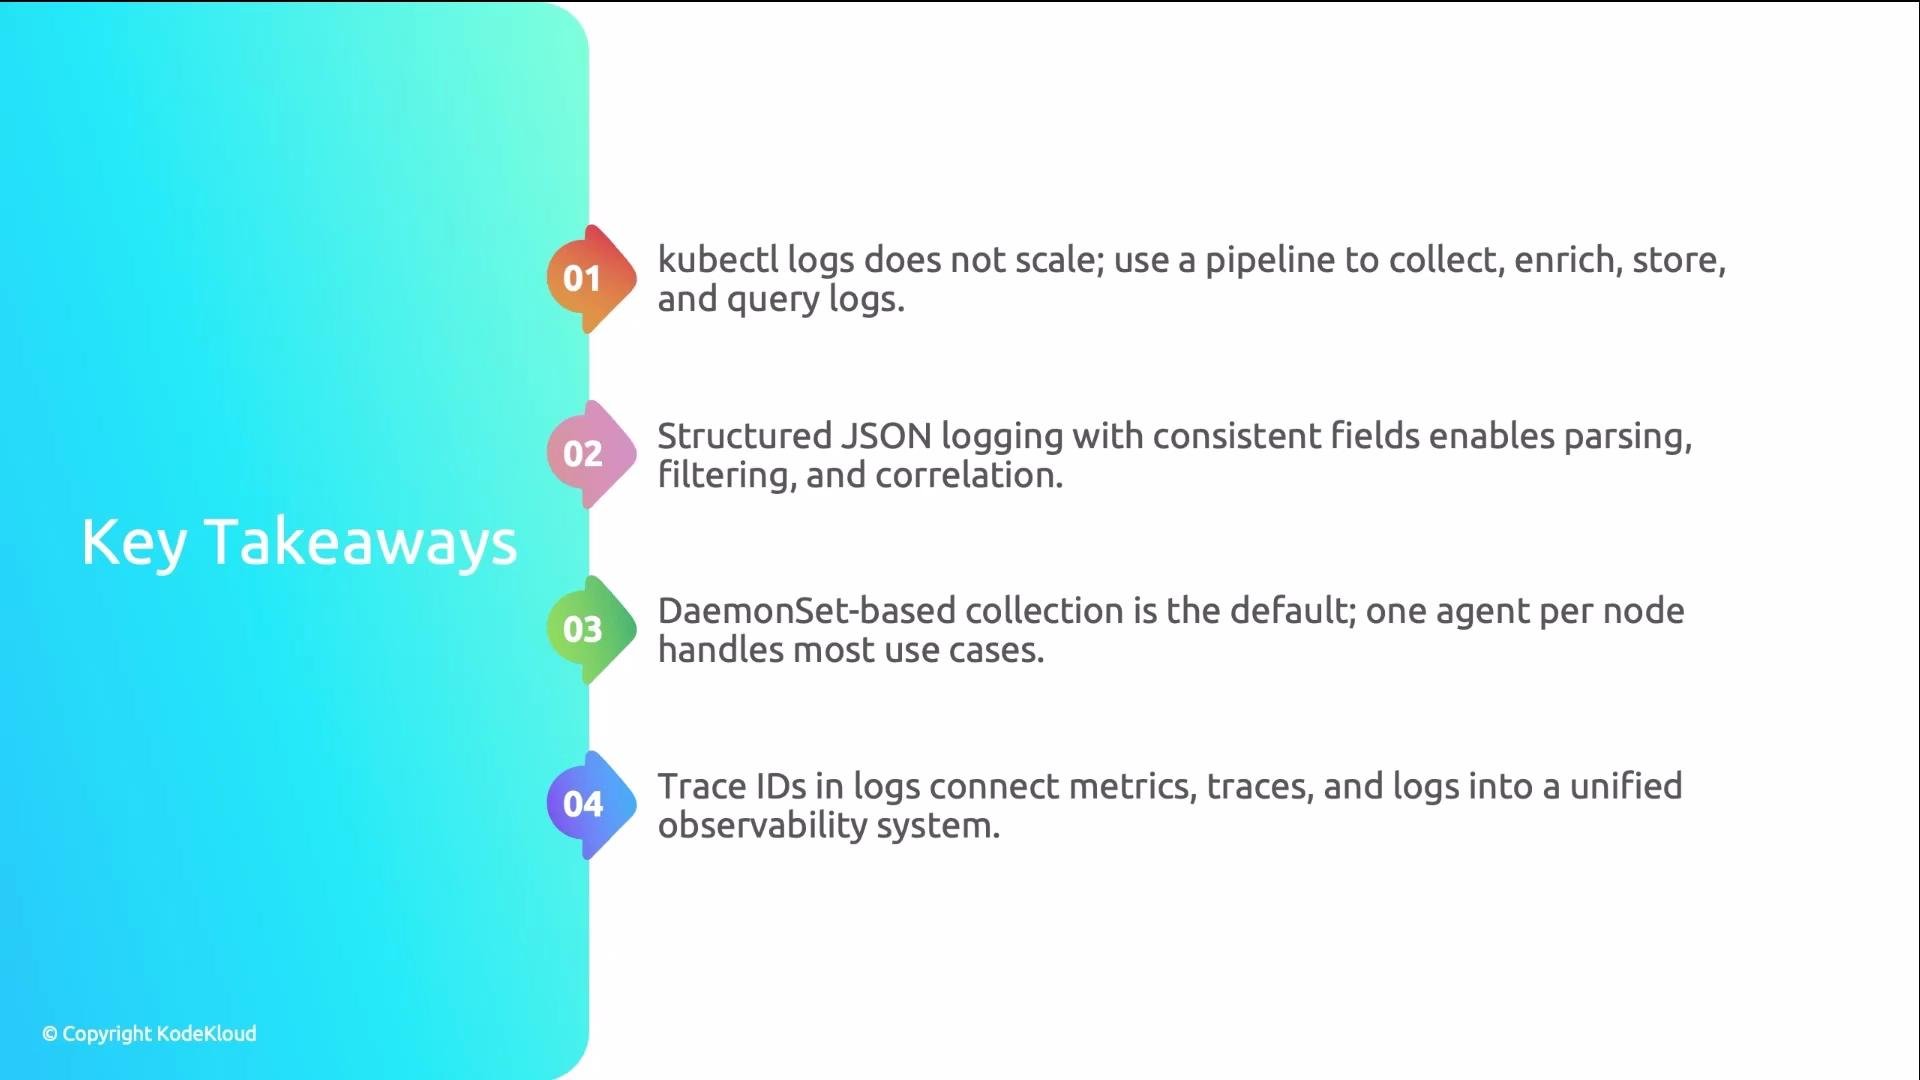
kubectl logsis useful for quick debugging but does not scale for post-mortem analysis across many ephemeral pods — use a logging pipeline.- Structured JSON logs are essential for reliable enrichment, indexing, and querying.
- Start with a DaemonSet collector; use sidecars only for apps that need special handling.
- Emit trace IDs with logs and link to tracing tools (Jaeger, Zipkin, or OpenTelemetry backends) for fast root-cause analysis.
- OpenTelemetry: https://opentelemetry.io/
- Jaeger: https://www.jaegertracing.io/
- Fluentd: https://www.fluentd.org/
- Fluent Bit: https://fluentbit.io/
- Grafana Loki: https://grafana.com/oss/loki/
- Elasticsearch: https://www.elastic.co/elasticsearch
- Prometheus: https://prometheus.io/