

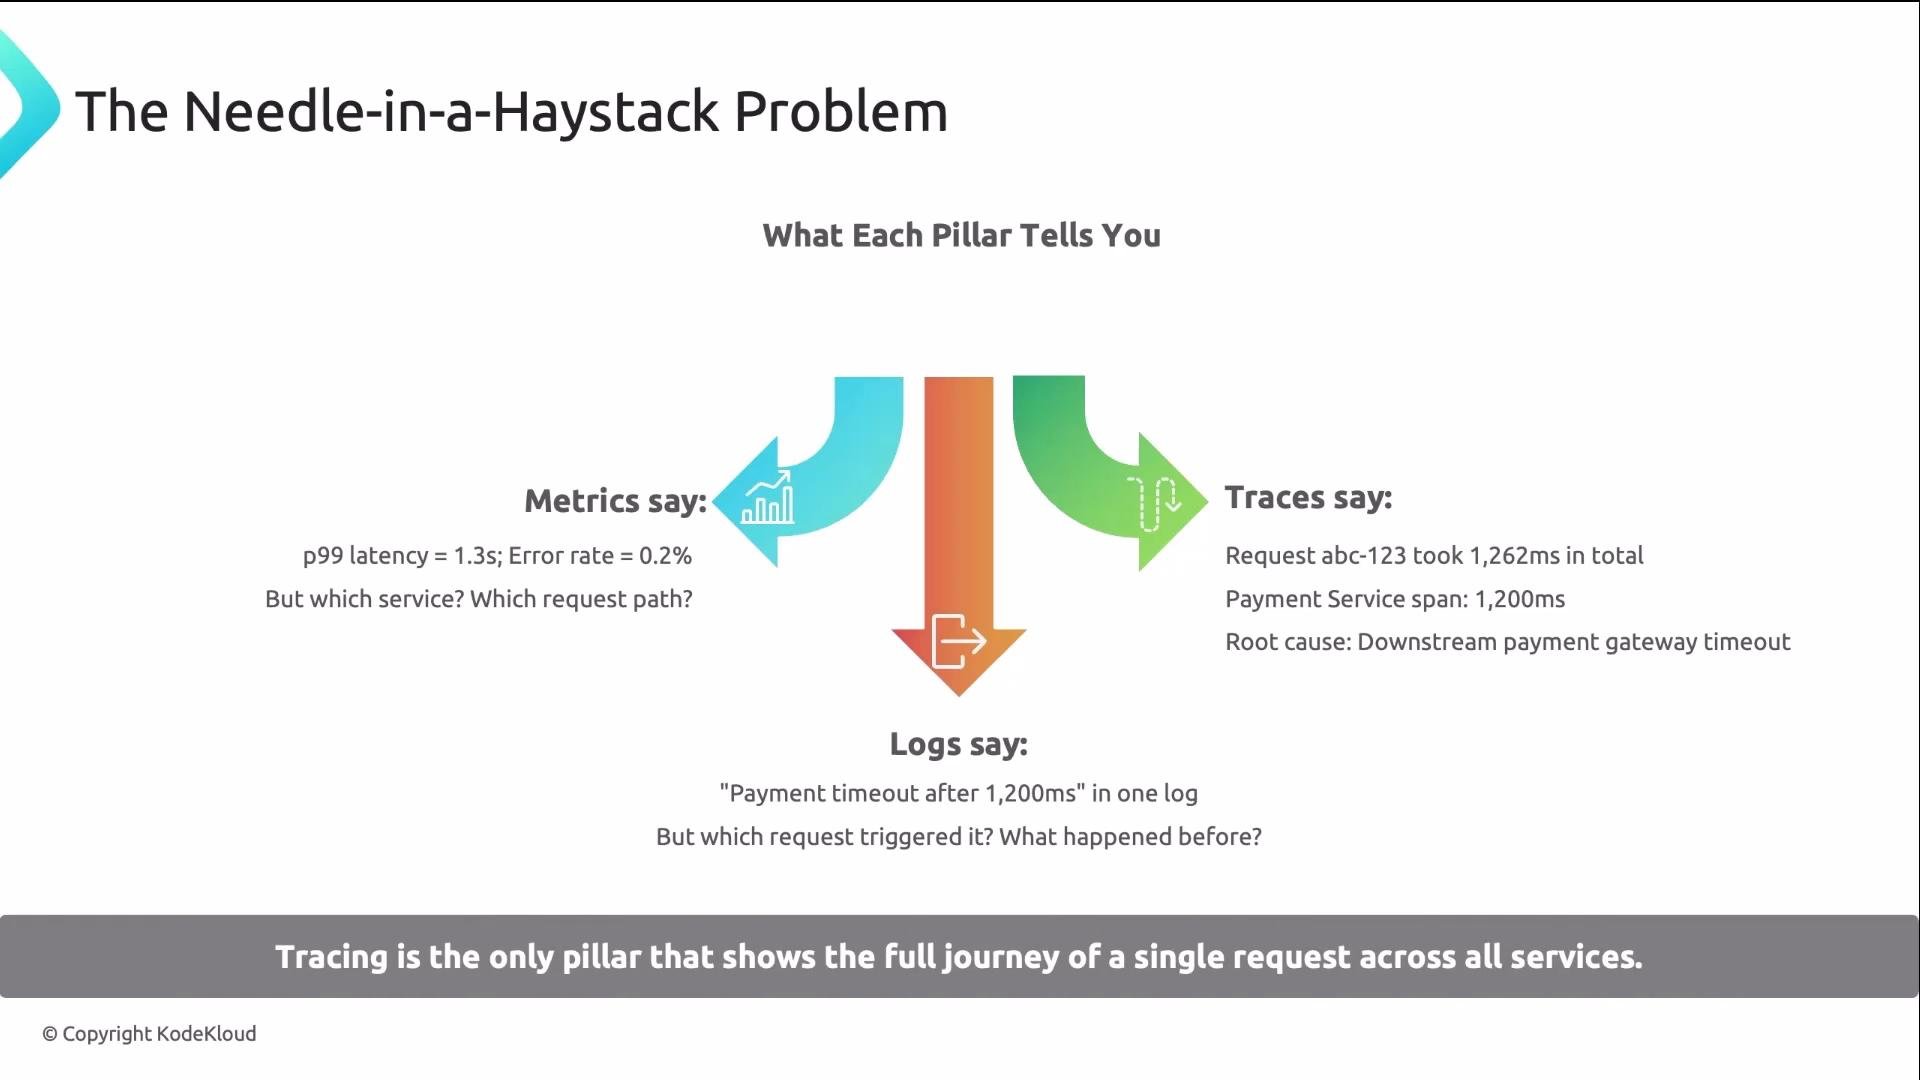
- Metrics tell you something is slow (for example, p99 latency = 1.3s).
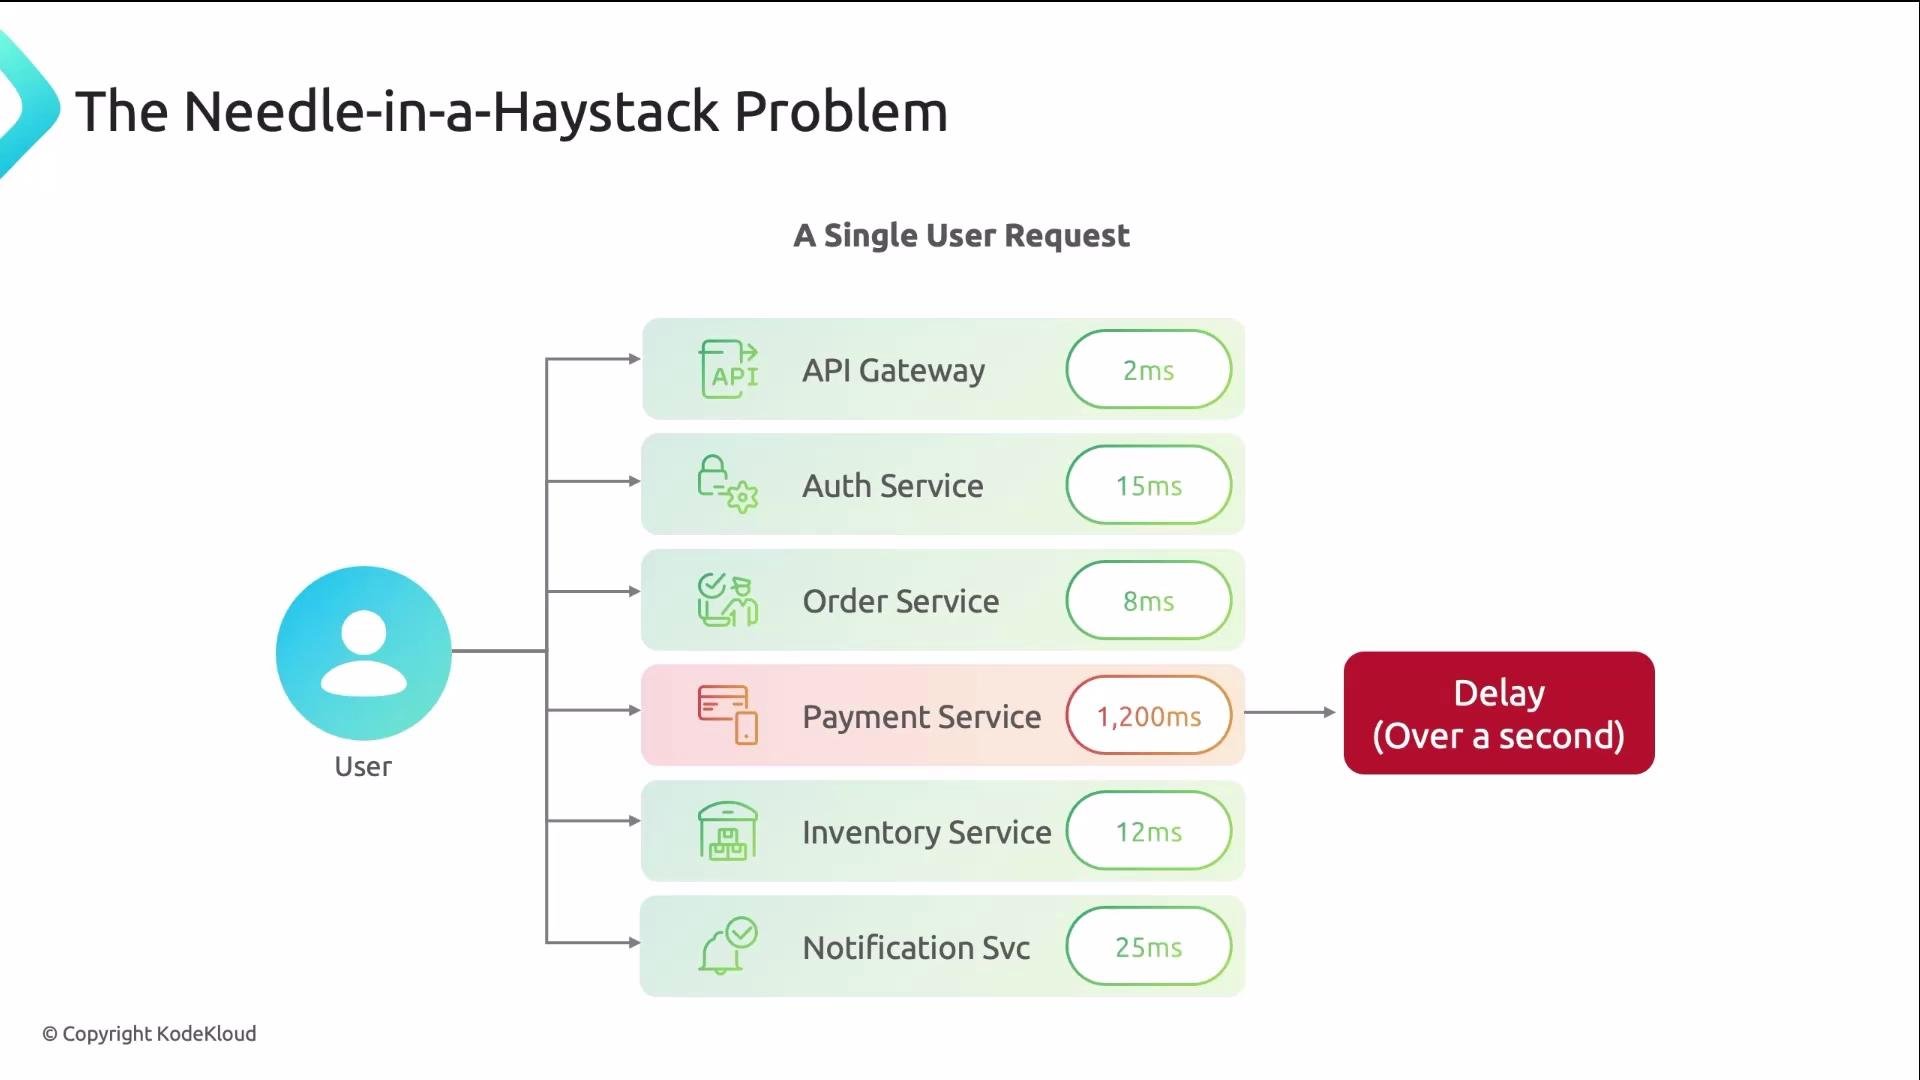
- Logs provide context for a specific service (for example, a payment timeout at 1,200ms).
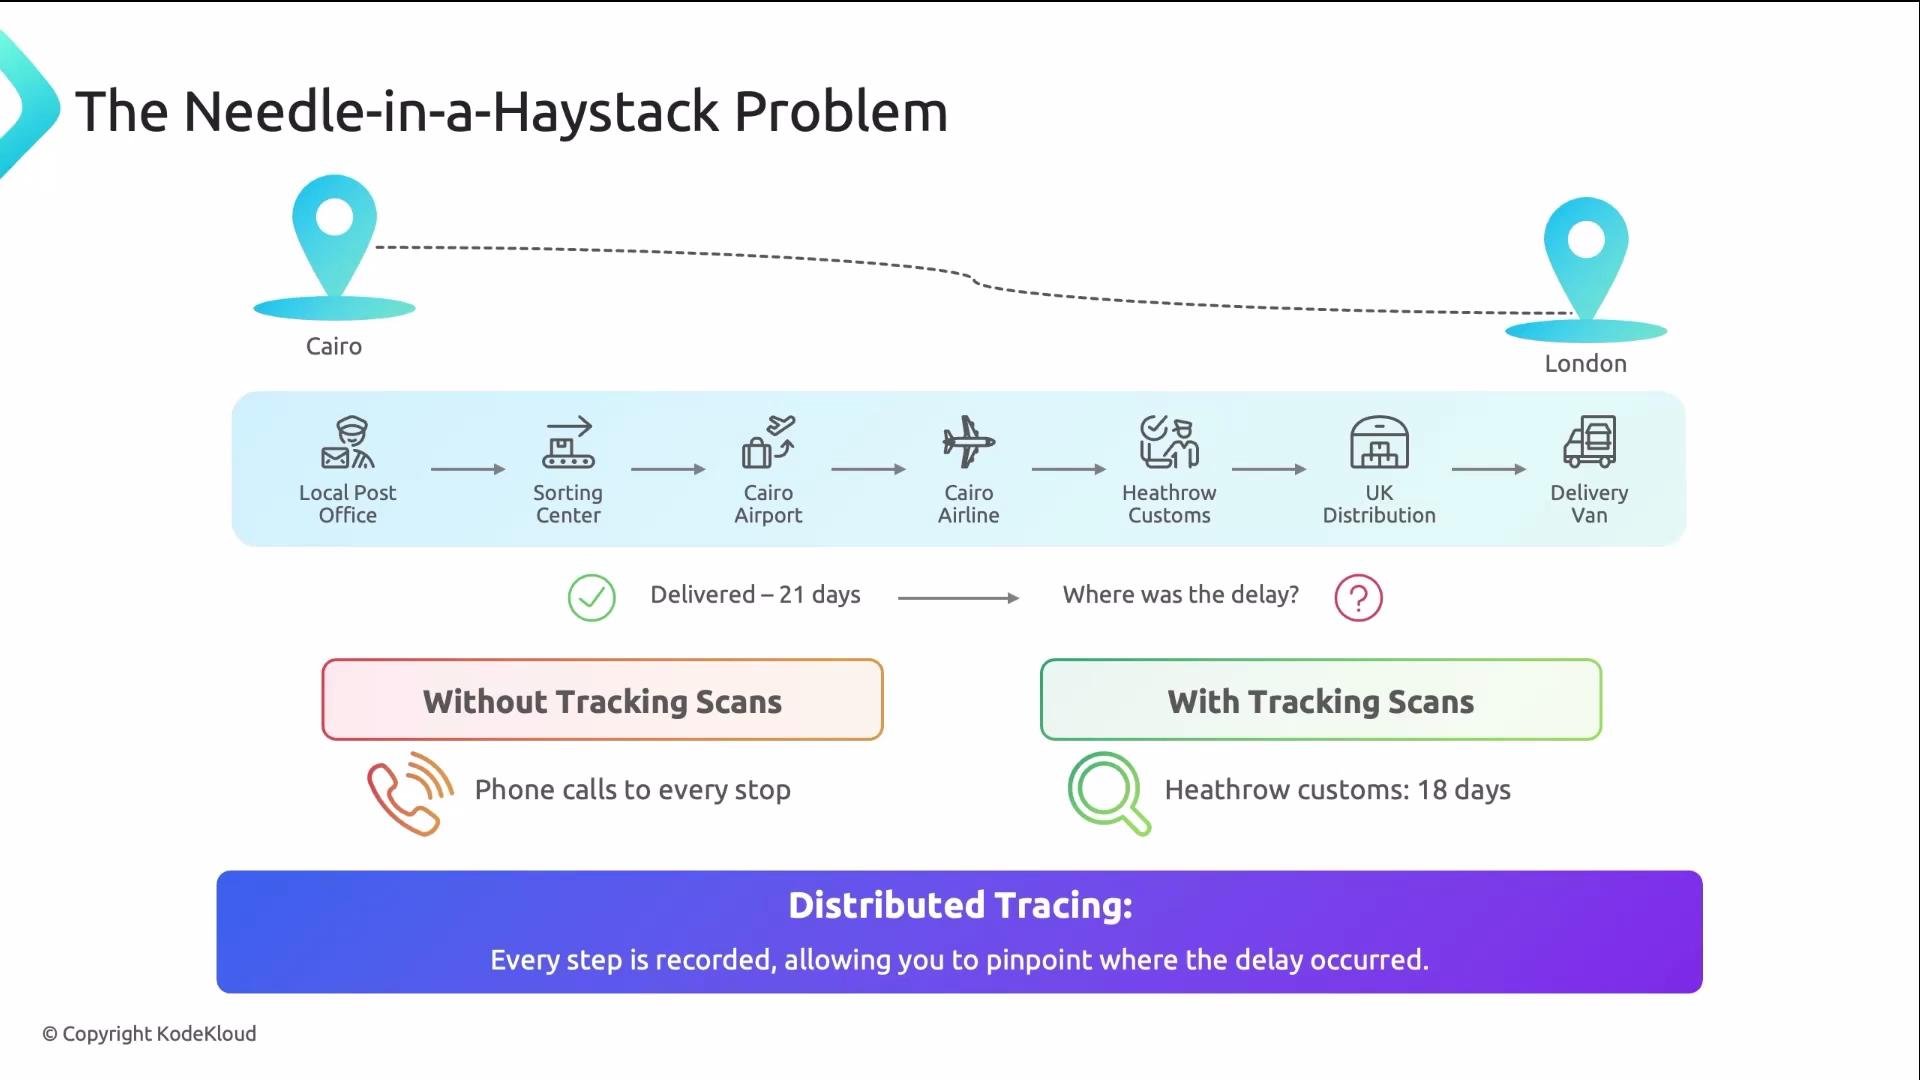
- Traces show the full, end-to-end path of a request so you can pinpoint where the bottleneck lives.
Each pillar narrows the investigation for the next: metrics detect the problem, logs add context, traces show where to focus.
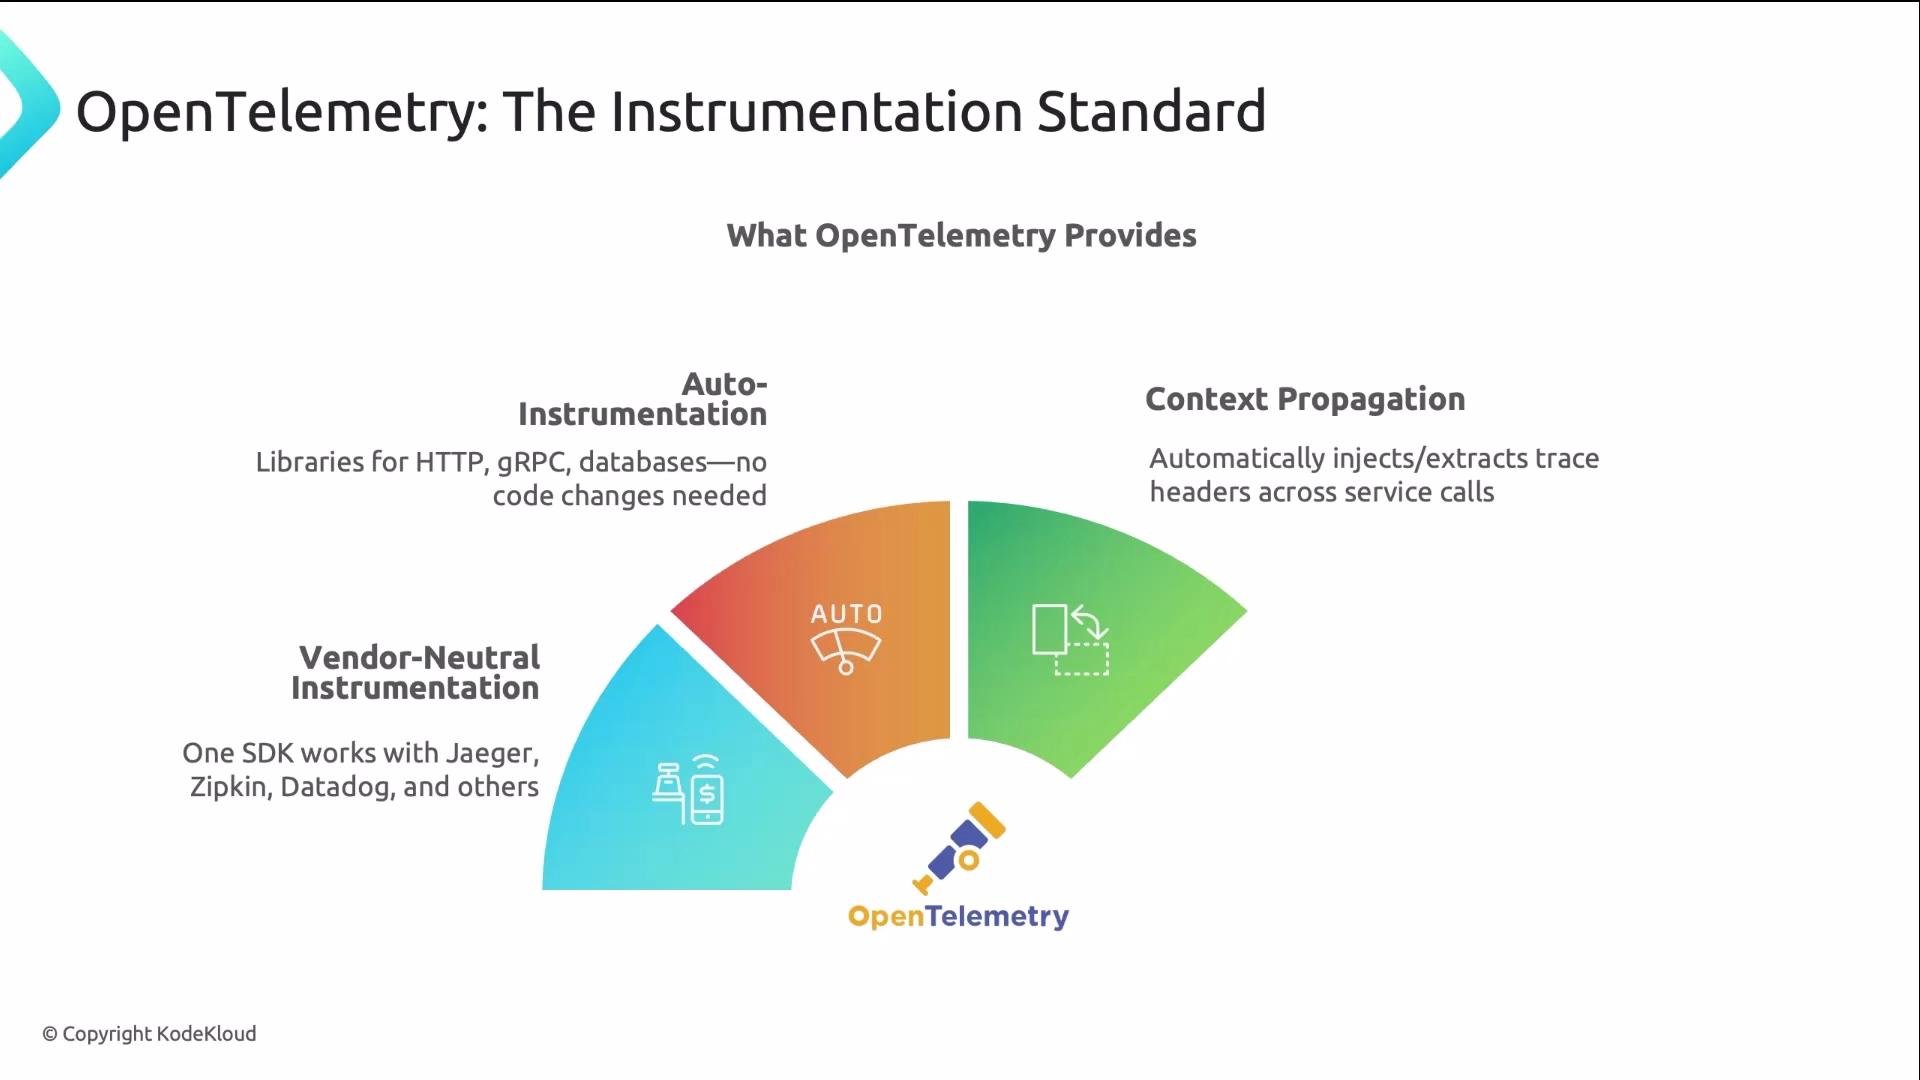
- Auto-instrumentation for HTTP, gRPC, common database clients
- Automatic injection/extraction of trace context on outgoing/incoming requests
- OTLP (OpenTelemetry Protocol) as the common export format for traces and metrics
4317; HTTP/protobuf OTLP often uses port 4318. Ensure the protocol and endpoint match your collector.
OpenTelemetry SDKs and auto-instrumentation inject and extract trace context automatically. In most cases you only need to set environment variables and enable auto-instrumentation or initialize the SDK in your app.
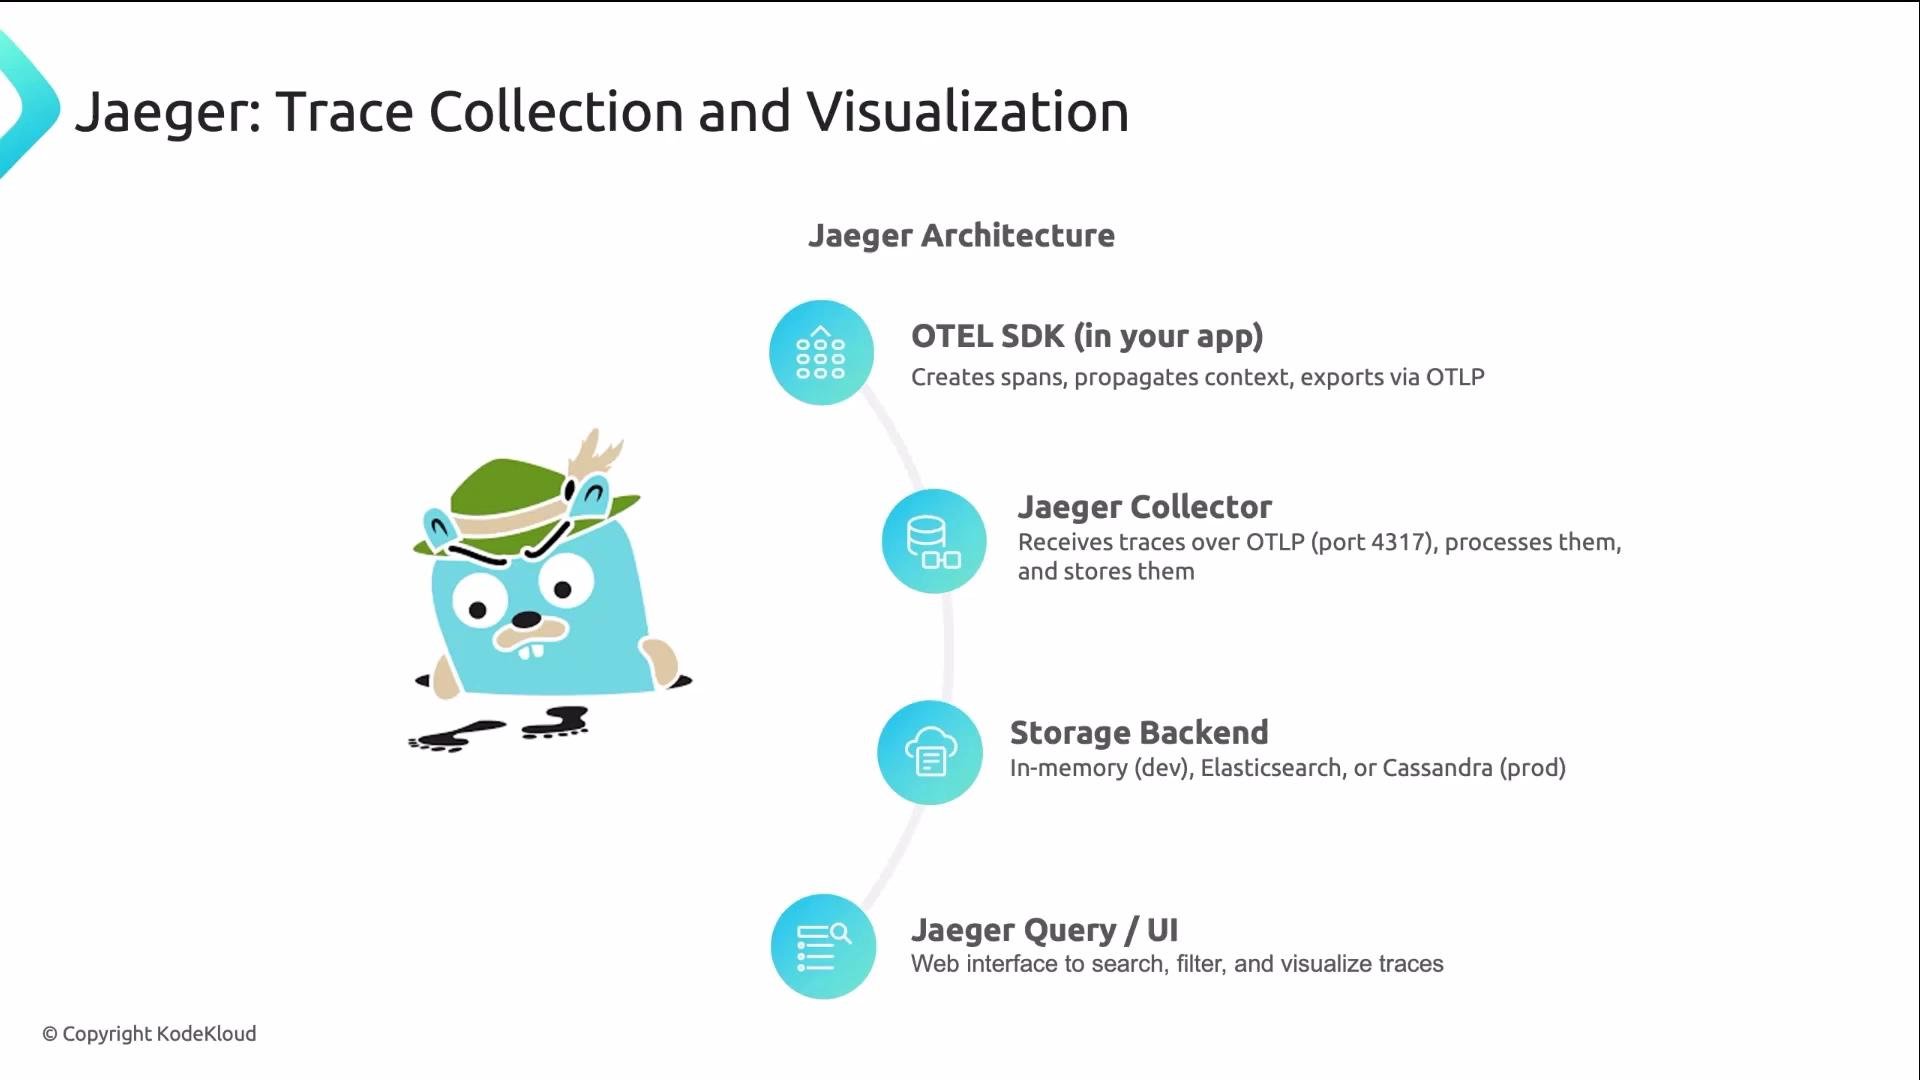
- OTEL SDK in your application exports traces to the Jaeger collector (often via OTLP).
- The collector writes traces to a storage backend (Elasticsearch, Cassandra, etc.).
- The query service reads the stored traces and powers the Jaeger UI.
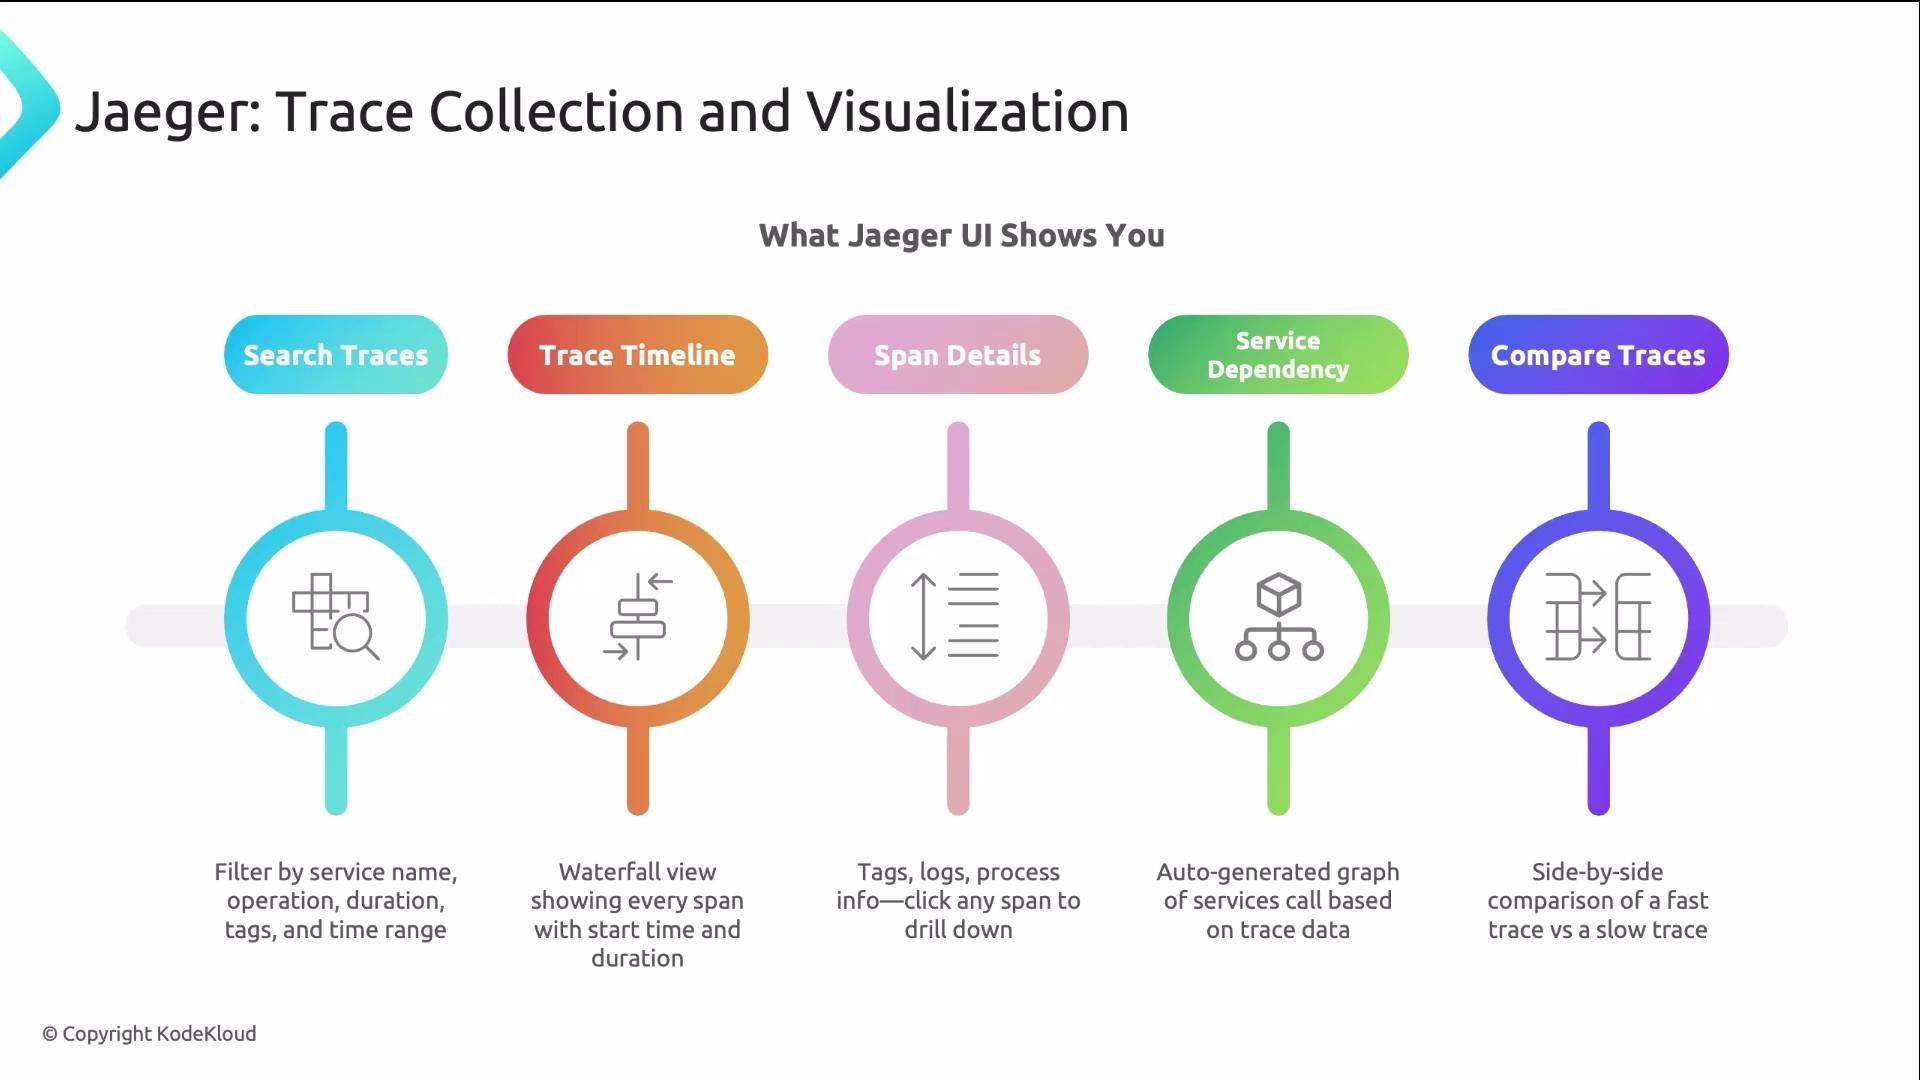
- Search traces by service name, operation, minimum duration, or tags.
- The waterfall/timeline view shows spans as horizontal bars whose widths represent duration. The widest bar is often the bottleneck.
- Click a span to view tags, logs/events, and process information.
- The service dependency graph is built from real trace data and shows call relationships between services.
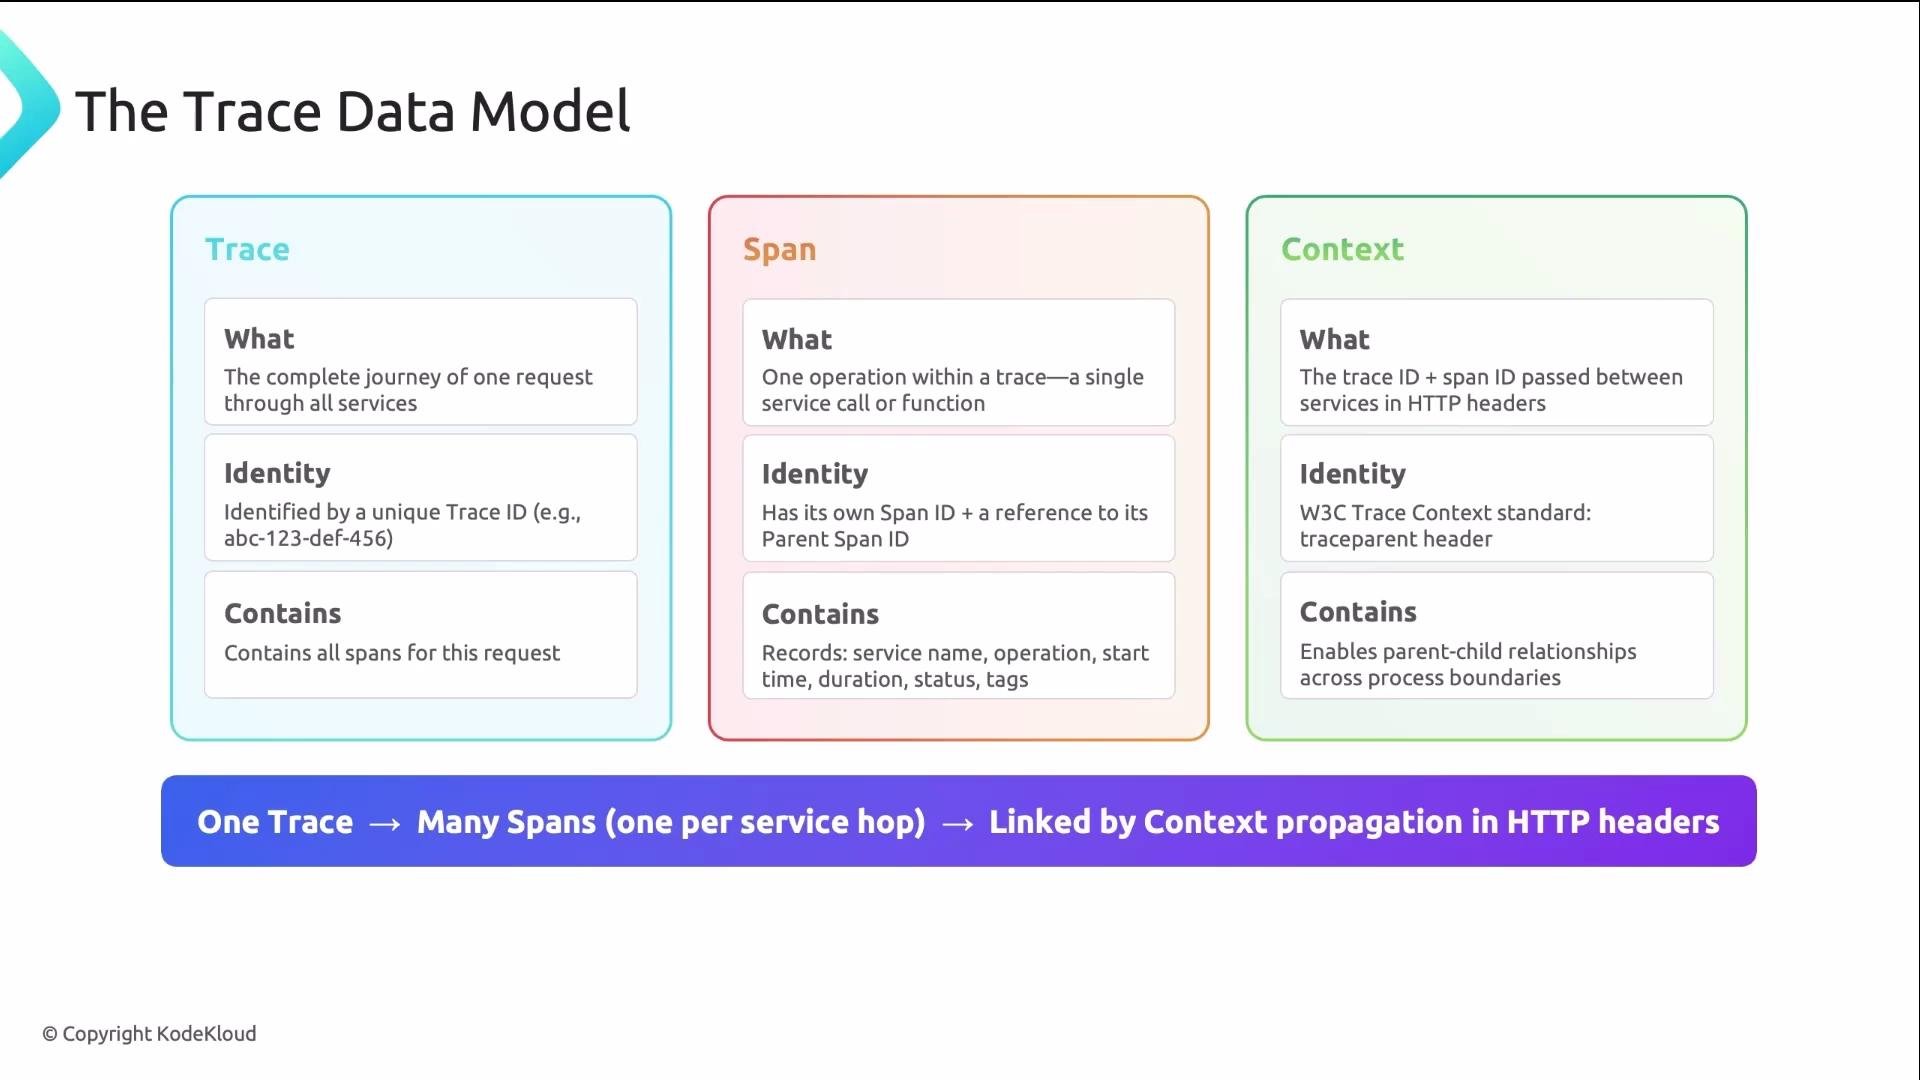
- Service A receives an incoming request and creates the root span (and a trace ID).
- When Service A calls Service B, it injects a trace context header into the outgoing HTTP request.
- Service B extracts the header, creates a child span (same trace ID, new span ID), and continues the chain when calling Service C.
- All services share the single trace ID, allowing Jaeger to reconstruct the complete end-to-end journey.
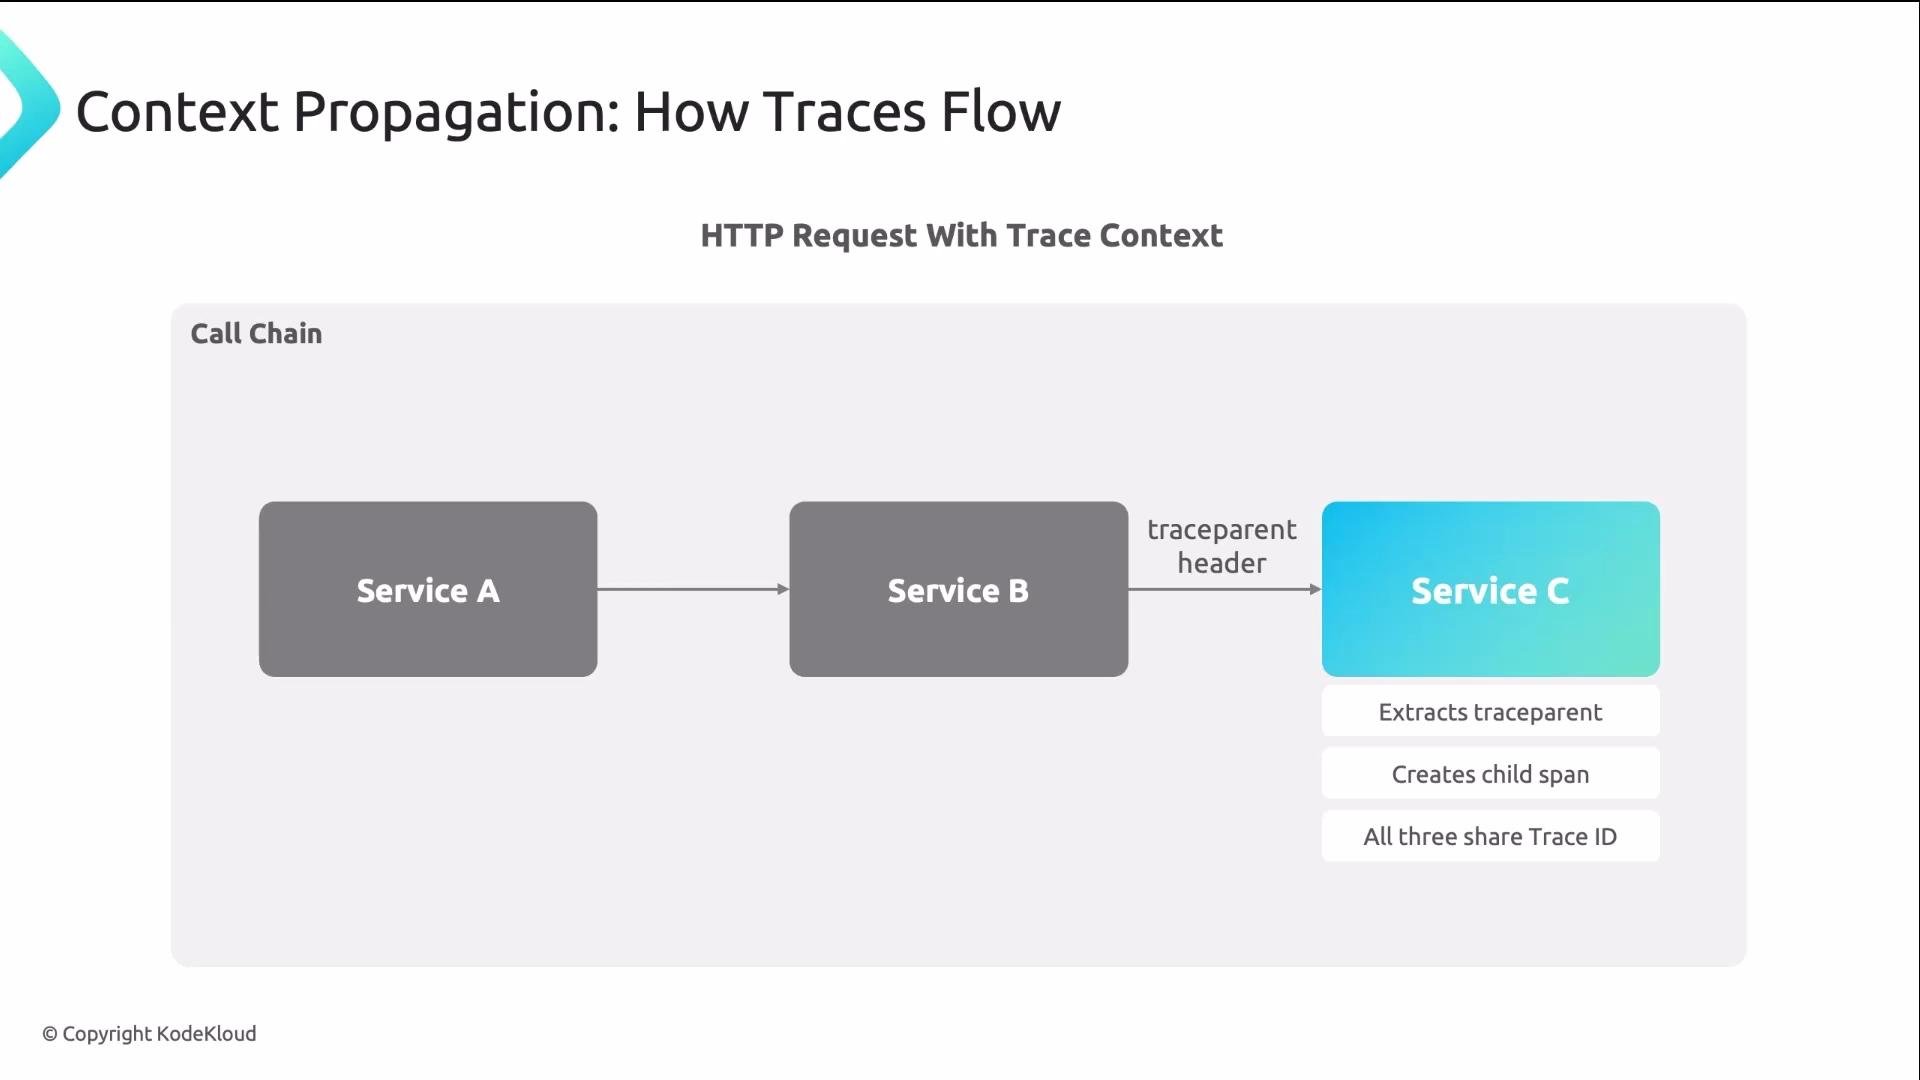
traceparent header
The W3C traceparent header is a standard way to carry trace context across process boundaries. It has four hyphen-separated fields:
- Version (currently
00) - Trace ID (32 hex characters) — identifies the entire trace
- Span ID (16 hex characters) — identifies the specific span
- Trace flags (e.g.,
01indicates the trace is sampled)
Final summary
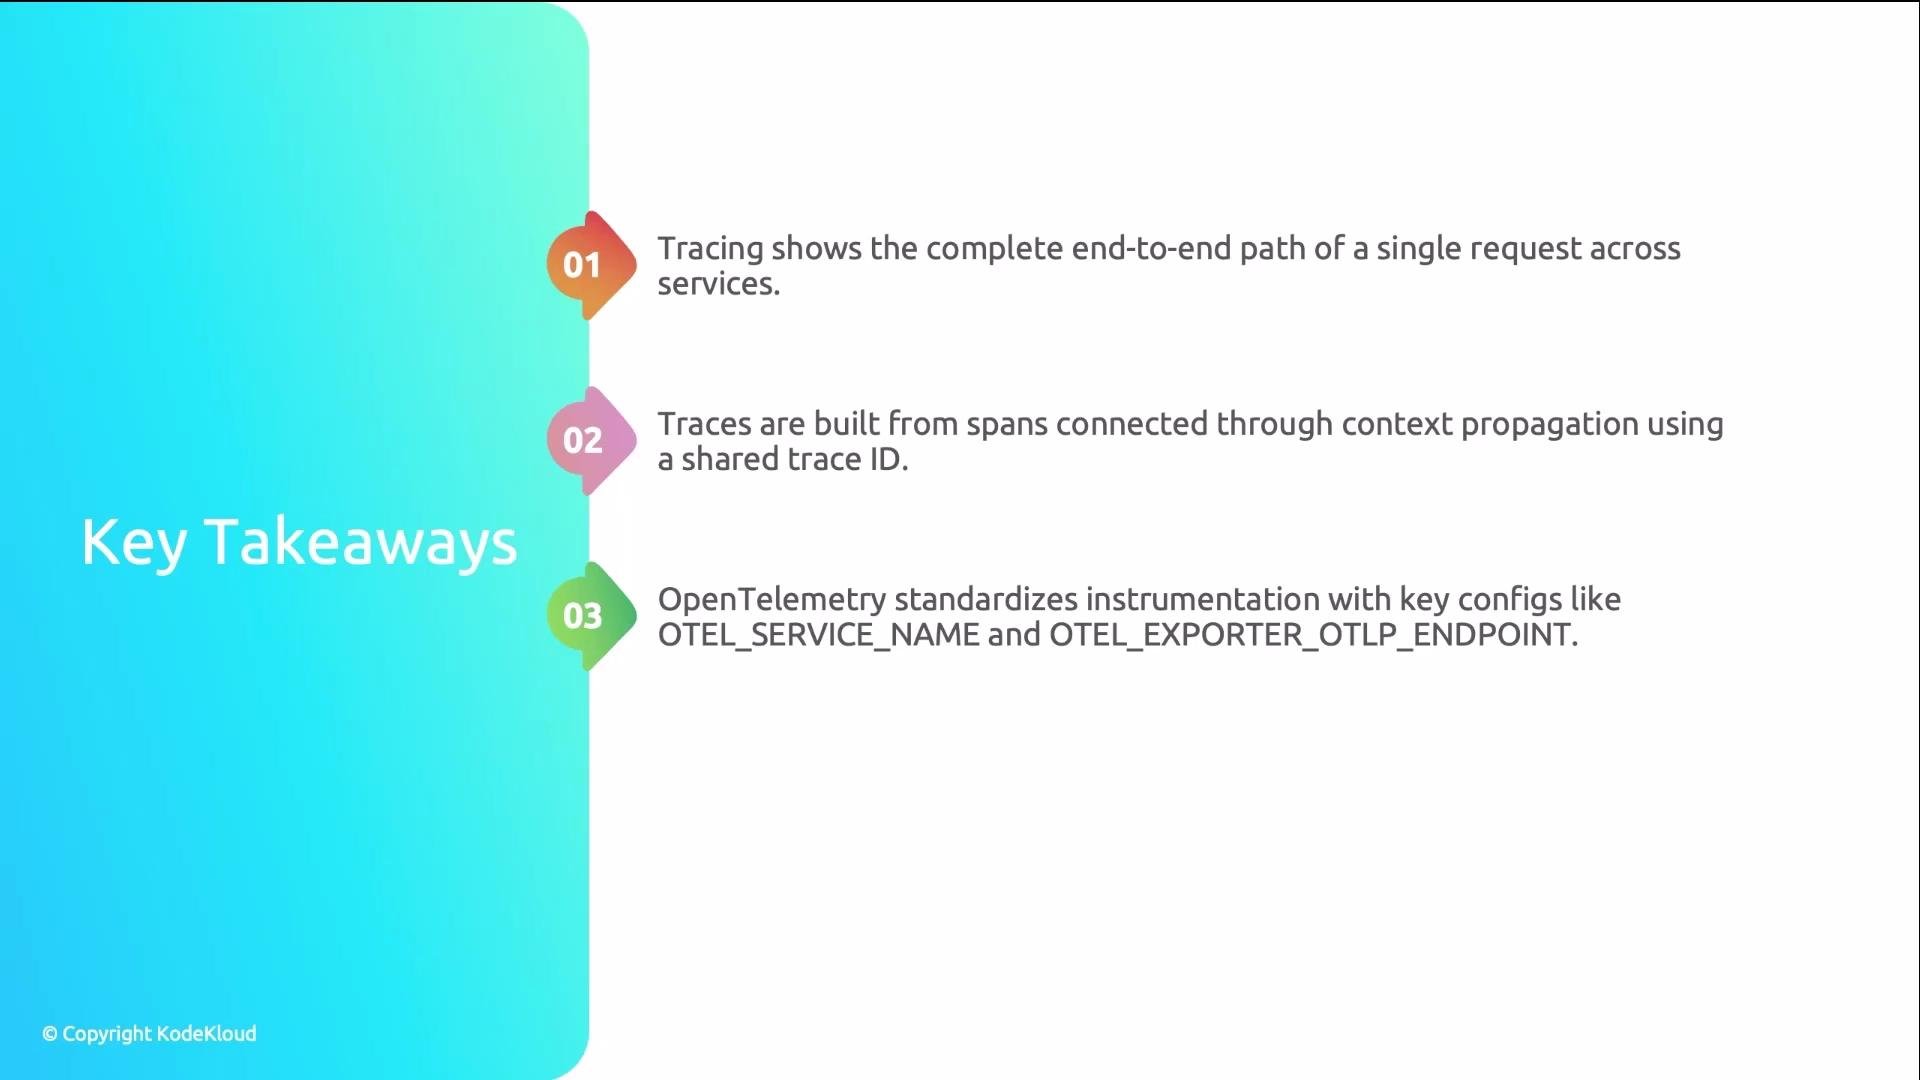
Tracing gives you end-to-end visibility that metrics and logs cannot provide alone. Traces are built from spans linked by a shared trace ID and joined together via context propagation (for example, the W3C
traceparent header). Use OpenTelemetry for standardized instrumentation and OTLP export, and use Jaeger (or another backend) to collect, store, and analyze traces.
Useful references
- OpenTelemetry: https://opentelemetry.io/
- Jaeger: https://www.jaegertracing.io/
- W3C Trace Context: https://www.w3.org/TR/trace-context/