

- A Prometheus stack is installed in the
monitoringnamespace (kube-prometheus-stack or similar). - Grafana is running and reachable (exposed via NodePort in this environment).
kubectlconfigured to access the cluster.
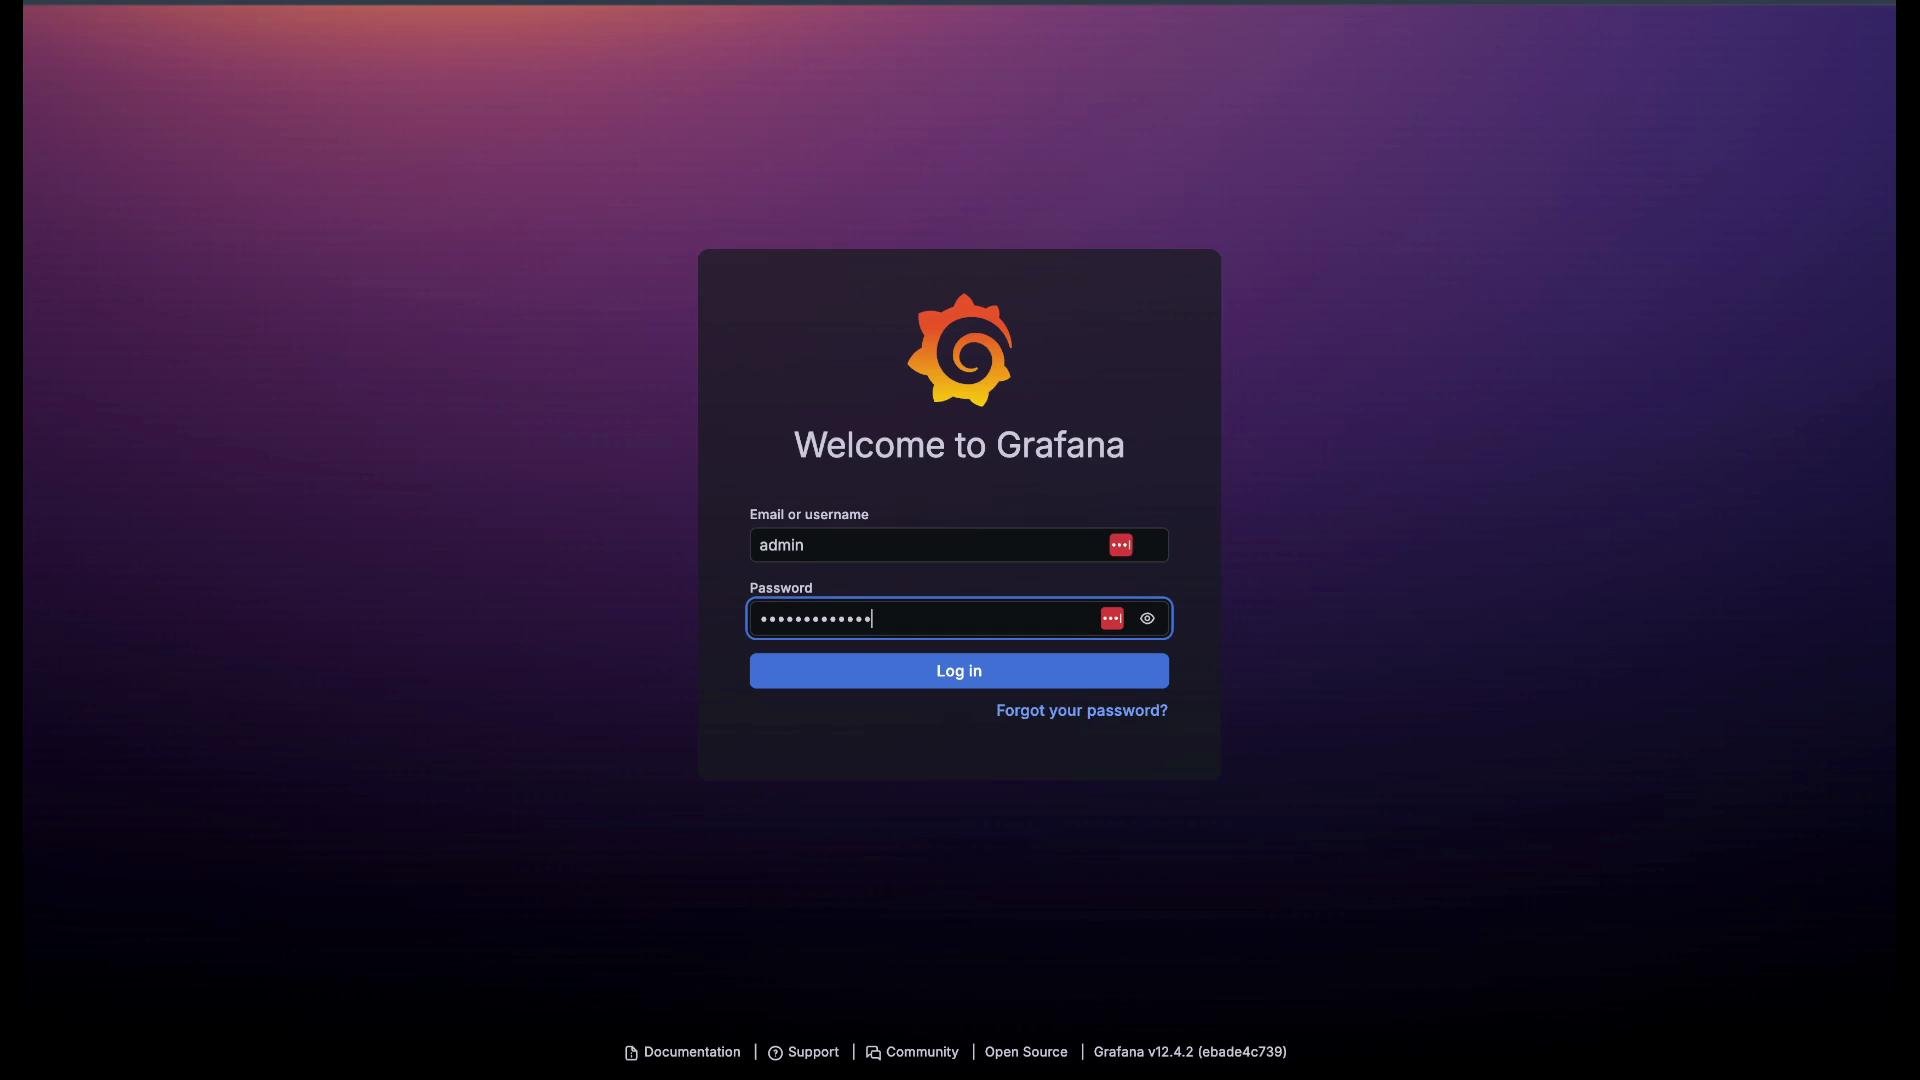
Open Grafana and log in
Use the Grafana NodePort (or your configured ingress) to reach the Grafana UI and sign in with the credentials for your setup.
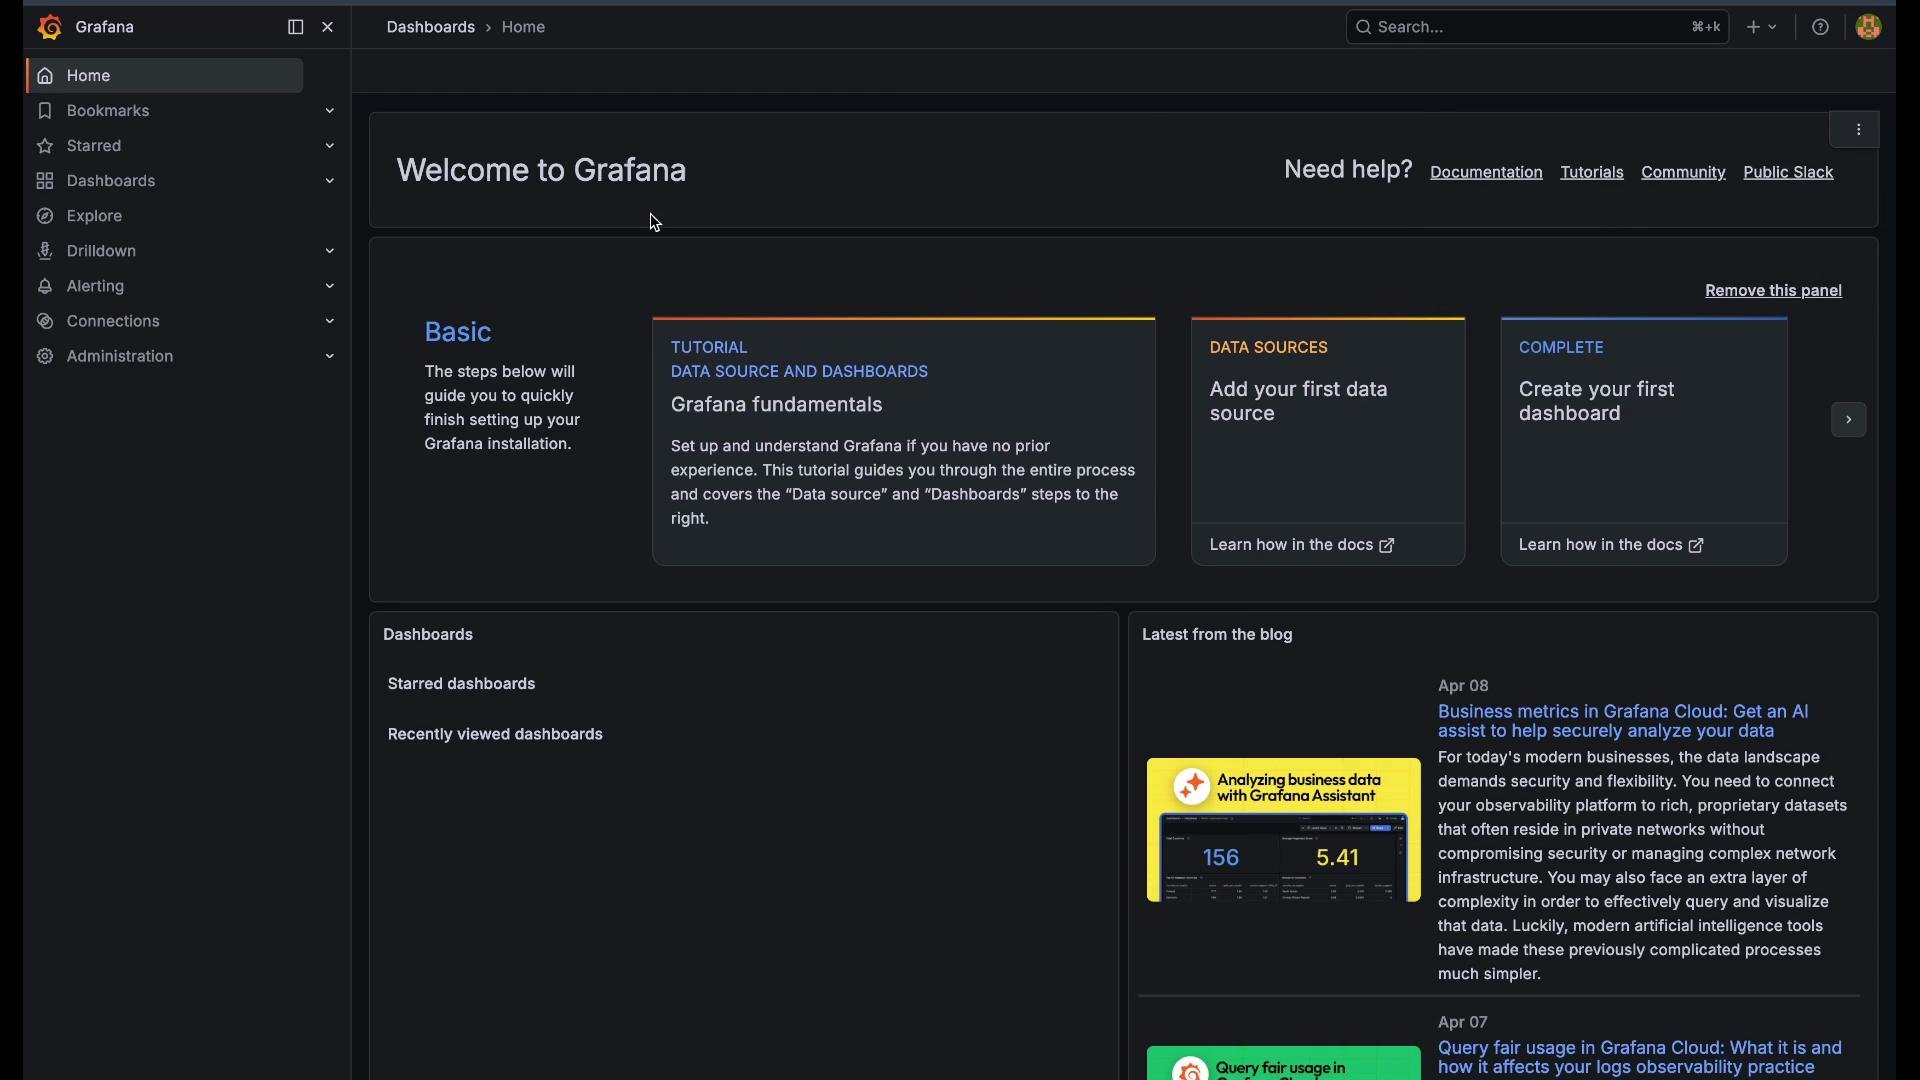
- Click Add your first data source (or Add data source).
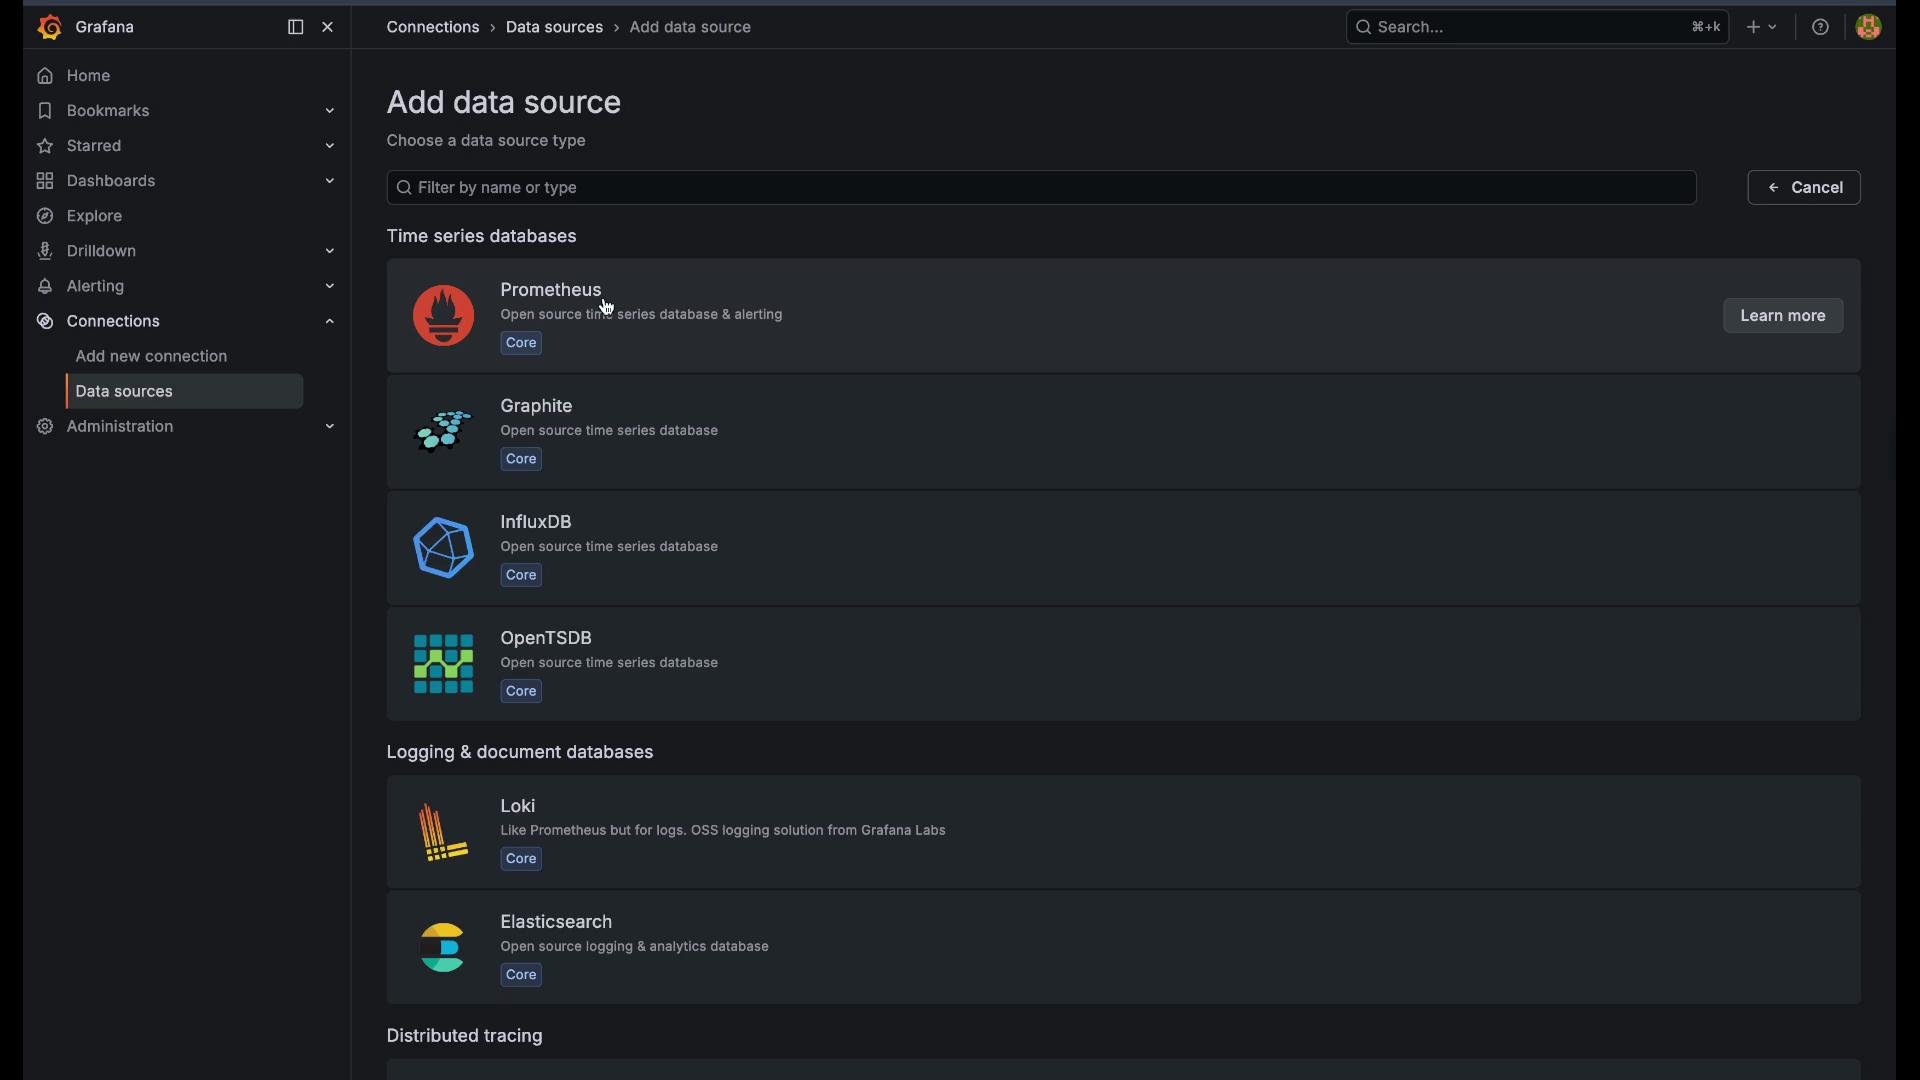
- From the list, choose Prometheus.
- Keep the default Name (or give it a descriptive name such as
prometheus-monitoring). - For the URL, point Grafana to the in-cluster Prometheus service. Use the full service DNS name and port (including scheme):
service-name.namespace.svc.cluster.local:port
It will work regardless of the namespace where Grafana runs, provided DNS resolves and any network policies allow access.
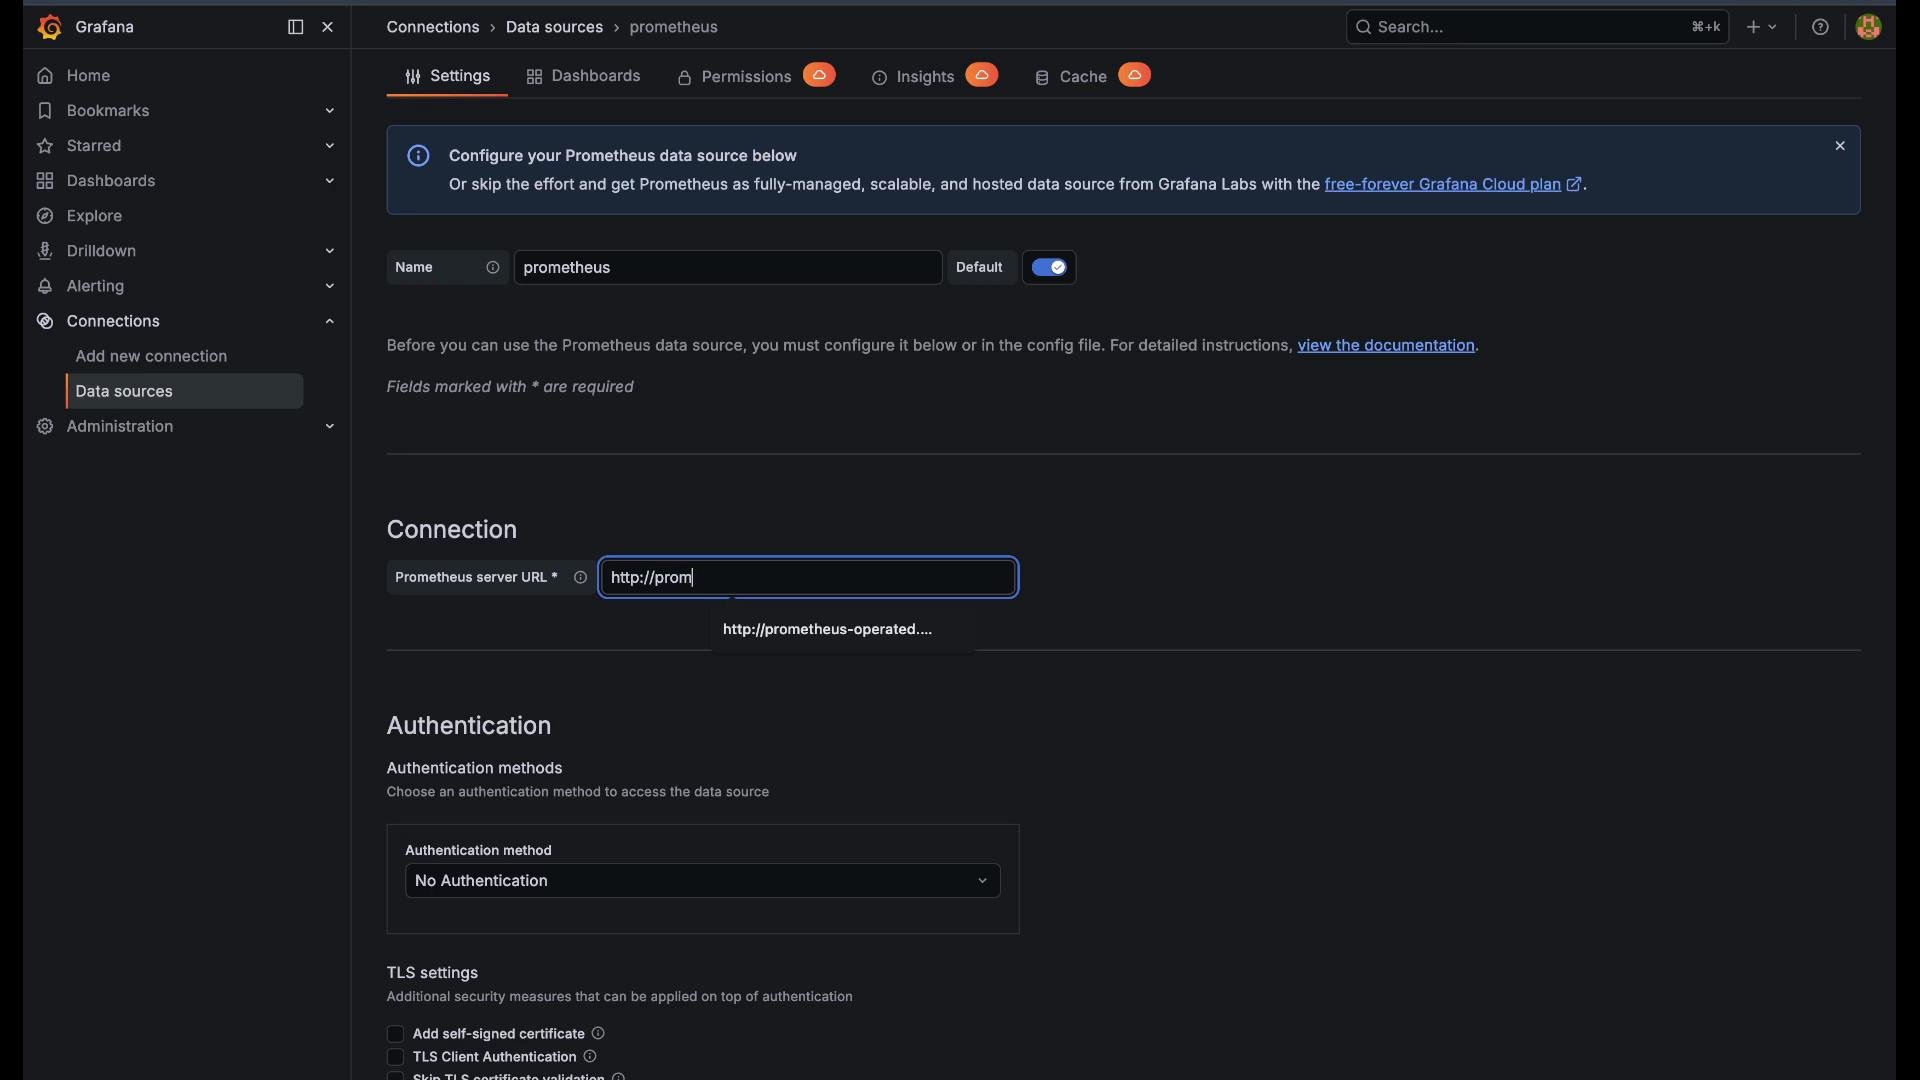
- Toggle “Default” if you want this Prometheus instance to be the default for new dashboards.
- Leave authentication, timeouts, and other advanced settings at their defaults unless you require custom configuration (e.g., TLS, headers, or proxy).
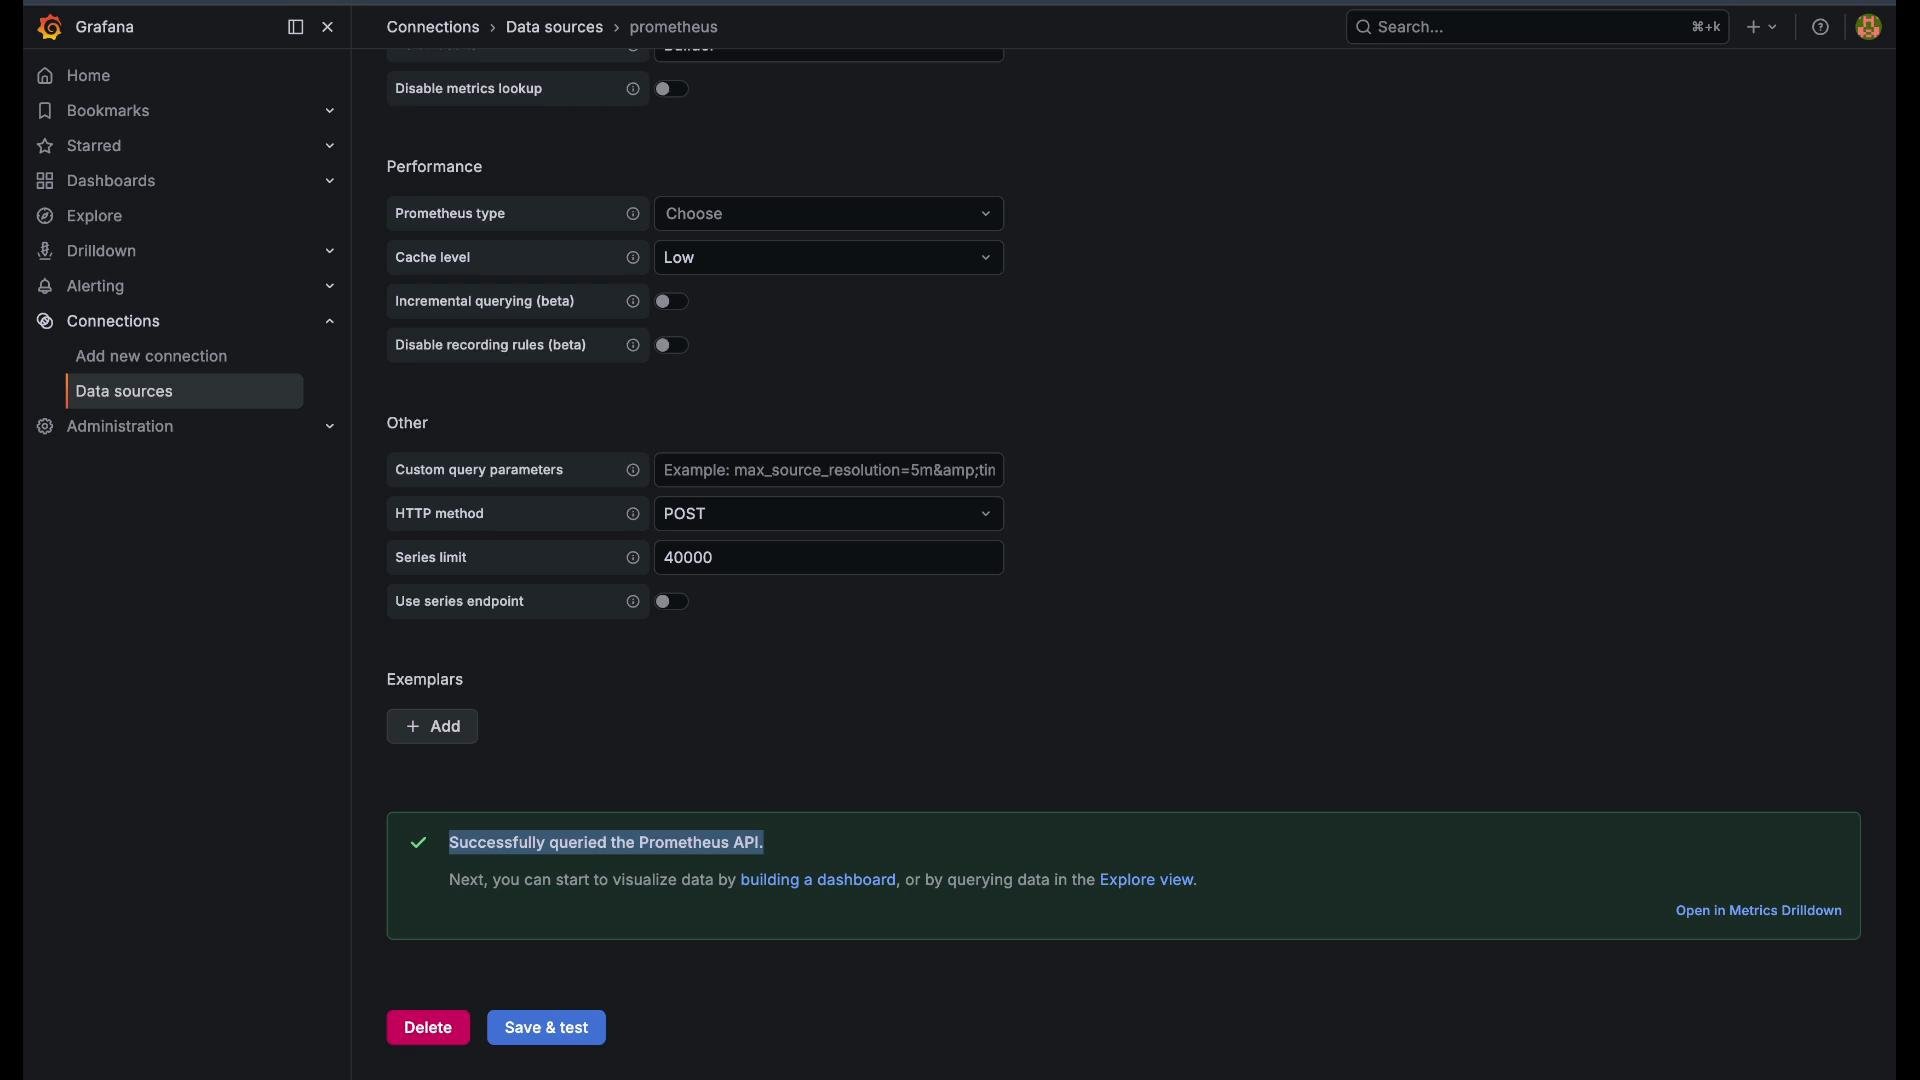
If Save & Test fails, verify the following:
- The service DNS and port are correct:
http://prometheus-operated.monitoring.svc.cluster.local:9090. - Prometheus pods are running in the
monitoringnamespace:kubectl get pods -n monitoring. - NetworkPolicies, firewall rules, or cluster network ACLs are not preventing in-cluster requests from Grafana to Prometheus.
- Create dashboards and panels that query Prometheus using PromQL.
- Import prebuilt Grafana dashboards for Kubernetes or your applications.
- Secure access to Grafana (authentication, RBAC, and TLS) before exposing it externally.
- Grafana documentation: https://grafana.com/docs/
- Prometheus documentation: https://prometheus.io/docs/
- Kubernetes DNS and Services: https://kubernetes.io/docs/concepts/services-networking/dns-pod-service/