

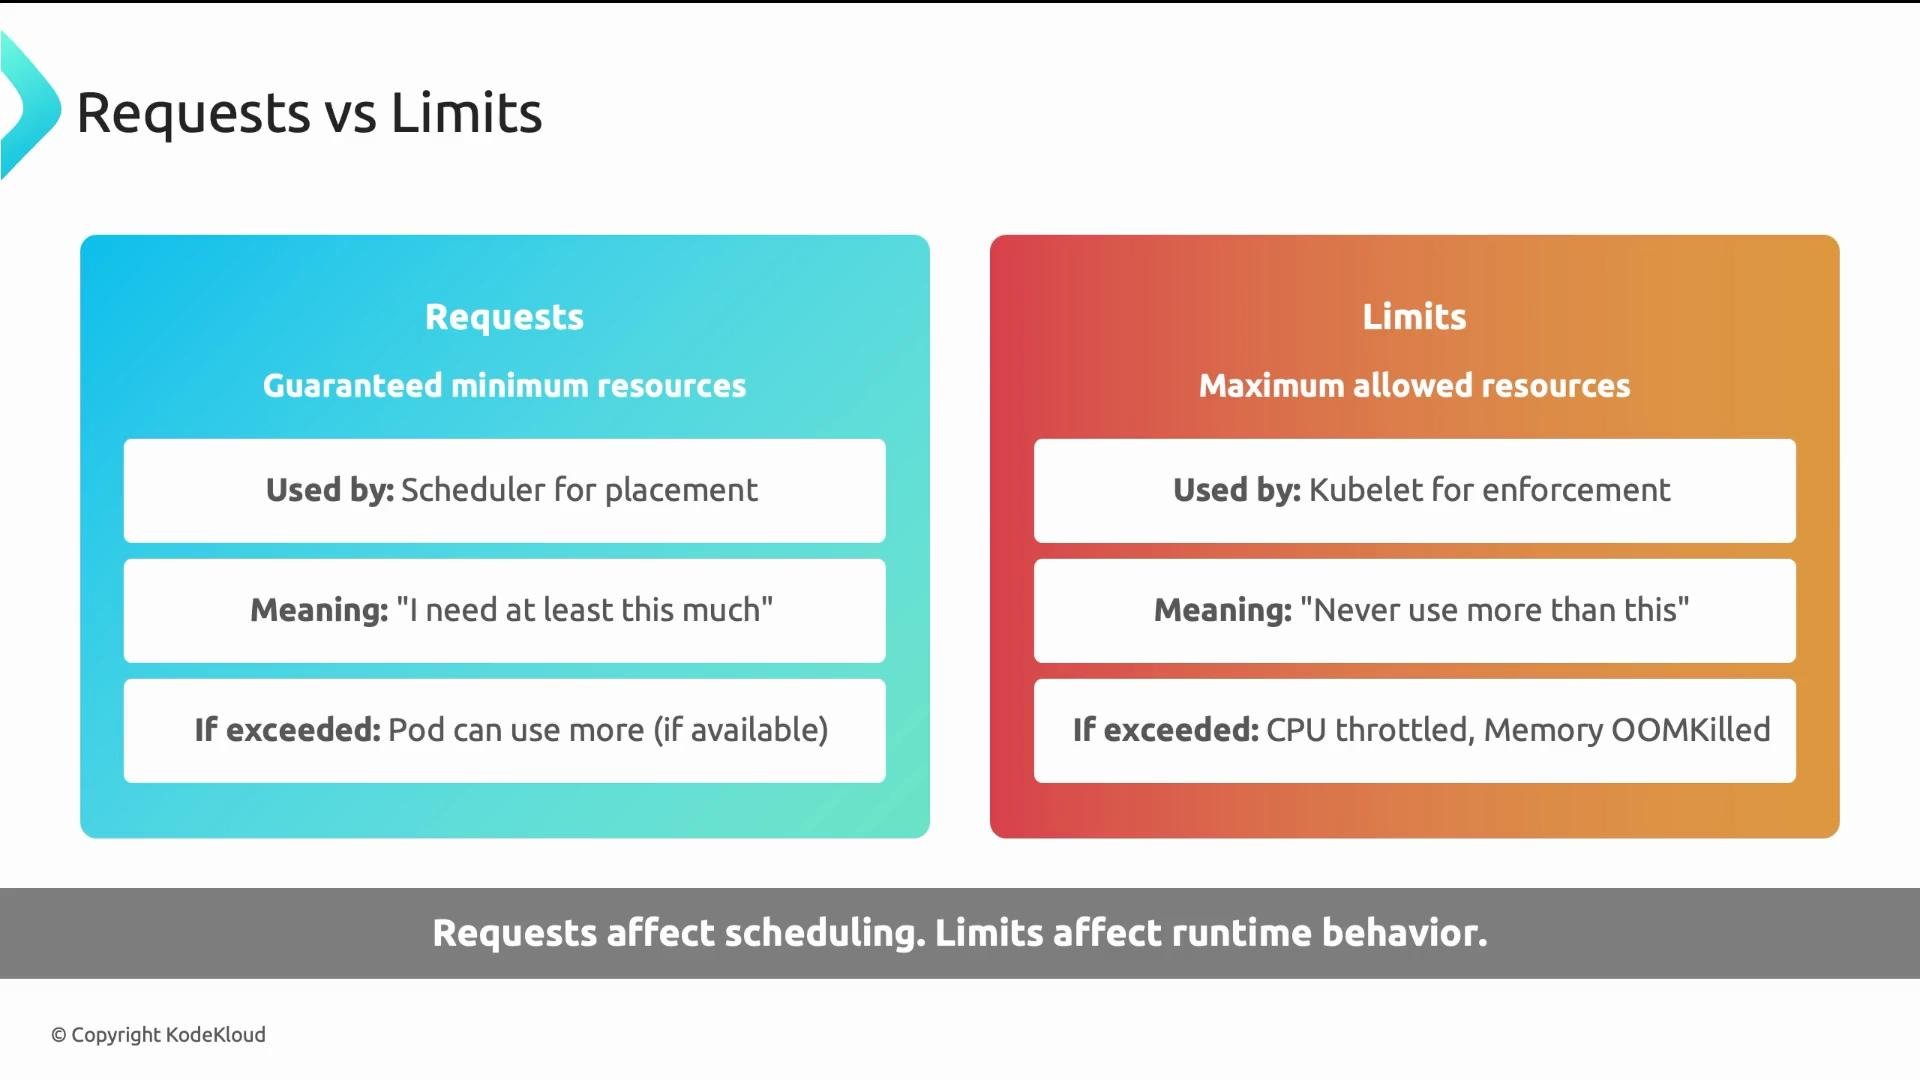
- Requests: the guaranteed minimum resources a Pod needs. The scheduler uses requests to decide where to place a Pod. For example, if a Pod requests
1CPU and256Mimemory, the scheduler will only place it on a node that reports at least those allocatable resources available. - Limits: the maximum resources a Pod is allowed to consume at runtime. Limits are enforced by the kubelet via cgroups. Exceeding a CPU limit causes kernel-level throttling; exceeding a memory limit can cause the container to be terminated (OOMKilled).
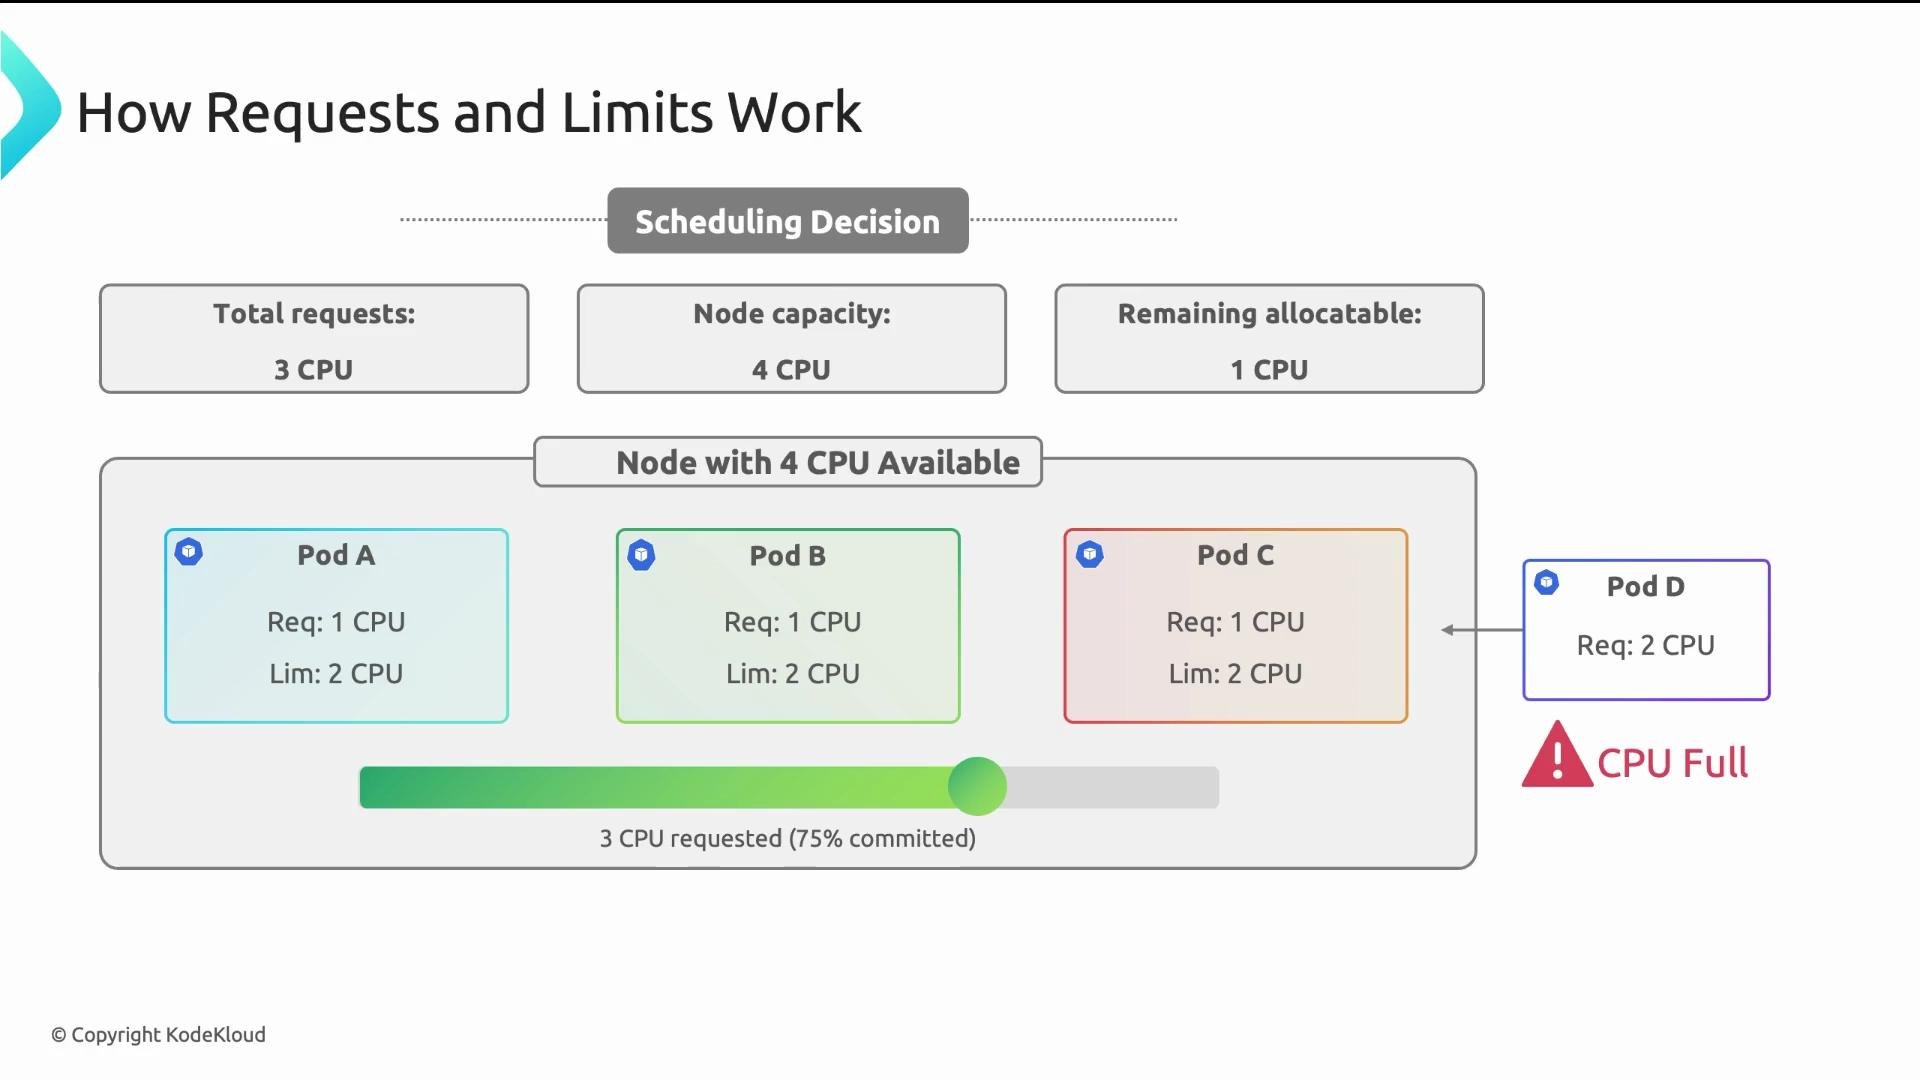
- Node capacity: 4 CPUs available.
- Three Pods arrive. Each Pod requests
1CPU and sets a limit of2CPUs.- Scheduler sums requests:
1 + 1 + 1 = 3CPUs requested. - Node has
4CPUs allocatable, so all three Pods are admitted.1CPU remains allocatable.
- Scheduler sums requests:
- If a fourth Pod requests
2CPUs, the scheduler will NOT schedule it because only1CPU remains allocatable.
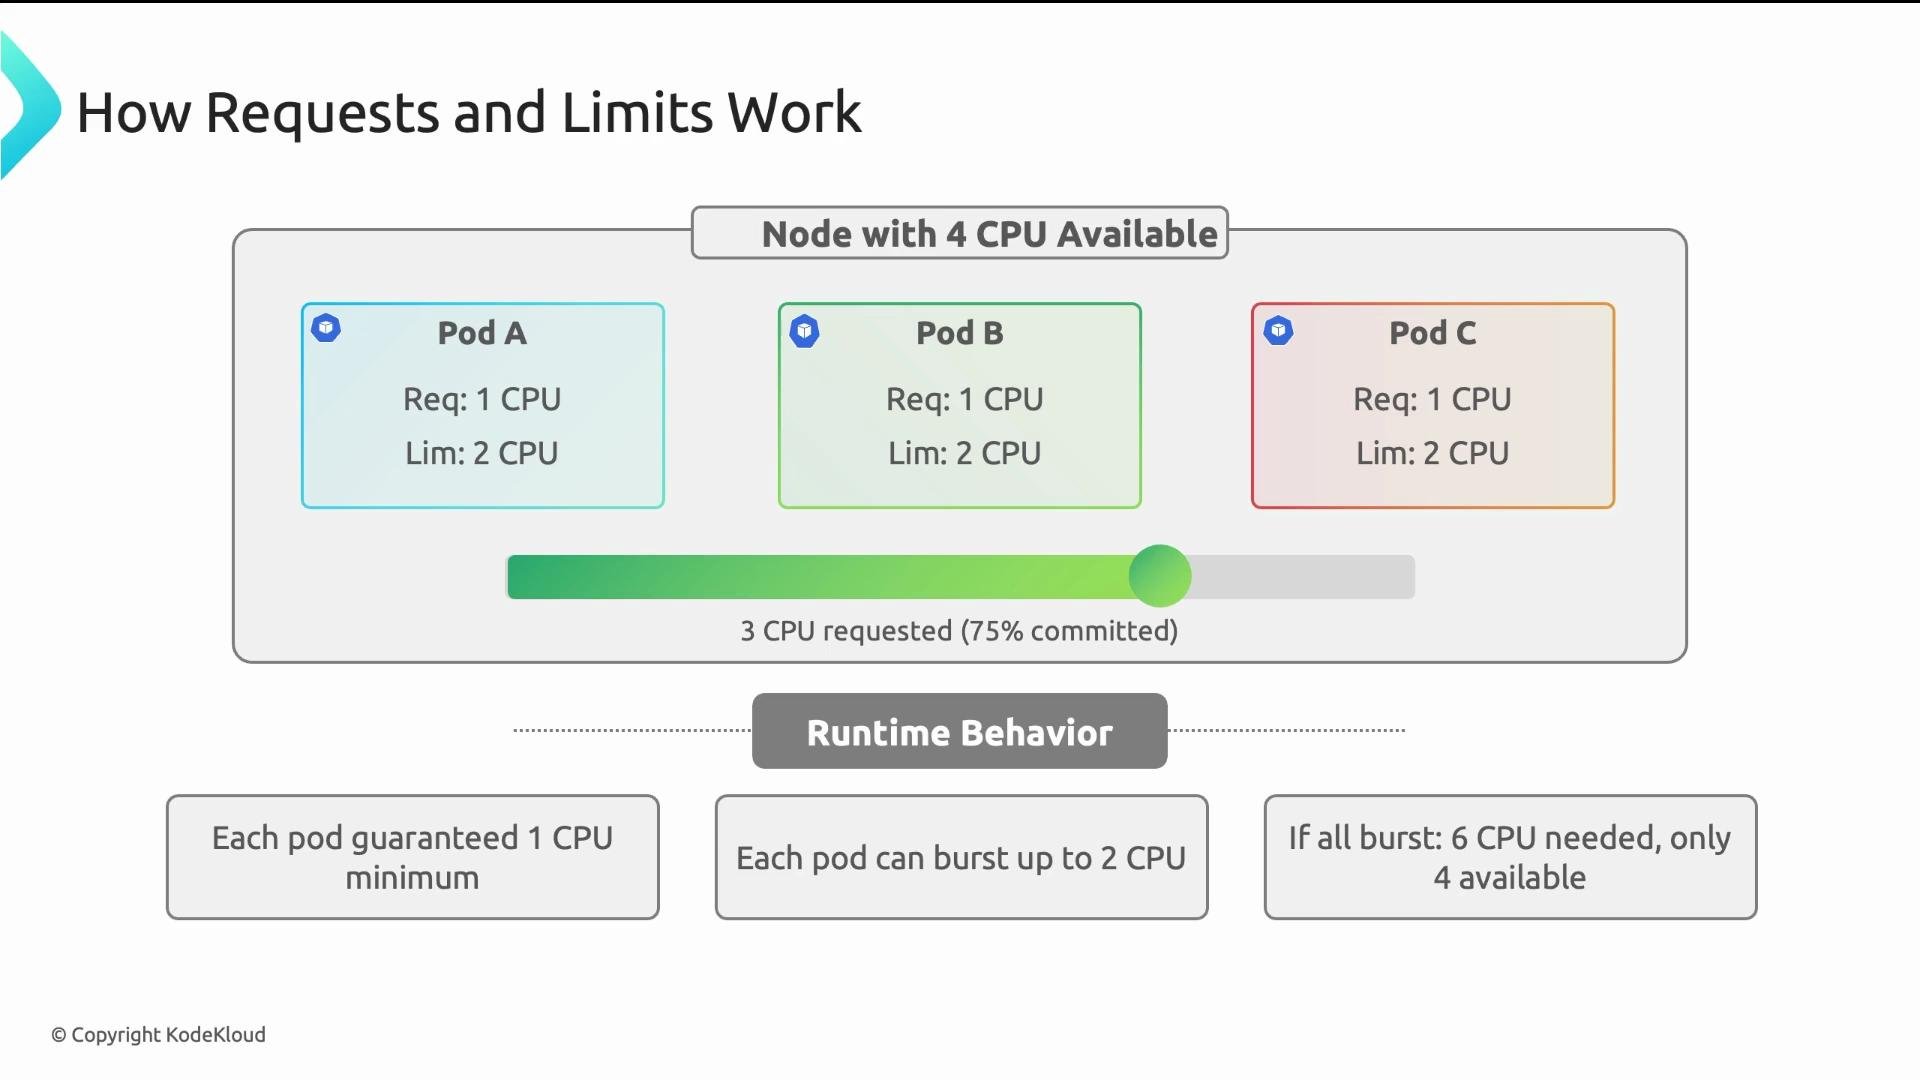
- In the example above, each Pod is guaranteed
1CPU (its request) but allowed to burst up to2CPUs (its limit). - If all three Pods simultaneously try to use their full limits, they would collectively want
6CPUs while the node only has4. The kernel enforces CPU fairness using cgroups and the Completely Fair Scheduler (CFS), so CPU-bound containers will be throttled and see degraded throughput/latency.
- Hitting a CPU limit results in throttling — your application will run slower but is generally not terminated.
- Hitting a memory limit typically results in an immediate OOM kill — the container process can be terminated abruptly.
Memory limit breaches are often fatal for a Pod. Always set memory limits intentionally and monitor OOMKilled events — they can indicate that requests were underestimated or the workload requires more memory headroom.
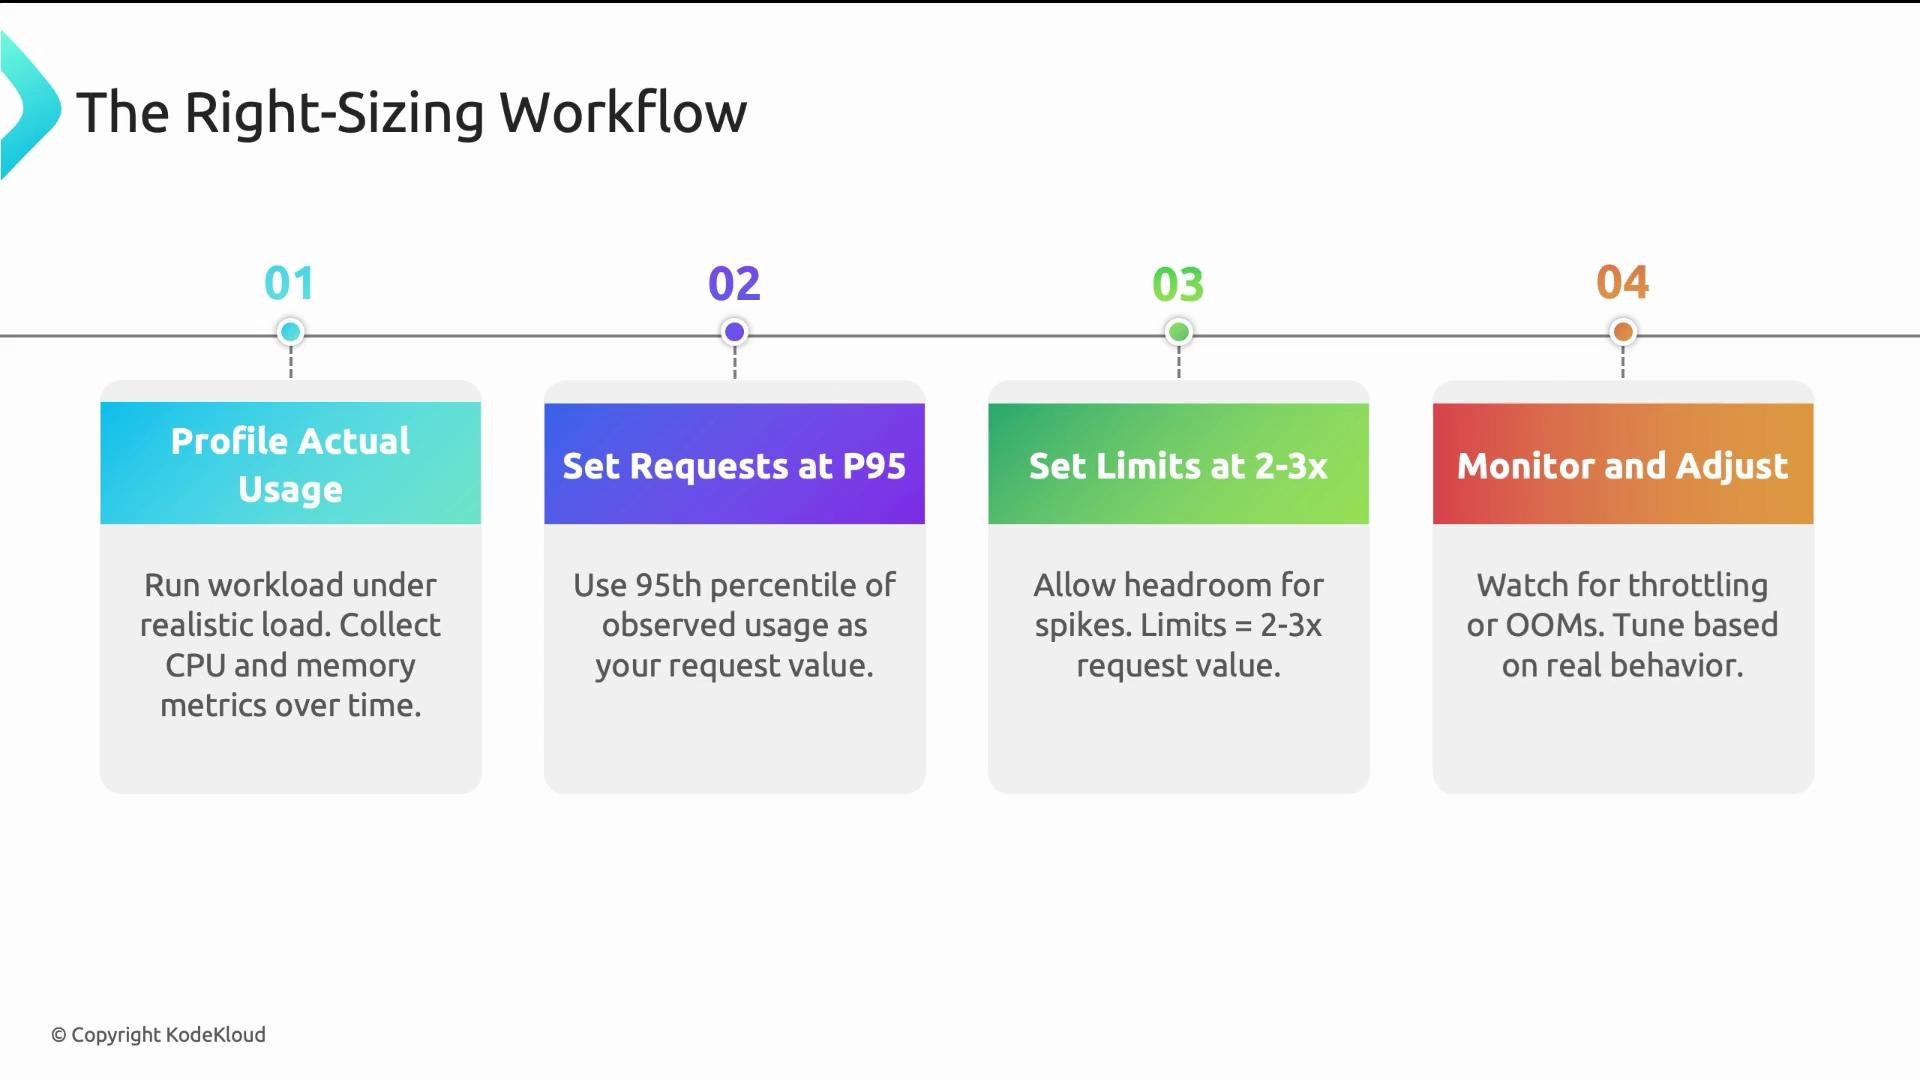
- Profile actual usage
- Run workloads under a realistic, representative load window (for example, 1 week) and collect CPU and memory metrics.
- Tools: Prometheus,
kubectl top, Grafana, or other cluster monitoring solutions.
- Choose requests from observed usage
- A common approach is to set the request to the 95th percentile of observed usage for the profiling window. This captures normal spikes while avoiding over-provisioning.
- Set reasonable limits
- Set limits higher than requests to allow bursts. Common guidelines:
limits = 2–3× requestsfor many workloads. - Some teams choose not to set CPU limits for latency-sensitive services but still set memory limits (memory limits should almost always be enforced).
- Set limits higher than requests to allow bursts. Common guidelines:
- Monitor and iterate
- Watch CPU throttling metrics and OOMKilled events; validate that latency and throughput remain acceptable.
- Use automation where possible — the Vertical Pod Autoscaler (VPA) can recommend request values based on observed in-cluster usage.
Four practical takeaways:
- Requests drive scheduling; limits enforce runtime. Confusing them risks outages or wasted nodes.
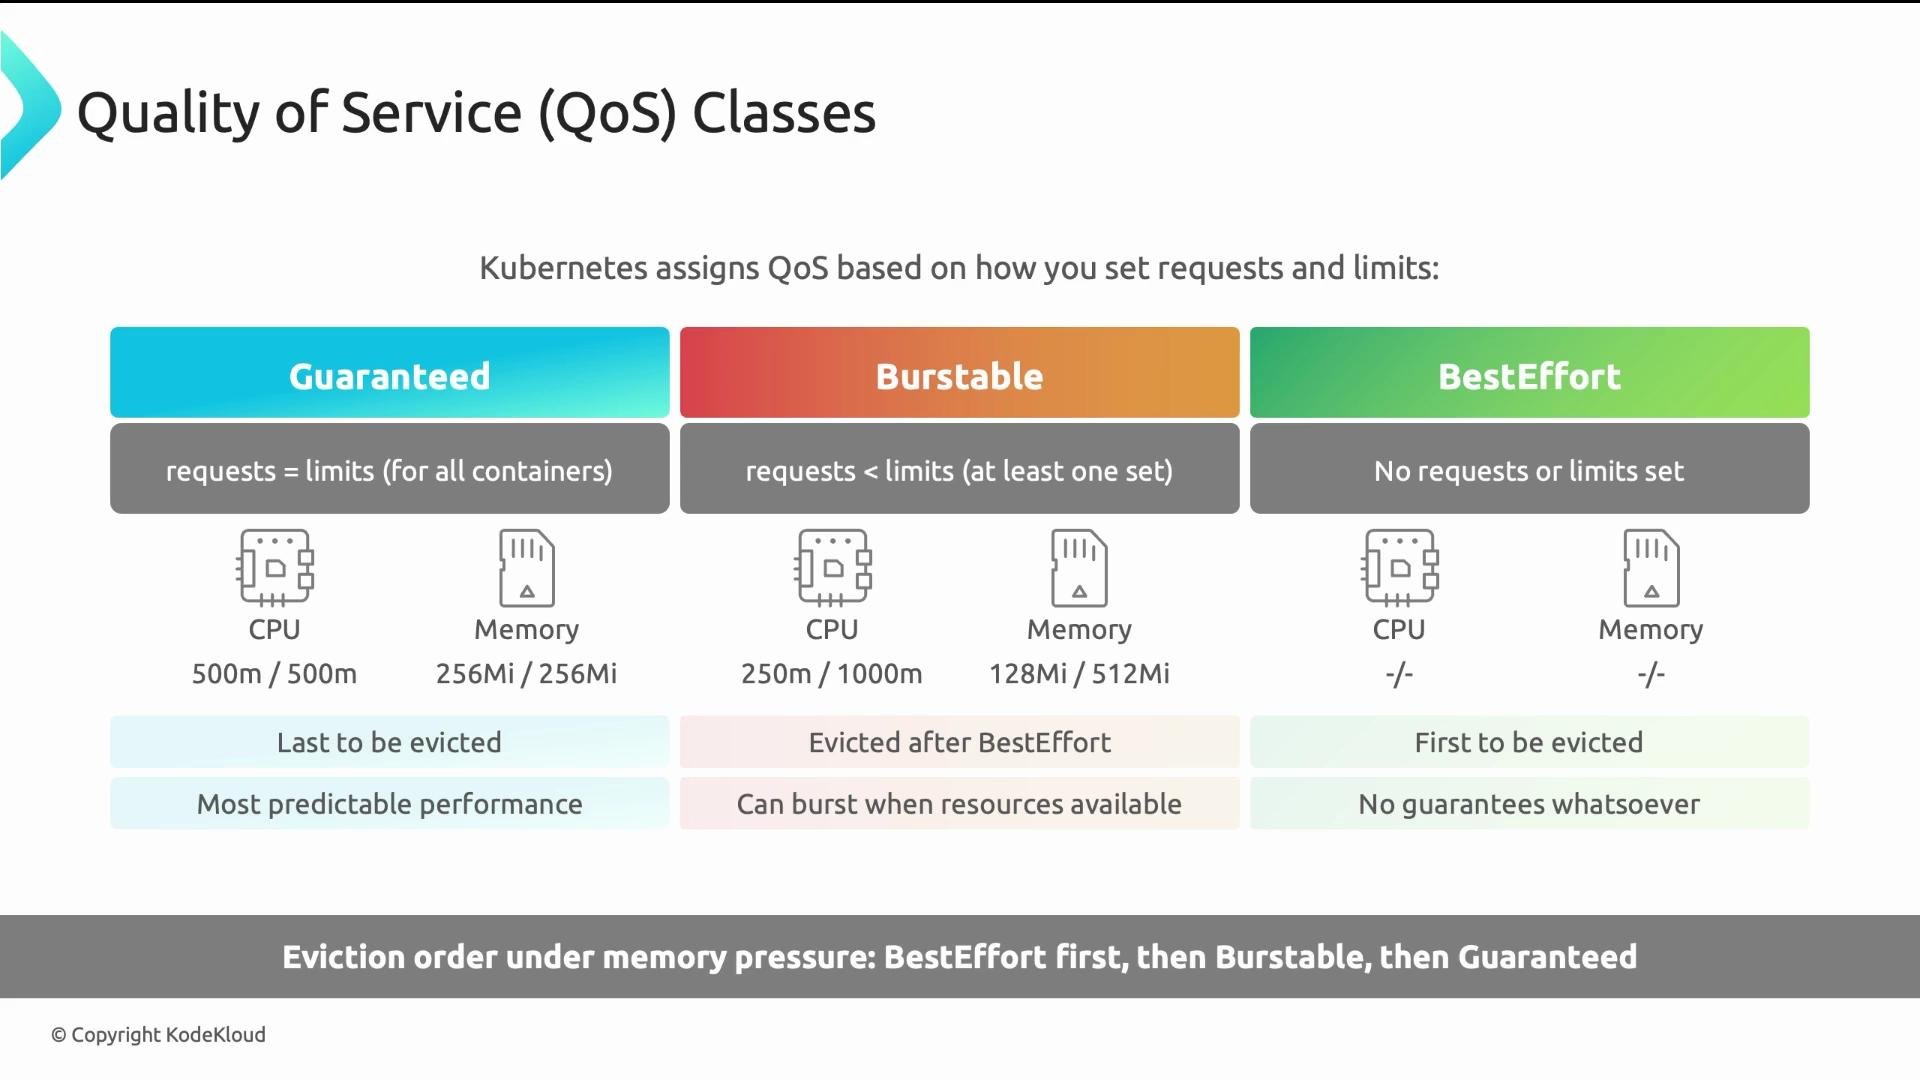
- QoS classes determine eviction order—use Guaranteed (requests == limits) for critical workloads.
- CPU throttles; memory kills. Set memory limits carefully and monitor OOMKilled events.
- Profile first: use the 95th percentile for requests, set limits 2–3× higher, and validate with monitoring or VPA.
- Kubernetes documentation — Resource Management for Pods and Containers: https://kubernetes.io/docs/concepts/configuration/manage-resources-containers/
- Prometheus monitoring: https://prometheus.io/
- kubectl top: https://kubernetes.io/docs/reference/generated/kubectl/kubectl-commands#top
- Vertical Pod Autoscaler (VPA): https://github.com/kubernetes/autoscaler/tree/master/vertical-pod-autoscaler