

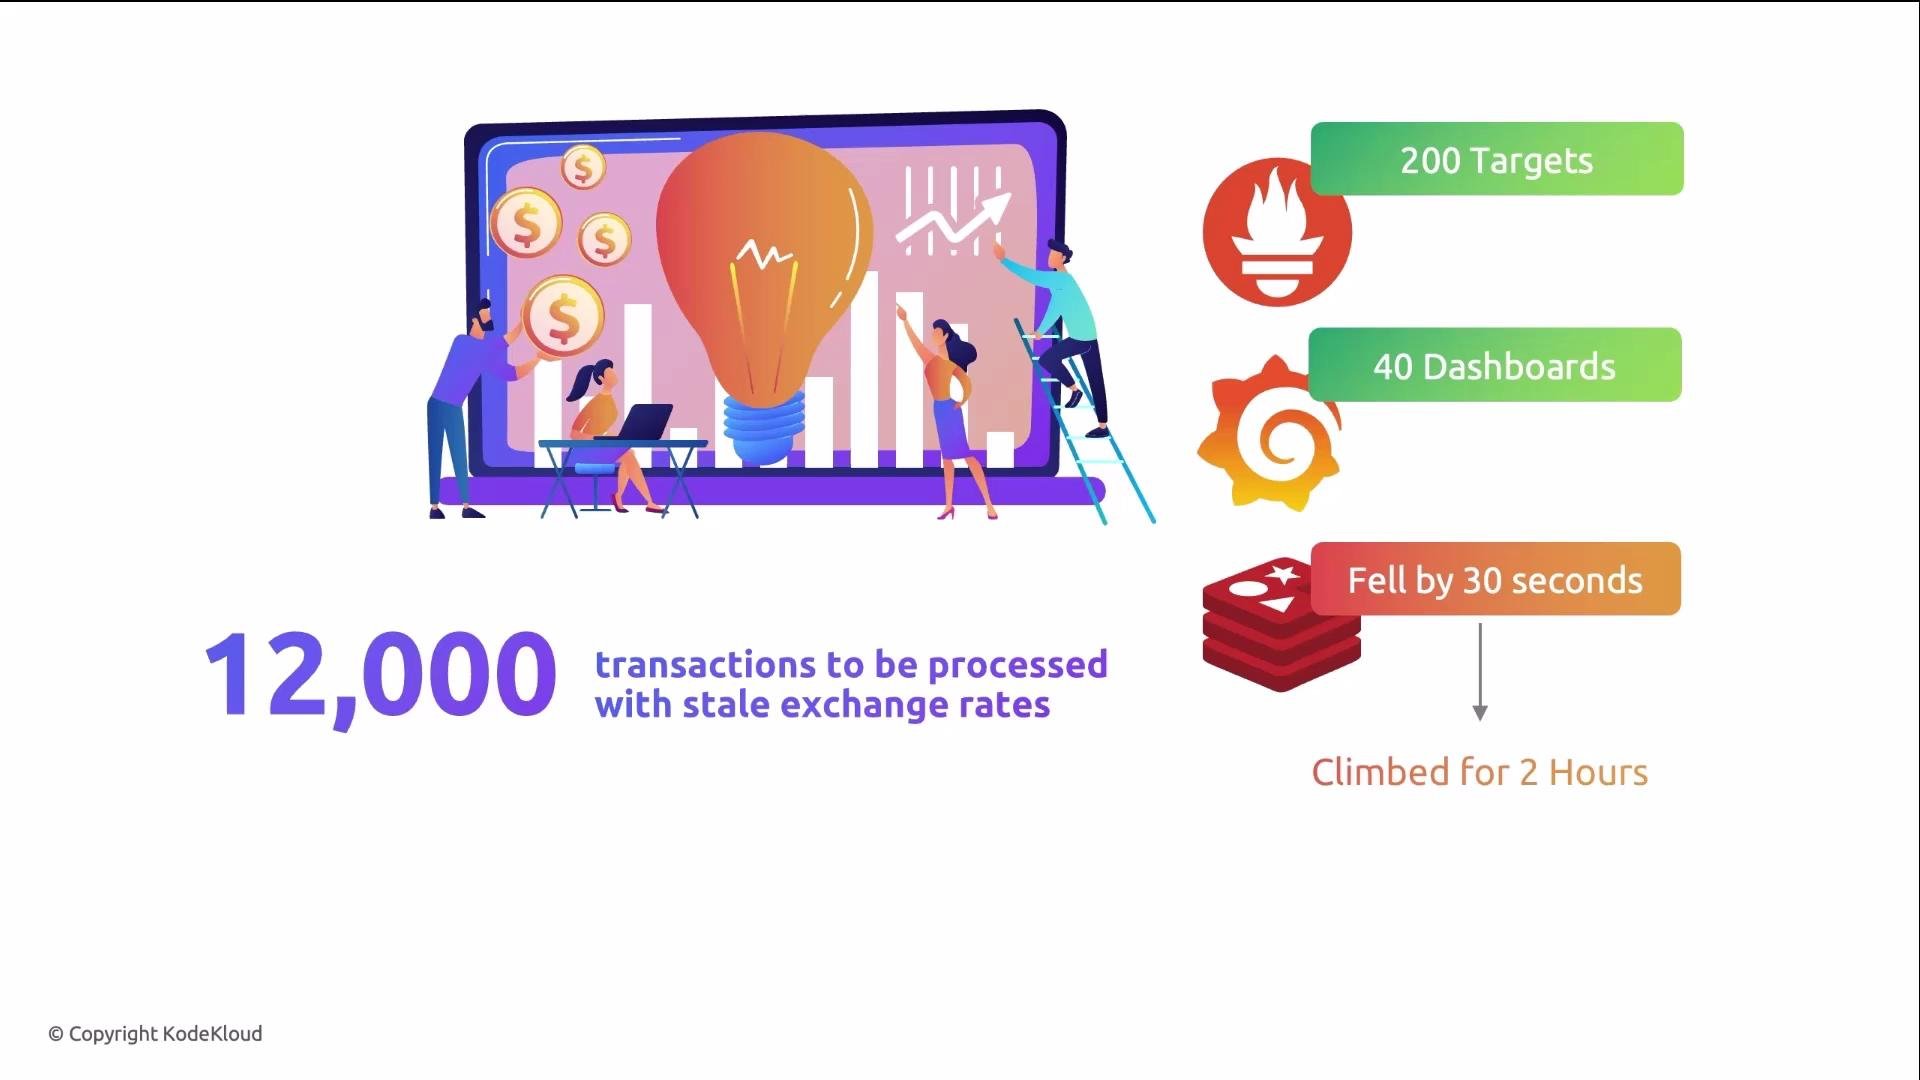
- Prometheus periodically evaluates PromQL expressions (for example, every 15s, depending on your
evaluation_interval). - Alerting should be automatic: it removes reliance on someone visually monitoring dashboards.
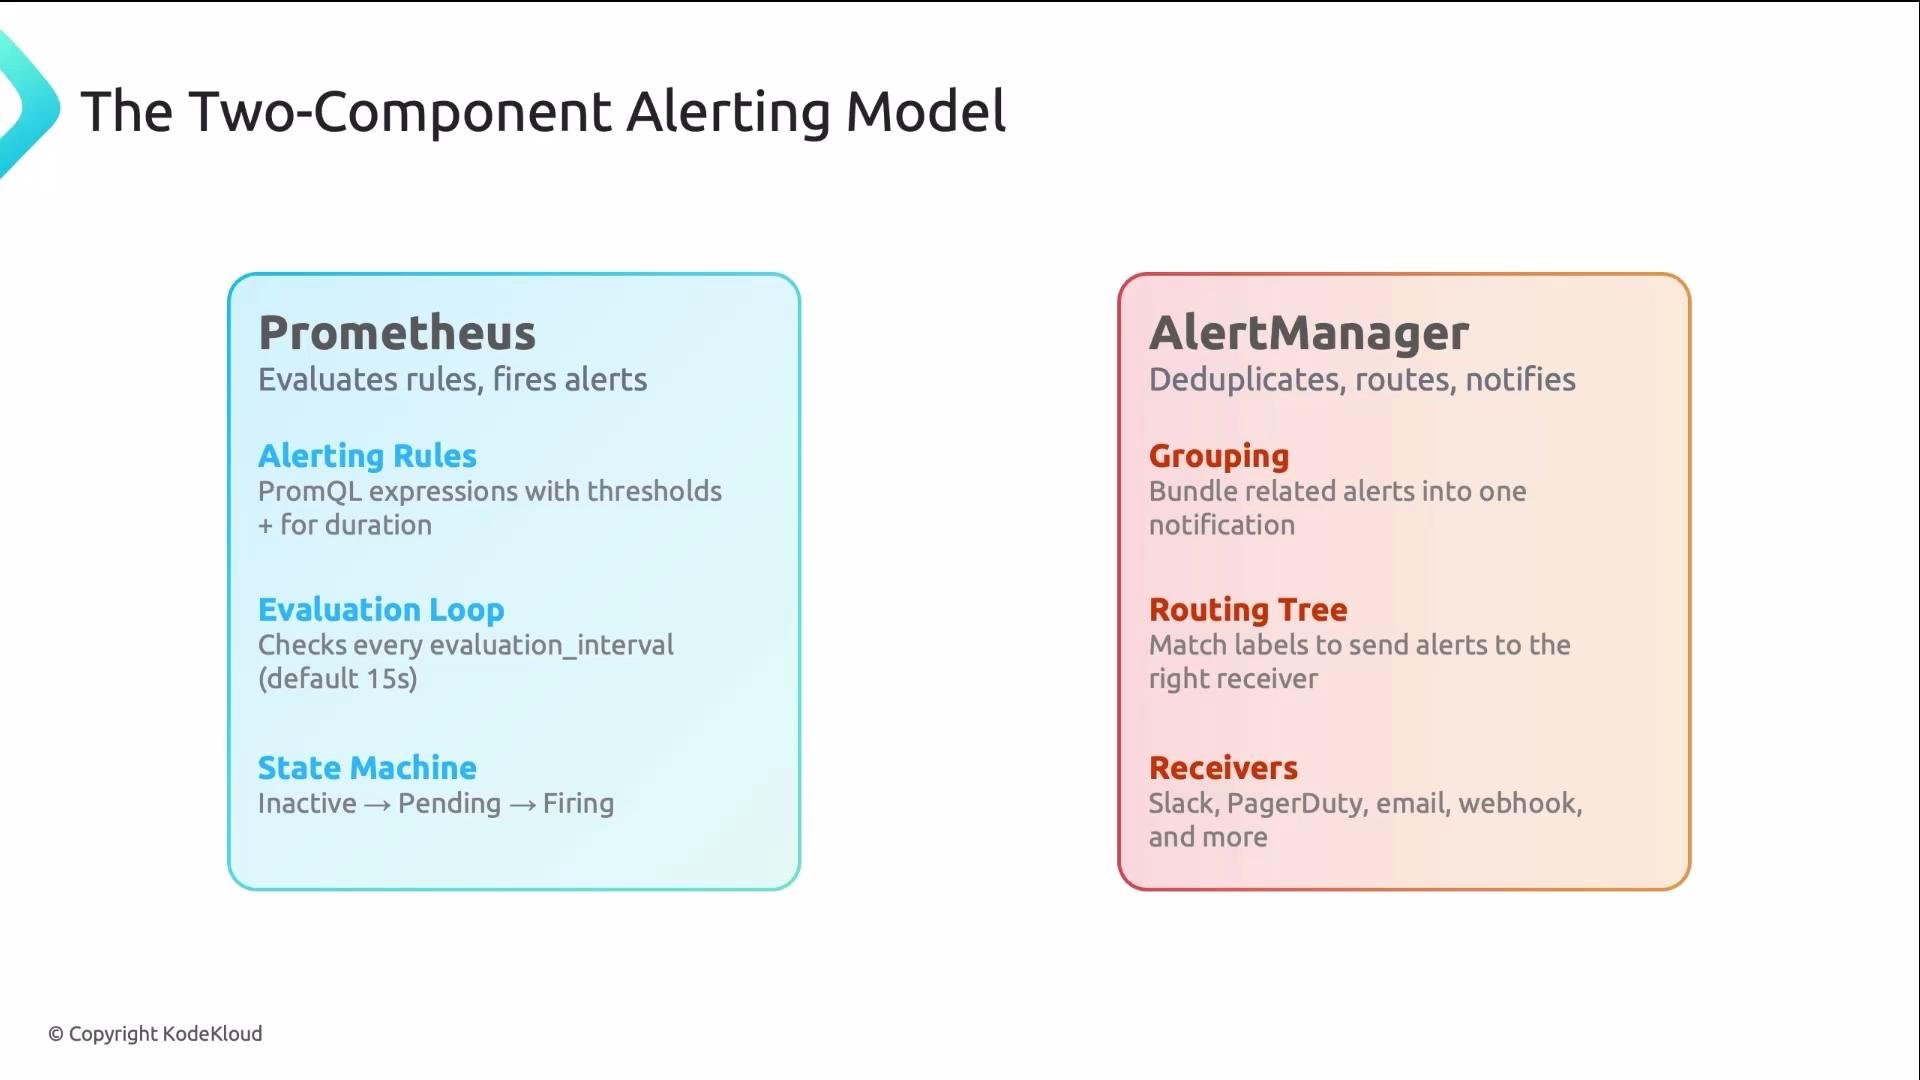
- Alertmanager performs grouping, deduplication, inhibition, and routing so the right people get paged while others receive lower-priority notifications.
- Prometheus: evaluates alerting rules and decides when an alert should fire.
- Alertmanager: receives firing alerts, deduplicates/group them, applies inhibition rules, and sends notifications to receivers (Slack, PagerDuty, email, etc.).
alert: logical name for the alert (used in routing and grouping).expr: PromQL expression that evaluates to true/false or returns series.for: debounce duration — how long the condition must hold before transitioning frompendingtofiring.labels: routing and metadata (e.g.,severity,team).annotations: human-readable context such assummary,description, andrunbook_url.
Choose
for to filter transient spikes without delaying legitimate incidents. Typical ranges are 2–10 minutes depending on metric volatility and operational tolerance.inactive: the expression currently evaluates to false.pending: the expression is true but theforduration has not elapsed; no notification yet.firing: the condition held for theforperiod; Prometheus sends the alert to Alertmanager.
Alertmanager routing is first-match. Place your most critical or specific routes near the top. If a single alert matches multiple child routes, only the first match applies.
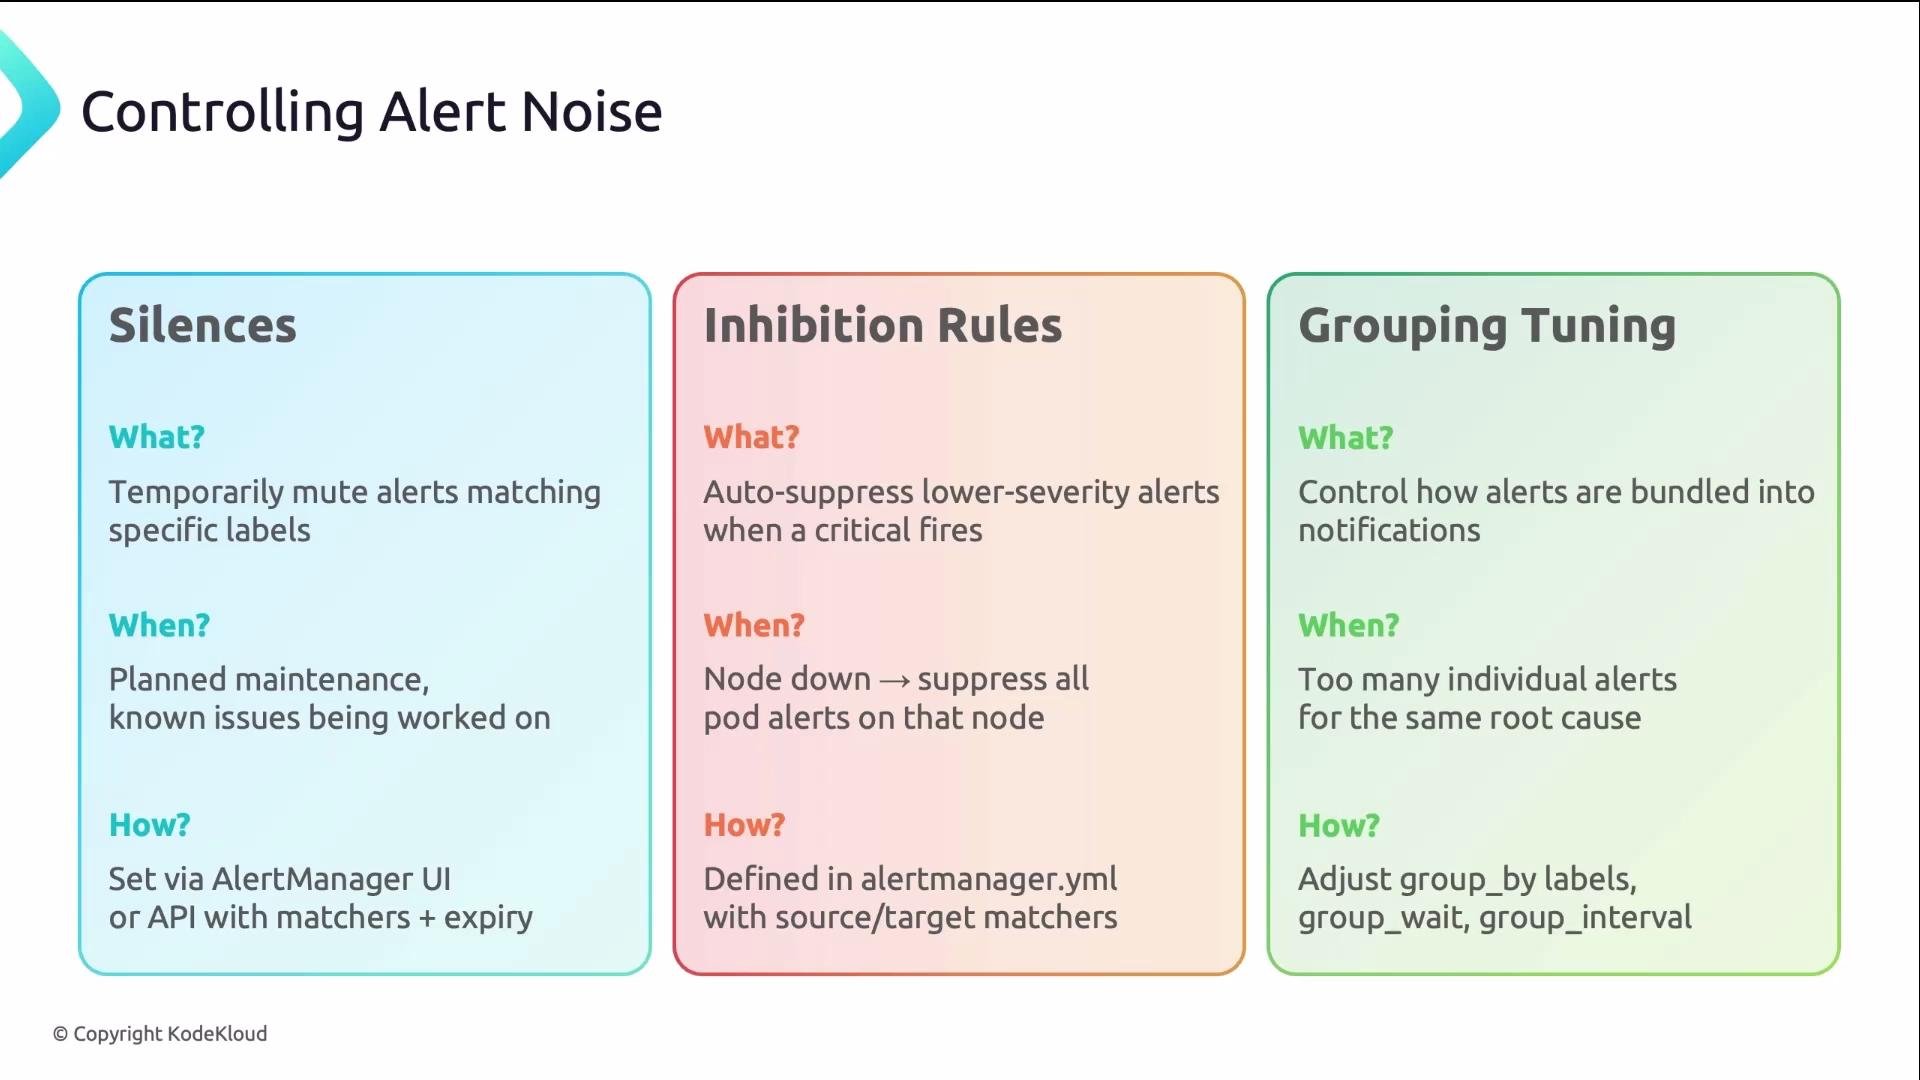
- Silences: temporary, manual mutes for expected noisy events (maintenance windows). Create via the Alertmanager UI or API.
- Inhibition rules: automatically suppress lower-priority alerts when a higher-priority alert is firing (e.g., inhibit pod alerts when node-level
NodeDownis firing). - Group tuning: control which labels are used in
group_by. Group broadly (alertname) to reduce messages, or addnamespace/instancefor finer granularity. - Rate limits & repeat tuning: use
group_intervalandrepeat_intervalto reduce frequent repeats. - Review rules periodically: remove stale rules and tune noisy rules; schedule quarterly reviews.
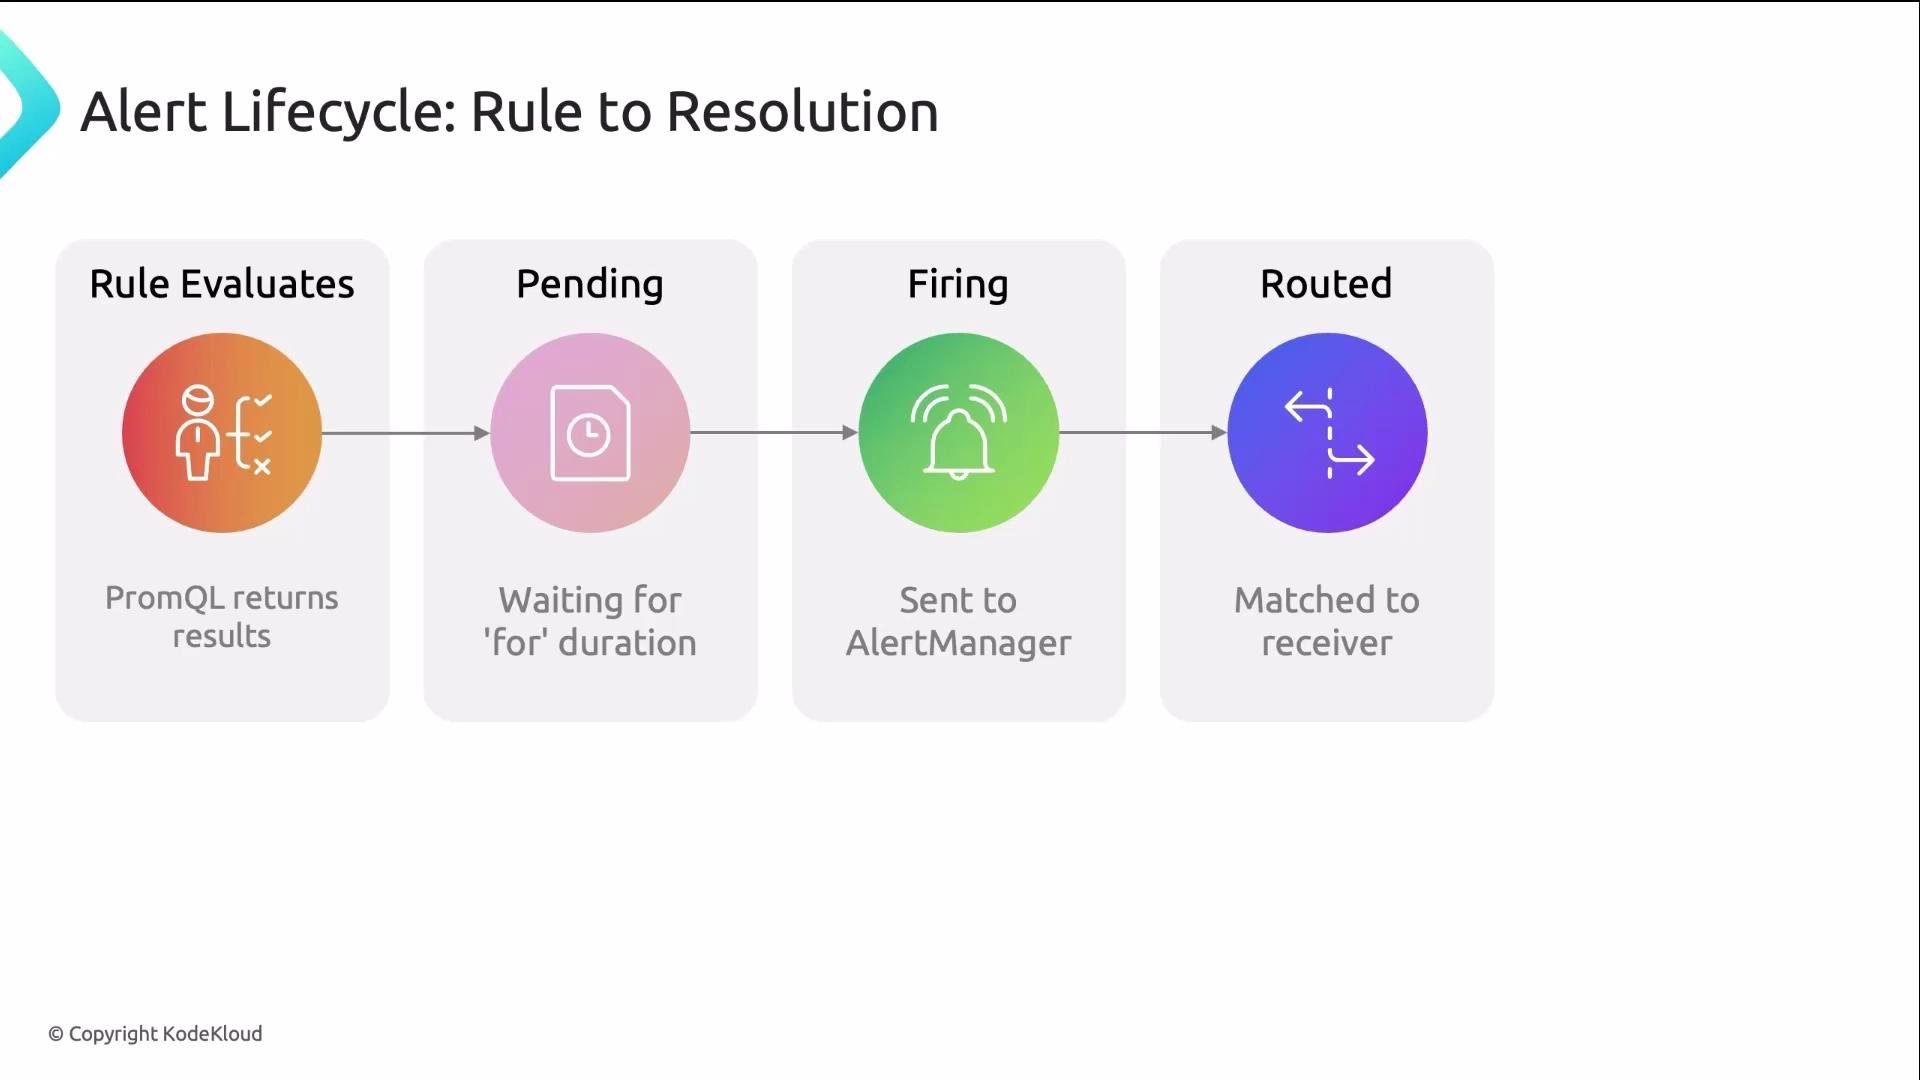
- Prometheus evaluates the alerting rule (PromQL returns series).
- If the expression is true but the
forwindow hasn’t elapsed, the alert goes topending. If it resolves during this time, no notification is sent. - If the condition persists for the
forduration, the alert transitions tofiring. Prometheus pushes the firing alert to Alertmanager. - Alertmanager groups incoming alerts per
group_by, applies inhibition/deduplication rules, and matches routing rules to select receivers. - Receivers (PagerDuty, Slack, email) get the notification. When Prometheus reports the alert resolved, Alertmanager sends a resolved/update notification.
- Alert on user-facing symptoms (latency, error rate), not only on low-level causes (CPU, disk). Symptoms directly correlate to customer impact.
- Add
runbook_urland clearannotationsso on-call engineers can act quickly. - Use
forwindows in the 2–10 minute range depending on metric noise and business risk. - Place critical routes first in Alertmanager to ensure correct delivery.
- Group alerts thoughtfully: too coarse → insufficient detail; too fine → too many notifications.
- Regularly review alert rule effectiveness and prune or fix rules that never fire or always fire.
- Prometheus evaluates rules and decides when alerts should fire.
- Alertmanager deduplicates, groups, inhibits, routes, and delivers notifications.
- Alerts include
expr,for,labels, andannotations. - Alertmanager routing is first-match; ordering and grouping choices are significant.
- Use silences, inhibition rules, and careful grouping to manage noise and preserve on-call trust.
- Prometheus docs: https://prometheus.io/docs/
- Alertmanager docs: https://prometheus.io/docs/alerting/latest/alertmanager/
- PromQL reference: https://prometheus.io/docs/prometheus/latest/querying/basics/
- Best practices for alerting (PagerDuty): https://www.pagerduty.com/blog/alerting-best-practices/