

What to check first: cluster workloads and Jaeger
Confirm Jaeger and your microservices are running:frontend-svc is missing. The frontend pod can be running and receiving traffic but still not appear in Jaeger if it is not configured to emit traces. The application needs OpenTelemetry environment variables to know to produce and export tracing data.
How tracing is enabled (overview)
You will add OpenTelemetry environment variables to the frontend deployment so the application exports traces to the Jaeger collector using OTLP:OTEL_SERVICE_NAME: name shown in Jaeger (e.g.,frontend-svc)OTEL_EXPORTER_OTLP_ENDPOINT: OTLP endpoint for the Jaeger collector (cluster DNS)OTEL_EXPORTER_OTLP_PROTOCOL:grpc(4317) orhttp/protobuf(4318)OTEL_TRACES_EXPORTER: typicallyotlp
Verify the Jaeger collector service and its ports
Before patching the deployment, confirm the collector service and exposed OTLP ports in theobservability namespace:
jaeger-collector with OTLP ports:
4317; HTTP/protobuf uses 4318. Make sure the protocol you set in OTEL_EXPORTER_OTLP_PROTOCOL matches the port you target — mismatch is a frequent cause of missing traces.
Ensure the container name you patch matches the container name defined in the deployment. Patching the wrong container leaves the environment variables unapplied and the service will continue not to emit traces.
Patch the frontend deployment to emit traces
Create or edit a patch that injects the OpenTelemetry environment variables into the frontend container. Example patch snippet (YAML):- If your cluster uses the collector in a different namespace, update the endpoint DNS accordingly (for example,
jaeger-collector.<namespace>.svc.cluster.local). - Choose
grpcand port4317together, orhttp/protobufand port4318together.
Recommended environment variables (table)
Confirm traces in Jaeger
After the new pod starts with the environment variables applied:- Open the Jaeger UI (see Jaeger docs: https://www.jaegertracing.io/docs/latest/getting-started/).
- Refresh the service dropdown —
frontend-svcshould now be available. - Search for traces and inspect any trace to view the waterfall visualization.
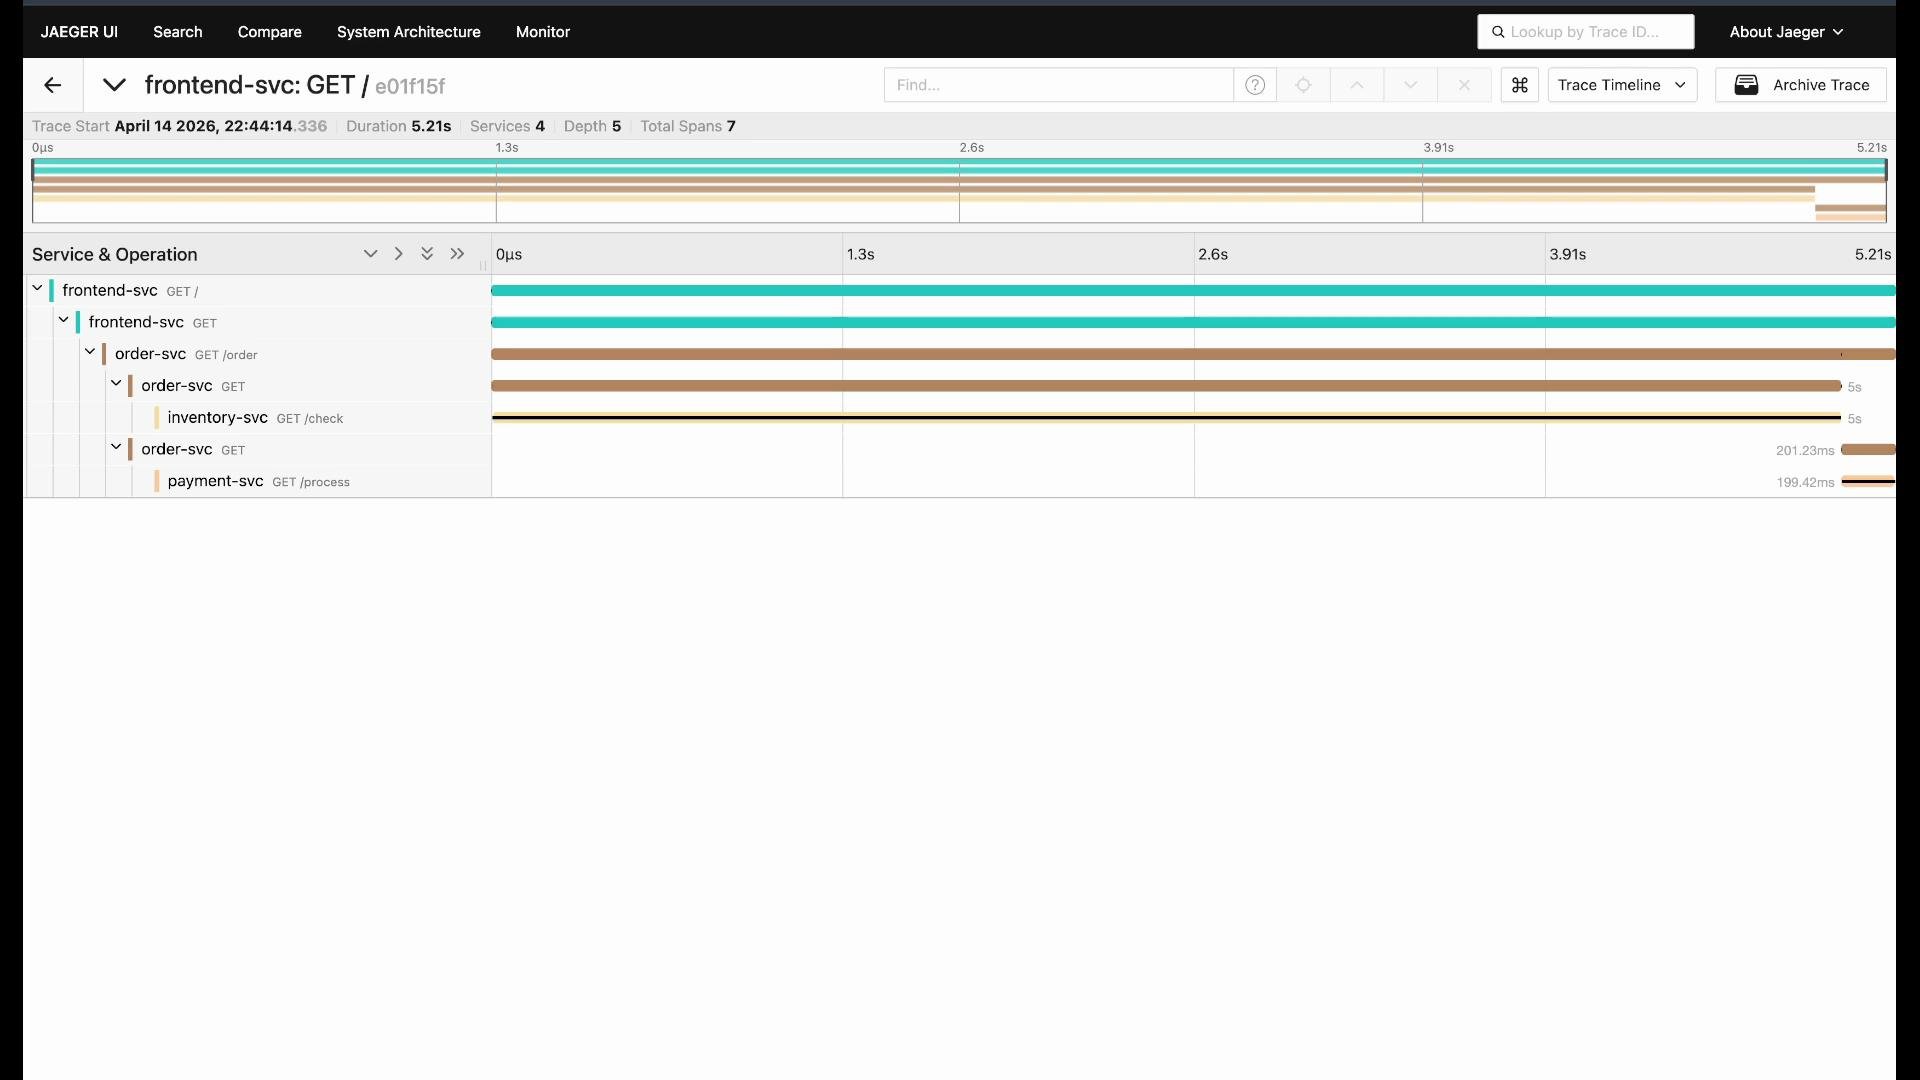
- The top-level span is the overall request (frontend); nested spans are downstream calls.
- The widest span typically indicates where time is being spent — start investigating there (in the example,
inventory-svcdominates latency). - In large systems, the waterfall view quickly highlights the slowest component and the sequence of calls.
Troubleshooting checklist
- Confirm the four OpenTelemetry environment variables are present in the running pod:
kubectl describe pod <pod-name> -n workloadsorkubectl exec -n workloads <pod> -- printenv | grep OTEL
- Verify the OTLP endpoint points to the correct collector service DNS and port.
- Ensure
OTEL_EXPORTER_OTLP_PROTOCOLmatches the endpoint port:grpc→ port4317http/protobuf→ port4318
- Make sure
OTEL_TRACES_EXPORTERis set tootlp. - Confirm you patched the correct deployment and container name.
If traces do not appear, the most common issues are: incorrect collector endpoint (DNS or port), protocol/port mismatch, or patching the wrong container name. Double-check those first.
Wrap-up and next steps
This walkthrough showed how to enable OpenTelemetry instrumentation for a Kubernetes-deployed service and visualize distributed traces in Jaeger. Try these steps in a lab or test cluster, and experiment with different OTLP protocols and collector configurations to understand how instrumented services communicate with Jaeger. Further reading:- OpenTelemetry: https://opentelemetry.io/
- Jaeger Tracing: https://www.jaegertracing.io/