Why enable auditing?
| Benefit | Description |
|---|---|
| Compliance & reporting | Produce tamper-evident audit trails to meet regulatory requirements and provide evidence for audits. |
| Threat detection | Spot anomalous or suspicious activity (privilege misuse, mass deletions, unusual logins). |
| Centralized analysis | Send audit events to Log Analytics, Storage, or Event Hubs for long-term retention and broader analytics. |
| Retention control | Configure retention policies to balance compliance needs against storage costs. |
Auditing scope and where to send logs
Auditing can be configured at the server level (applies to all databases on that server) or at the individual database level (applies only to that database). When enabling auditing you can send logs to:| Destination | When to use |
|---|---|
| Log Analytics workspace | Best for fast querying, alerting, and integrating with Azure Monitor and workbooks. |
| Storage account | Use for long-term retention, offline archiving, or regulatory storage requirements. |
| Event Hub | Stream events to SIEMs or third-party analytics pipelines. |
Choose the target that matches your operational and compliance needs: Log Analytics for analysis and alerts, Storage for long-term retention, or Event Hubs for streaming to third-party systems.
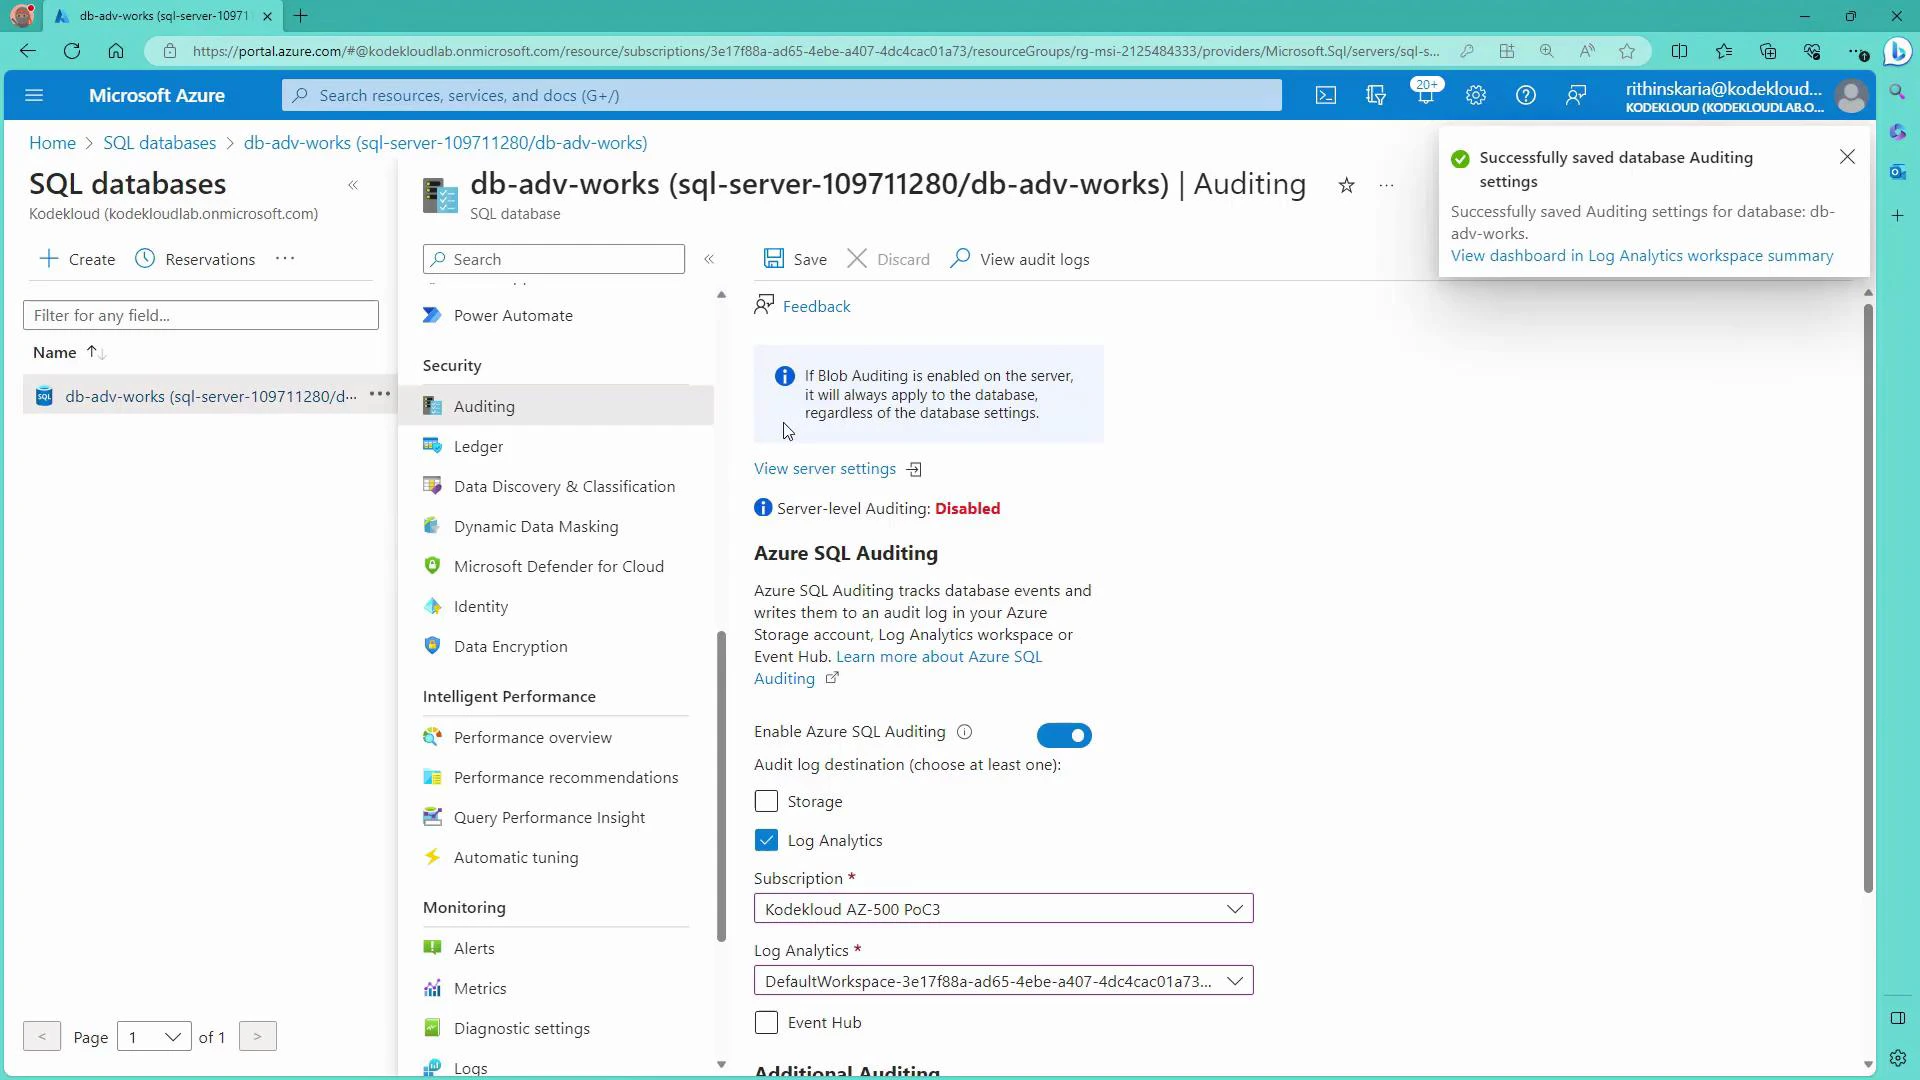
Configure auditing in the Azure portal
- Open the Azure portal and navigate to your Azure SQL Server or the specific database you want to audit.
- Select “Auditing” from the security settings.
- Choose the scope: Server-level or Database-level auditing.
- Select a target for audit logs — for this guide we use a Log Analytics workspace:
- Pick the subscription and the Log Analytics workspace you want to use (for example, a workspace created for Microsoft Defender for Cloud).
- Save the configuration.
Generate audit events (run queries)
To create auditable events, execute normal queries and modification statements from the Query Editor in the portal or from your preferred SQL client. Example read queries:When testing deletions or other destructive statements, run them in a development or staging environment, or ensure you have backups/snapshots in place before executing against production.
Viewing audit logs
- The database Auditing blade in the portal includes a “View audit logs” option, but entries may take time to appear there.
- For faster access, richer searches, and alerting, use the Log Analytics workspace where you directed the audit logs.
Viewing audit logs from the database Auditing blade may show a delay. For more flexible analysis and faster querying, use the Log Analytics workspace where you sent the audit logs.
Analyze audit events in Log Analytics (KQL)
Audit events are typically available in the AzureDiagnostics table and filtered by Category == “SQLSecurityAuditEvents”. Use Kusto Query Language (KQL) to filter, aggregate, and visualize events. Examples: Count SELECT statements by statement text and user:- Column names may vary with configuration; common fields include TimeGenerated, statement_s, server_principal_name_s, client_ip_s, Resource, and action_name_s.
- Extend queries to filter by TimeGenerated, Resource (database name), client_ip_s, or action_name_s for precise results.
Notes
- Audit column names can differ depending on the version and configuration; use the Log Analytics schema viewer or run a broad query to inspect available fields.
- If you need long-term archival beyond Log Analytics retention, combine Log Analytics with a Storage account or export via Event Hub.
Next steps (automation & scaling)
- Create alerts in Azure Monitor based on KQL queries to notify on suspicious actions (e.g., frequent failed logins or mass deletes).
- Integrate Event Hub to stream audit events to your SIEM or third-party analytics.
- Implement a retention and archival policy: store critical audit trails in Storage for compliance and keep shorter, queryable windows in Log Analytics for day-to-day operations.
Links and references
- Azure SQL Database auditing overview
- Log Analytics query language (Kusto Query Language)
- Microsoft Defender for Cloud