

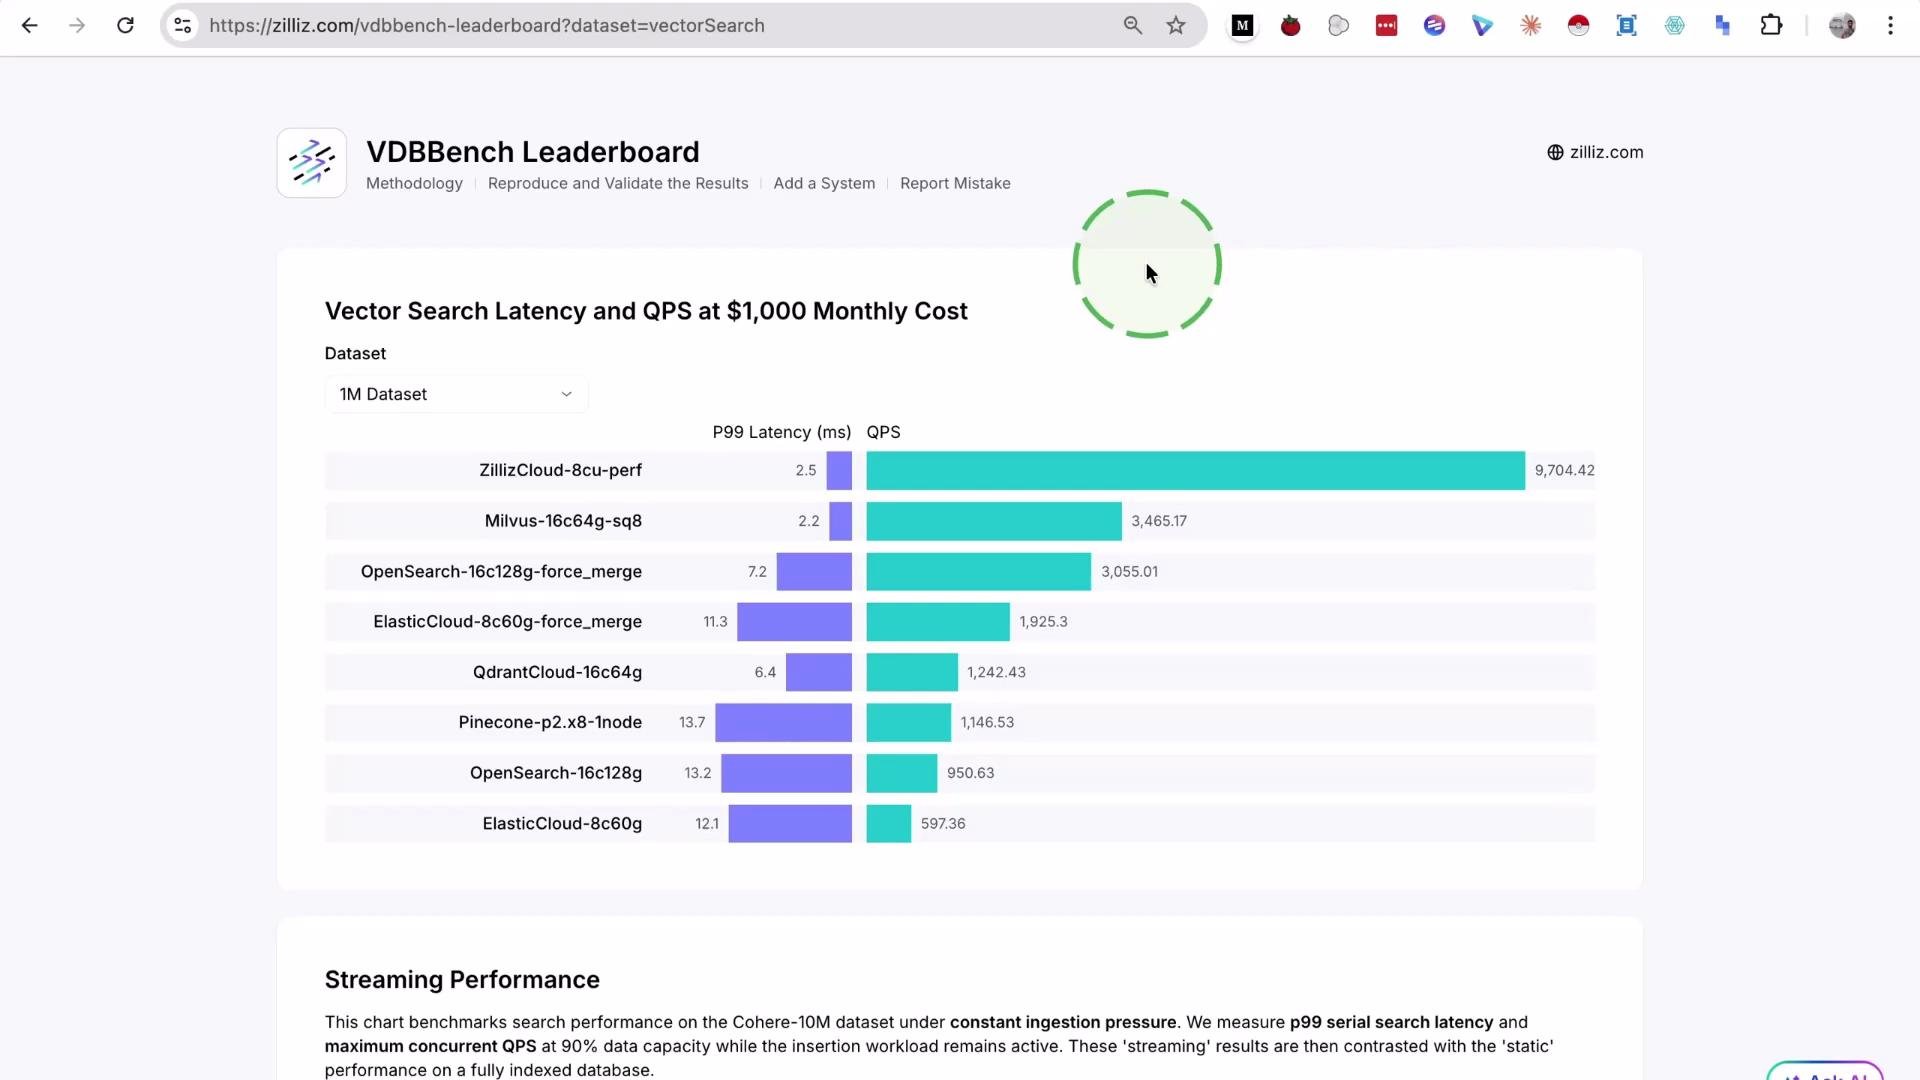
1) Cost-normalized latency and QPS (fixed $1,000 monthly budget)
Why fix the cost? Comparing raw performance without equalizing infrastructure spend is like comparing a sports car to a hatchback — not fair. VDBench fixes the budget at$1,000/month and asks: given that spend, what throughput (QPS) and tail latency (P99) can each database deliver?
This cost-normalized view surfaces real-world price/performance trade-offs. Key points:
- Use the dataset size selector (commonly
1Mor10Mvectors) because index size affects memory, I/O patterns, and resource consumption. - Rankings can change with dataset scale; validate the scale that mirrors your production workload.
- The leaderboard snapshot above shows Alibaba Cloud leading at this budget point, followed by services like AWS OpenSearch and Elastic Cloud — but your dataset and index configuration may change the order.
2) Streaming (ingestion-aware) performance
In production you rarely run only reads or only writes. Embeddings are ingested continuously while users query the system. VDBench measures search performance while concurrent inserts occur (for example, 500 or 1,000 rows/sec) to show how systems behave under realistic, mixed workloads.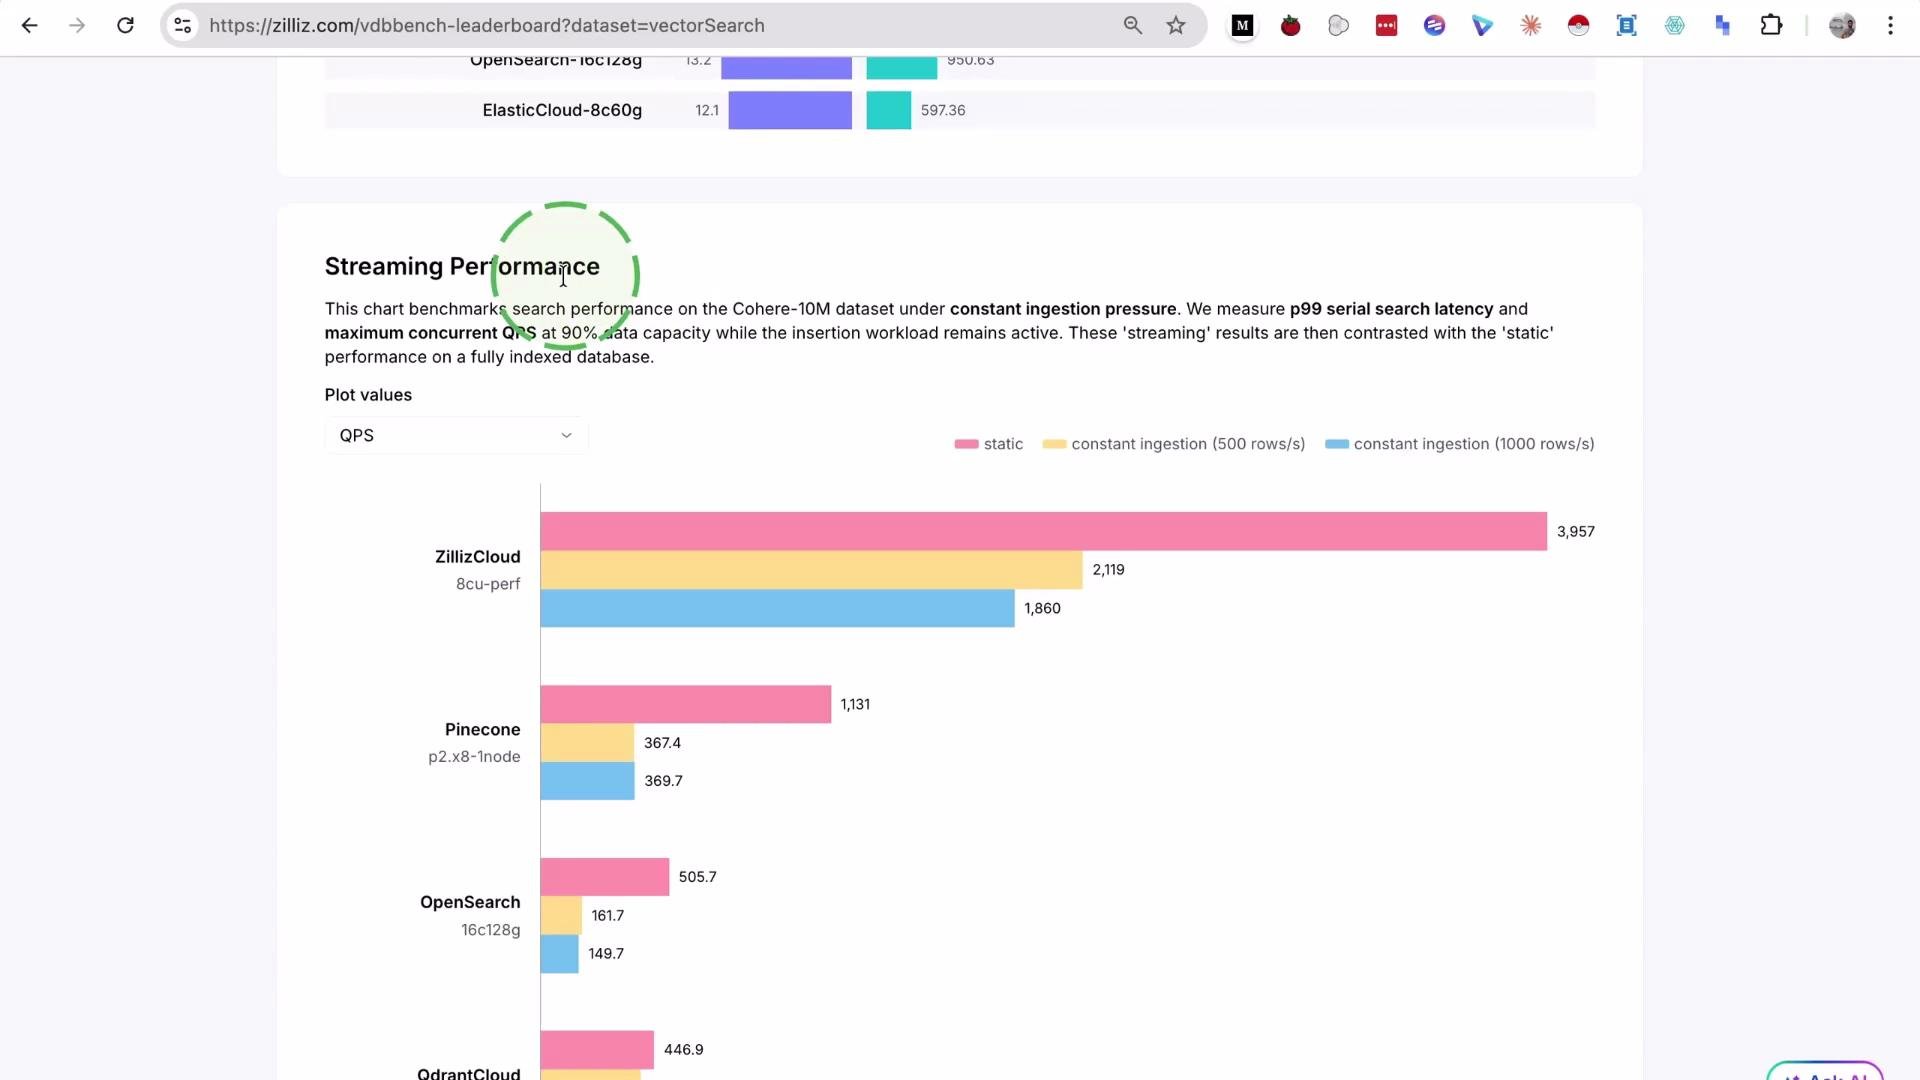
- Look at both
QPSunder ingestion andP99under ingestion. - Some systems maintain throughput but increase tail latency; others drop throughput significantly.
- Choose databases that match your read/write mixing requirements if you perform continuous ingest.
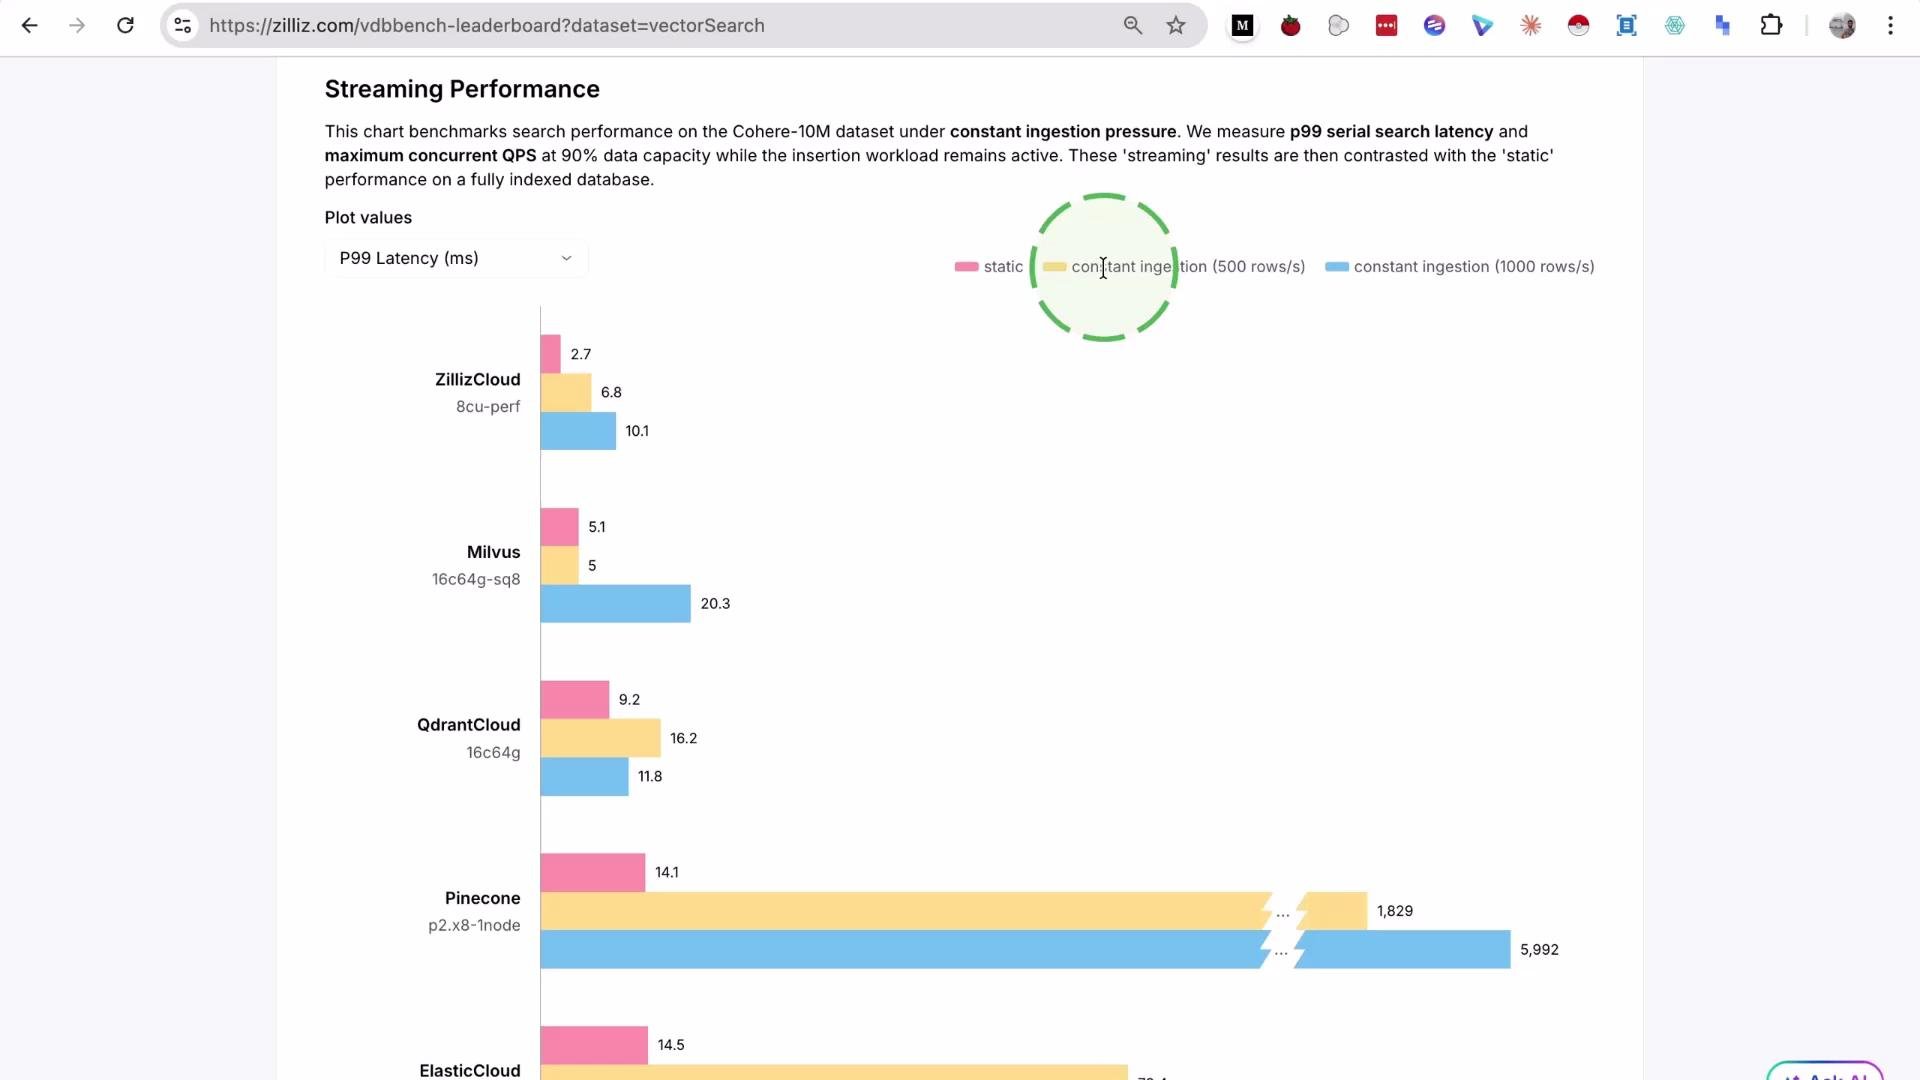
P99 view highlights tail-latency sensitivity during ingestion. Even a small number of slow requests can degrade user experience in latency-sensitive applications.
3) Performance vs. Recall (throughput vs. quality trade-off)
Recall measures how many of the true nearest neighbors the search returns (for example,recall = 0.95 means 95% of true neighbors were returned). Higher recall often requires scanning more candidates or using more accurate but expensive parameters, which reduces throughput.
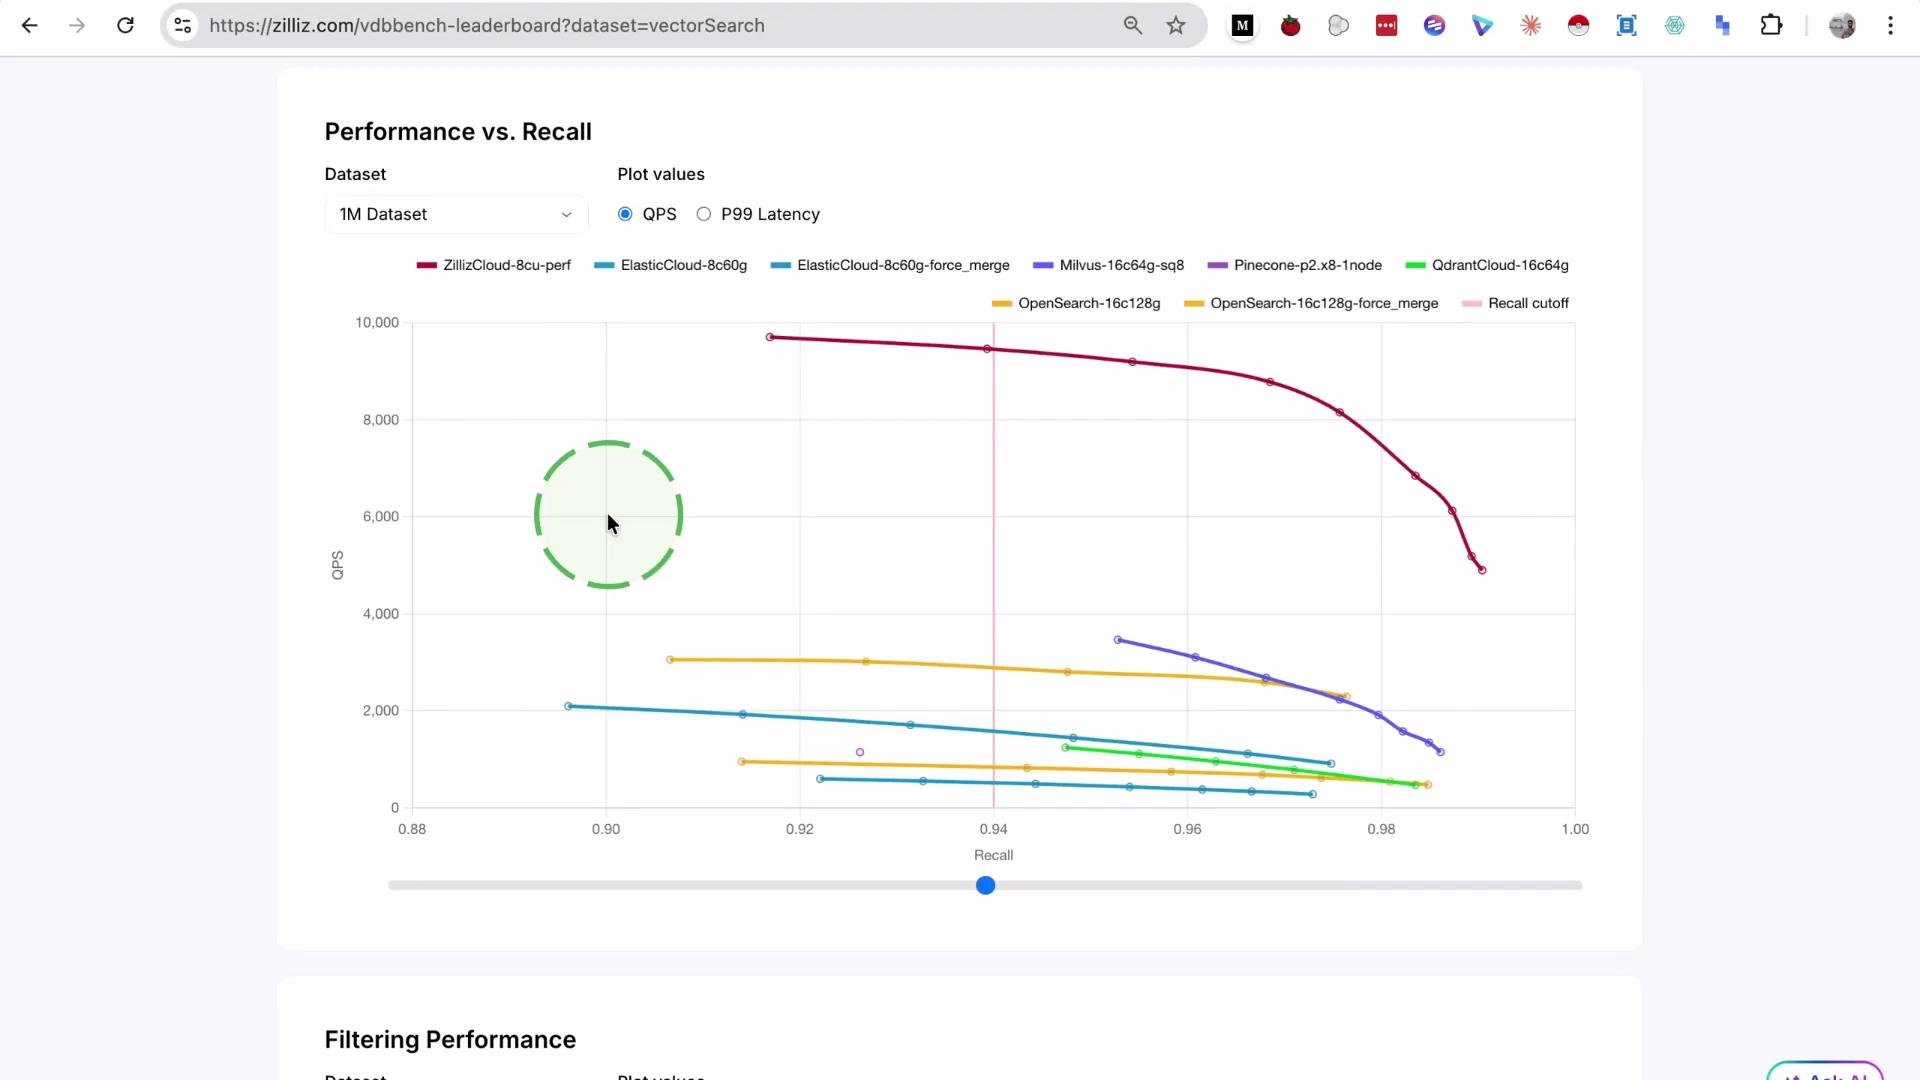
QPS vs recall. The ideal system sits at the top-right (high throughput and high recall). Key guidance:
- Decide the recall threshold your application requires (e.g., RAG pipelines typically need high recall to preserve context quality).
- Compare systems at equivalent recall thresholds rather than at default settings.
- Scale changes (1M → 10M) will shift the curve; re-evaluate at your target scale.
4) Filtered-search performance (vector + metadata)
Most real-world searches add metadata filters (e.g., category, date range, tenant). Filtering can change execution plans and resource usage dramatically.- Evaluate
QPS,P99, andrecallwith filters enabled. - Some databases excel at pure vector search but degrade heavily once filters are applied.
- If your application relies on attribute-scope (e.g., multi-tenant isolation or date-based filtering), prioritize filtered-search benchmarks.
Quick reference: What each metric tells you
VDBench is open source: its methodology and code are publicly available, so you can reproduce every result yourself. Prefer transparent, reproducible benchmarks over vendor-only claims to increase confidence in performance comparisons.
Beware of cherry-picked results. Always run benchmarks with dataset sizes, recall targets, and ingest patterns that reflect your production workload before choosing a database.
How to use the leaderboard effectively (practical checklist)
- Select the dataset size (
1M,10M, etc.) that matches your projected scale. - Pick a recall threshold that reflects downstream quality requirements (e.g.,
0.95for RAG). - Run streaming tests with your expected ingest rate to validate mixed-workload behavior.
- Include realistic filters and attribute queries if your product uses metadata scoping.
- Normalize cost (e.g.,
$1,000/monthor your target budget) to understand price/performance. - Reproduce tests with the open-source benchmark to validate results for your region/cloud/provider.
Conclusion
VDBench surfaces the most important dimensions for choosing a vector database: cost-normalized latency/QPS, ingestion-aware stability, the throughput-vs-recall trade-off, and filtered search behavior. Use these dimensions together — and validate with your data and workloads — to select the best fit for your application and budget. That is it for this lesson. Speak with you in the next lesson.Links and references
- Fundamentals of RAG — course
- VDBench — open-source benchmark (search the project repo or website to reproduce results)