

Scenario and dataset
We store the following items in a vector database:- Query fruit: mango
- Other fruits in the database: pineapple, banana, orange, papaya, lemon
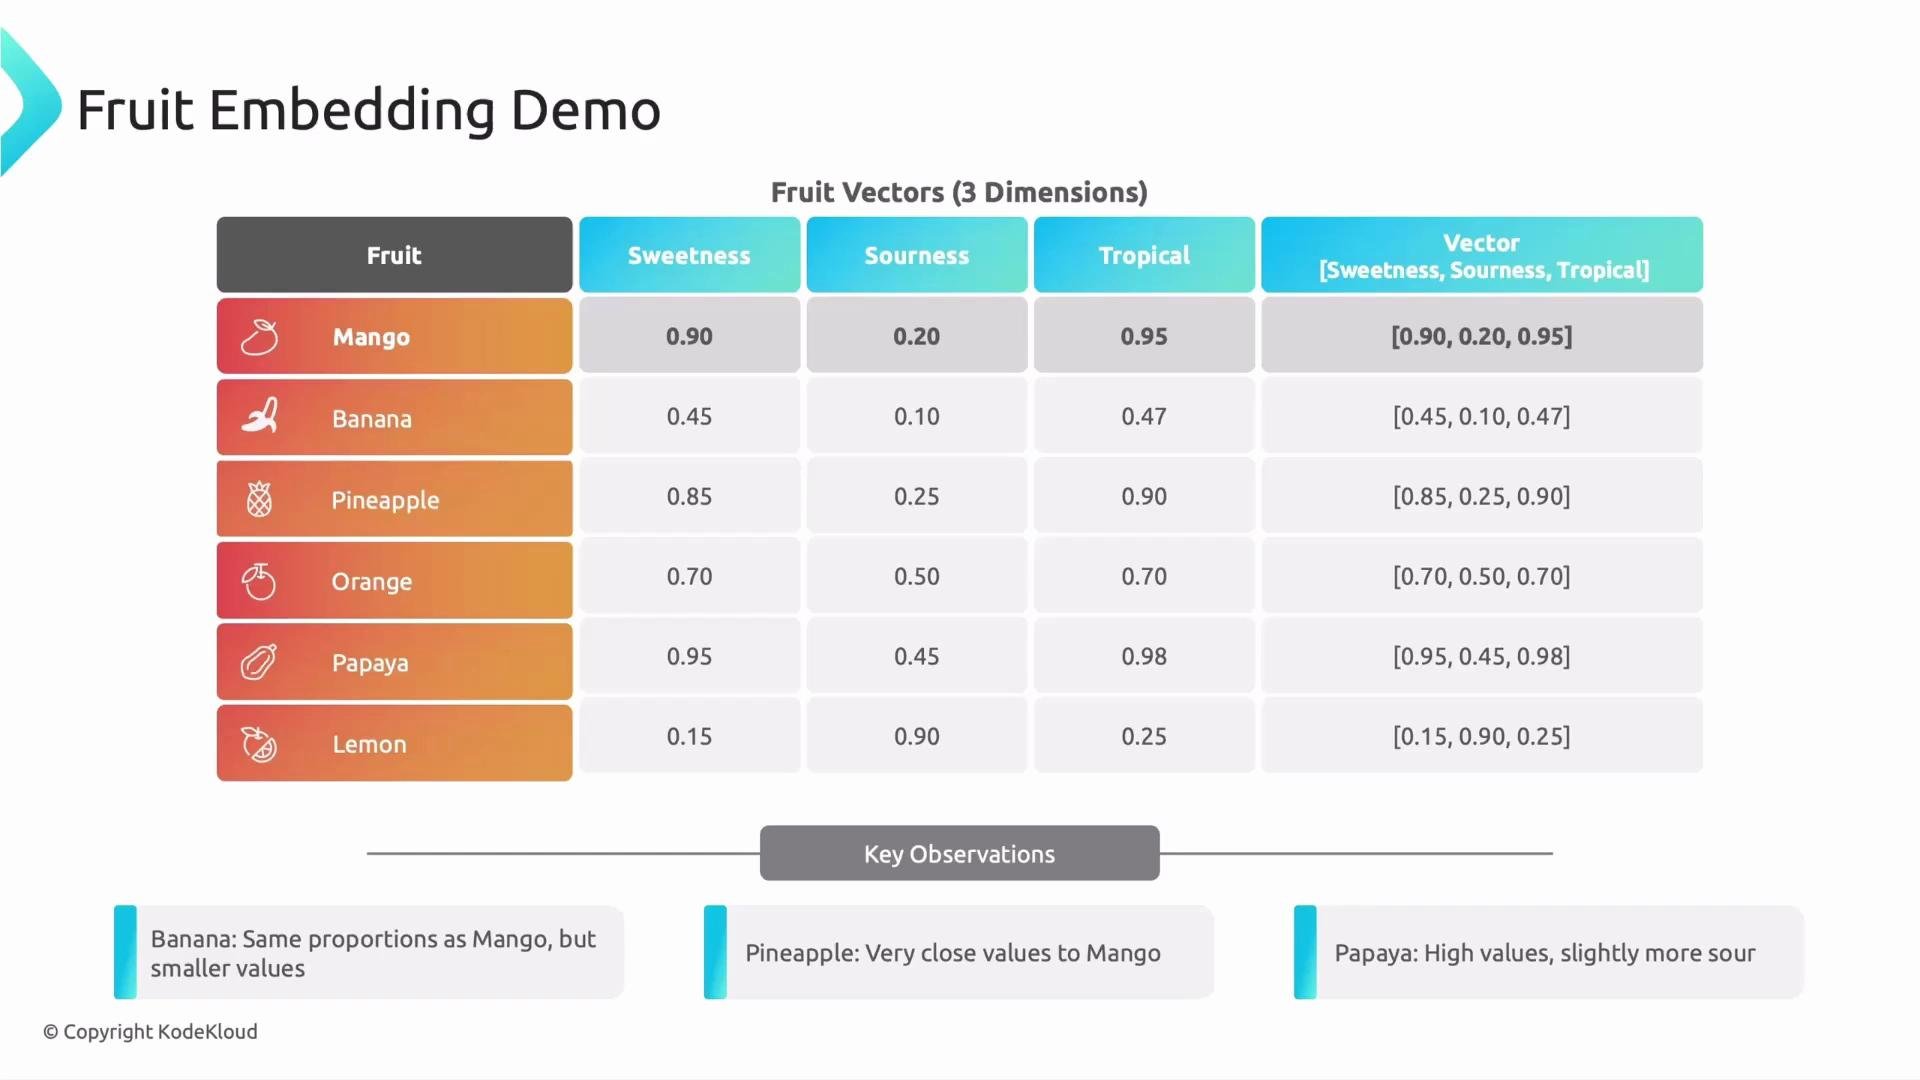
Interpreting the vectors
Each fruit vector locates the item in a 3D feature space (sweetness, sourness, tropicalness). When comparing fruits you compare vectors — not isolated features. Which dimensions matter depends on the question you ask:- “Find a fruit with the same sweetness as mango” — prioritize the sweetness component.
- “Find a fruit like mango but less tropical” — prioritize tropicalness.
- “Find similar fruits to mango” — compare the full vector using a similarity or distance metric.
2D projection for intuition
Projecting the vectors into two dimensions (for example, sweetness vs tropicalness) helps build visual intuition. Below, mango is the query point and other fruits are plotted relative to it. Note: the sourness axis is not shown, so the 2D projection only approximates true 3D proximity.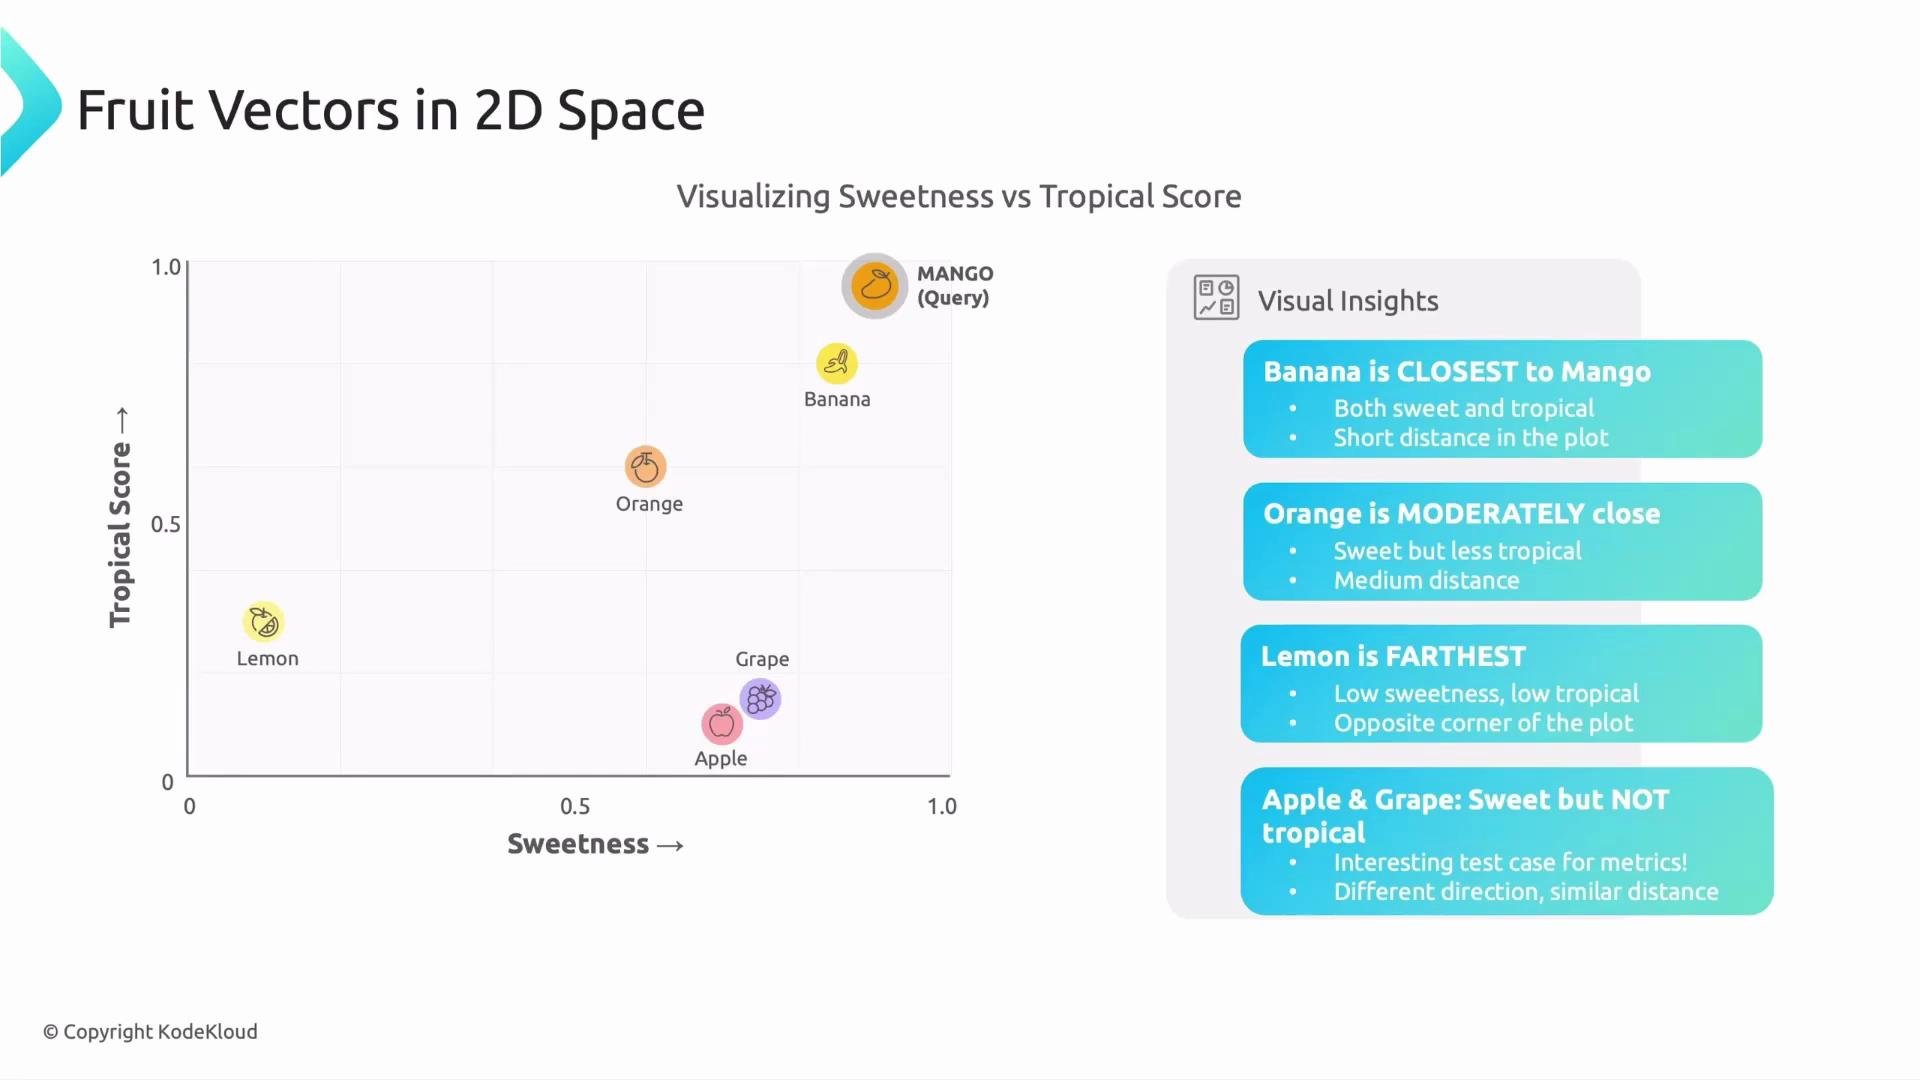
- Banana appears very close to mango (both sweet and tropical).
- Orange is moderately close.
- Lemon is far away (low sweetness, low tropicalness).
- Pineapple and papaya are tropical and may appear near mango depending on their sweetness and sourness.
Why the metric matters
Visual inspection is useful for intuition, but exact ranking requires choosing a similarity or distance metric. Common metrics:
Formulas:
When building recommendations, check ranking differences across metrics. The top result may be the same, but the ordering of subsequent candidates can change significantly depending on whether you use Euclidean distance, cosine similarity, or dot product.
How this applies to our fruit example
- Cosine similarity: prioritizes direction (relative proportions of sweetness, sourness, tropicalness). Good when you want size-invariant similarity (e.g., proportional taste profile).
- Euclidean distance: prioritizes absolute differences across features. Use this if exact feature magnitudes matter (you need the same level of sweetness).
- Dot product: favors vectors with larger magnitudes and good alignment. Use when strong feature values should dominate the ranking.
Practical guidance and tips
- If your embeddings are normalized (unit length), cosine similarity and dot product yield equivalent rankings — consider normalization if you care about direction only.
- If feature scales vary a lot, consider standardizing or normalizing features before computing Euclidean distance.
- For production systems, benchmark top-k precision across metrics using held-out queries to pick the metric that matches your business objective (user satisfaction, click-through, conversion).
Links and references
- Retrieval-Augmented Generation (RAG) overview
- Understanding cosine similarity
- Euclidean distance explanation
- Dot product (inner product) notes