This article provides a hands-on demo for network analysis using Wireshark, covering practical scenarios and fundamental questions about the tool.
Welcome to our network analysis demo using Wireshark—a powerful tool for investigating network communication and troubleshooting connectivity issues. In this guide, we will explore practical scenarios using Wireshark and its terminal-based variant, Tshark. Whether you’re troubleshooting network problems or conducting cybersecurity investigations, this demo will equip you with valuable insights and hands-on experience.Before jumping into the hands-on labs, let’s answer some fundamental questions about Wireshark to reinforce your understanding.
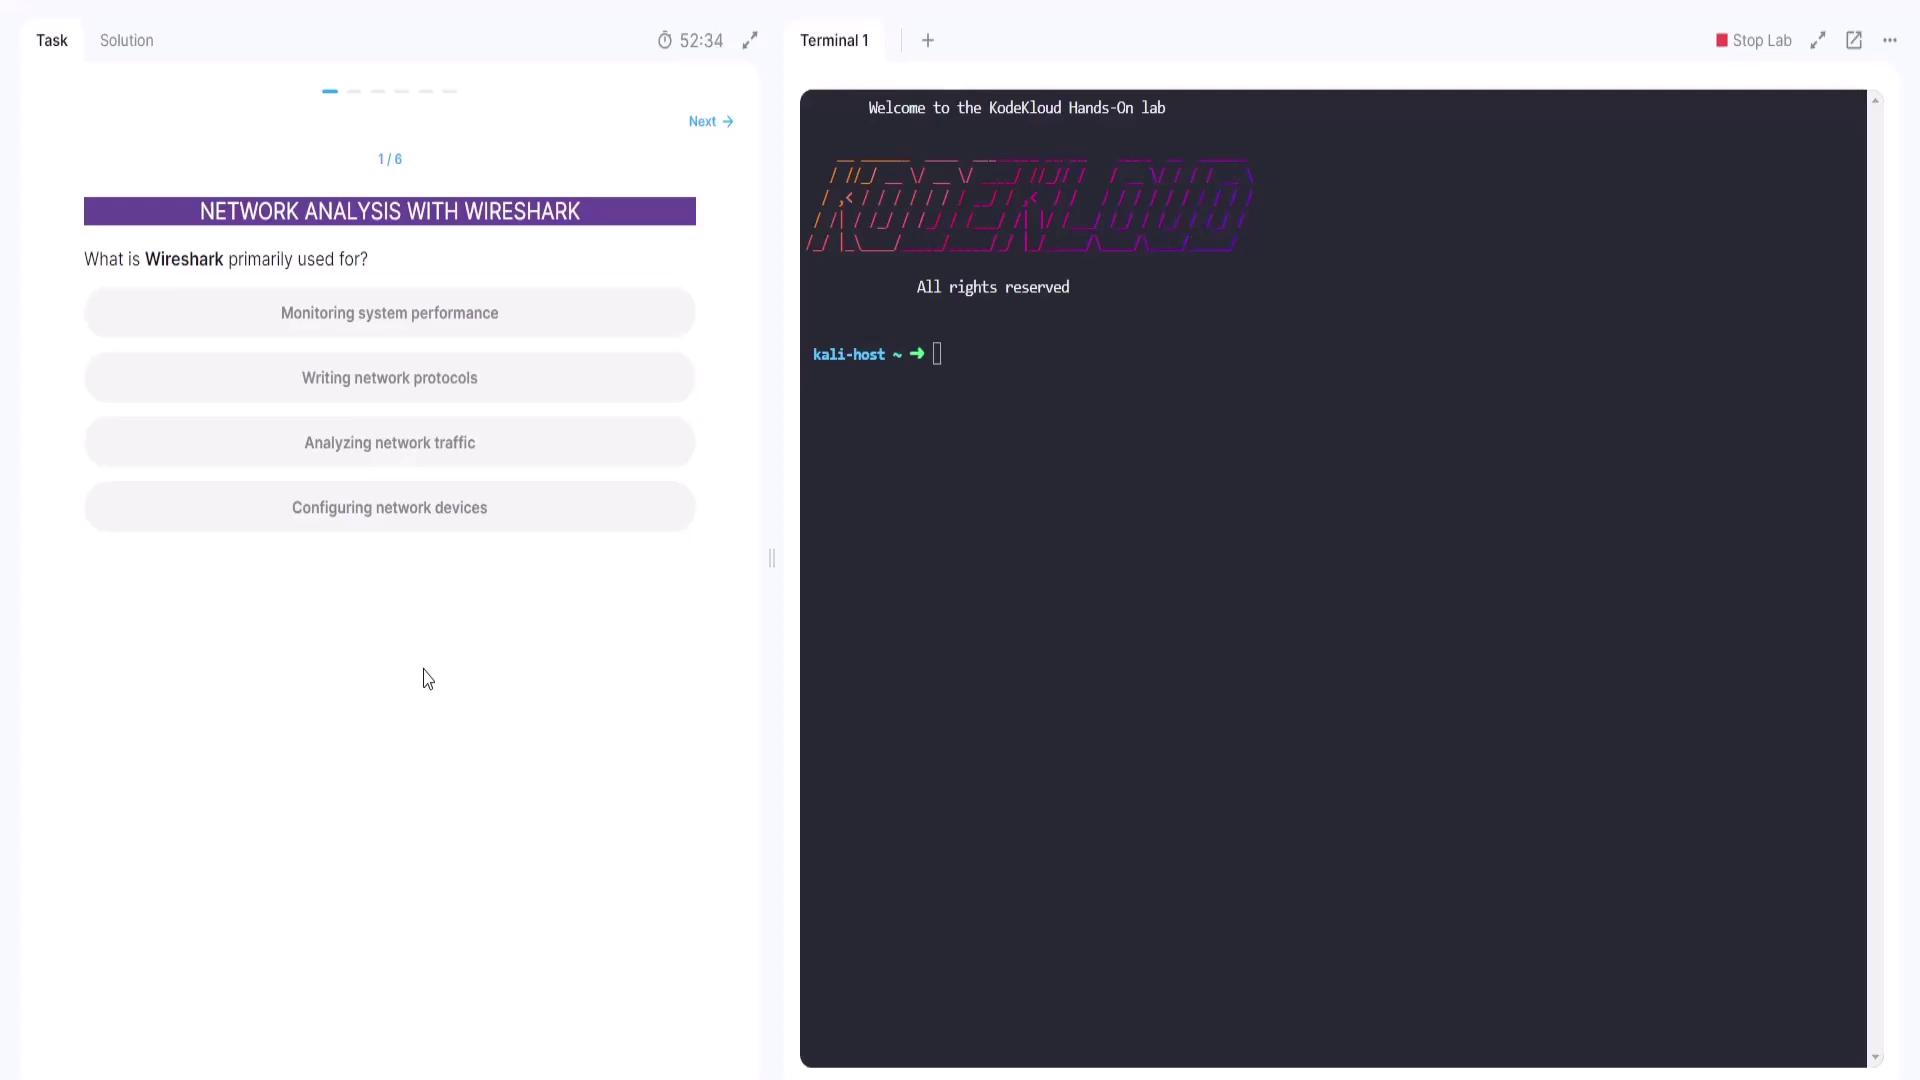
The first query in our hands-on lab asks:Which of the following is the primary application of Wireshark?
Monitoring system performance
Writing network protocols
Analyzing network traffic
Configuring network devices
Wireshark is specifically designed for analyzing network traffic. Unlike the other options, it is not built to monitor system performance, write protocols, or configure devices.
Question 3: Capturing Traffic from a Specific IP Address
The third question in our lab is:How can you capture only traffic from a specific IP address in Wireshark?
Using the filter TCP
Using the capture filter host 192.168.1.1
Using the filter UDP
Using the display filter ip.address == 192.168.1.1
Using TCP or UDP filters would restrict the view based on protocol, while the display filter (ip.address == 192.168.1.1) only affects the already captured data. To capture traffic exclusively from a specific IP right from the start, you should use the capture filter:
Use the capture filter “host 192.168.1.1” to ensure that only traffic from the specified IP is captured.
The fourth question asks:Which of the following is NOT a feature of Wireshark?
Packet filtering
Real-time packet capturing
Editing captured packets
Displaying protocol details
Wireshark provides extensive capabilities for packet filtering, real-time packet capturing, and protocol analysis. However, it does not support modifying or editing the captured packets. Thus, the correct answer is Editing captured packets.
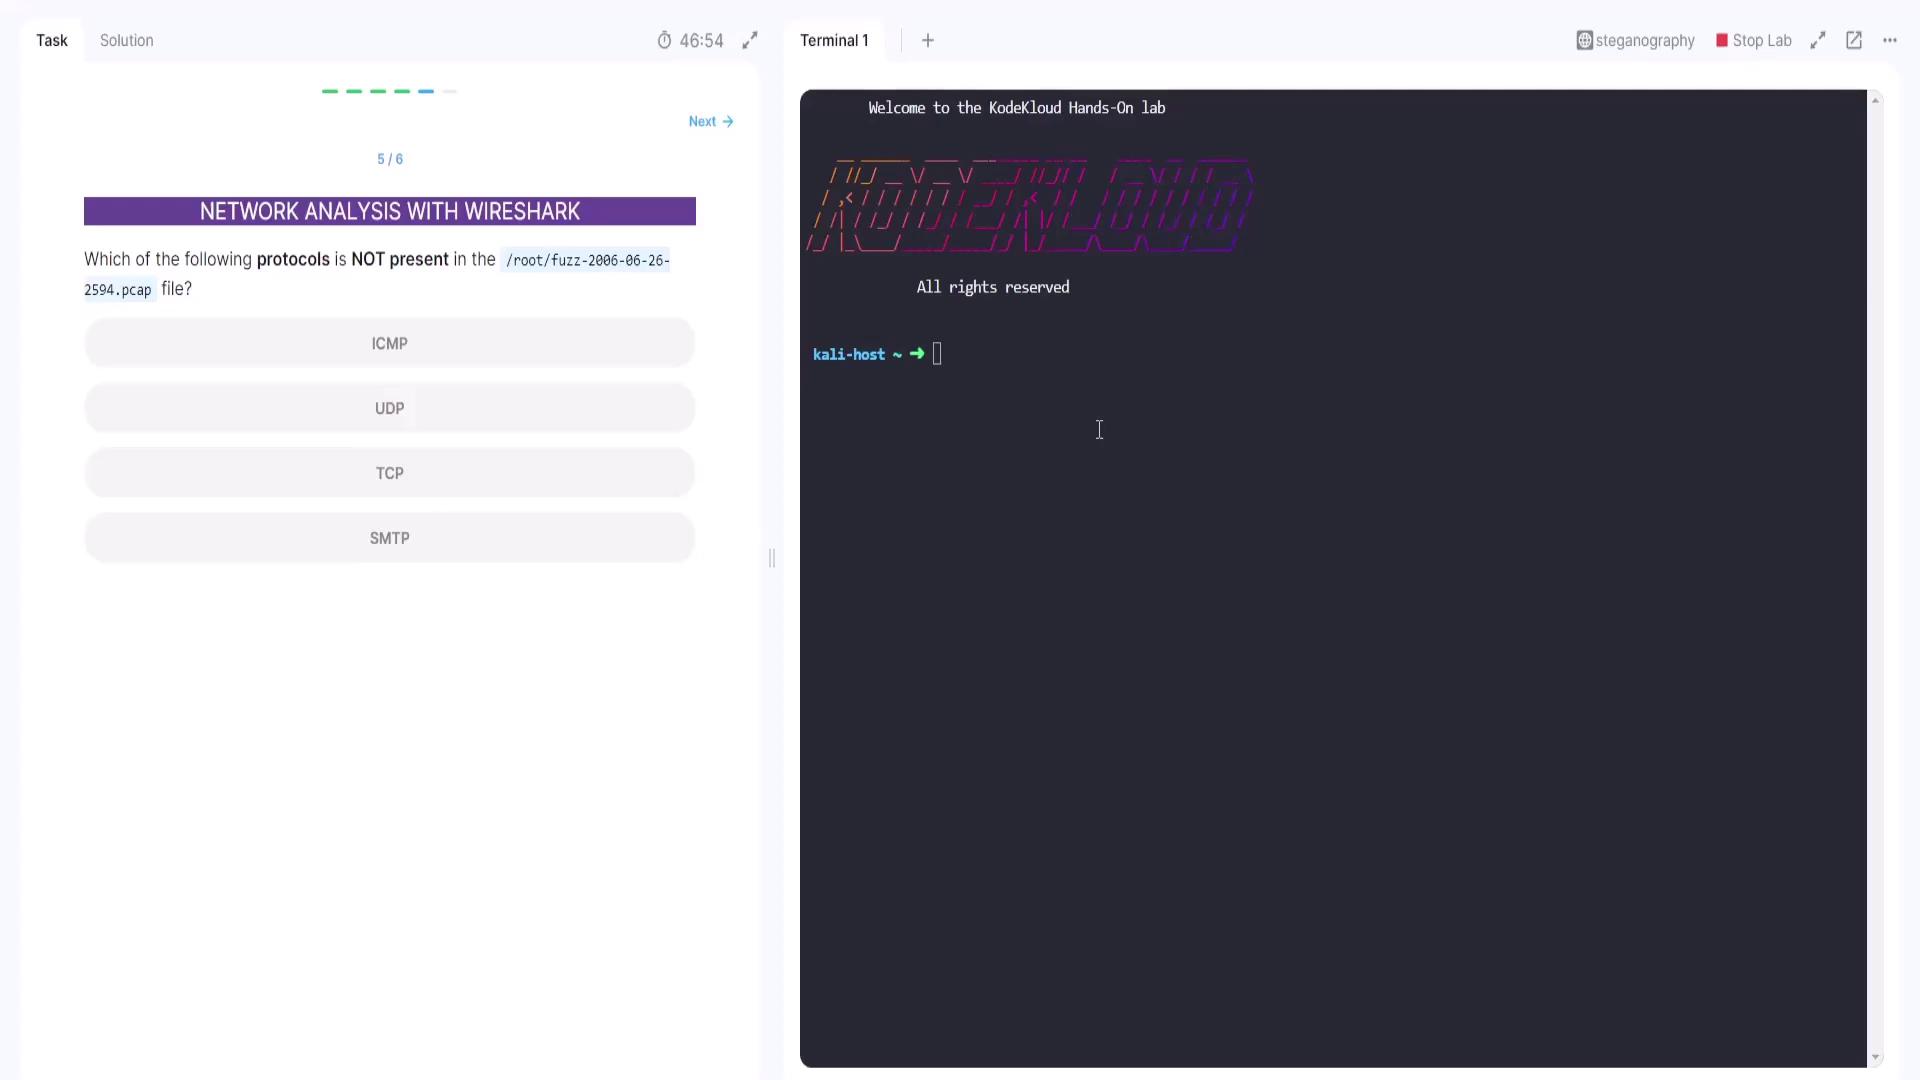
This question presents a hands-on lab challenge regarding protocols present in a capture file.You have a capture file (ending with .pcap) on the Kali host and a terminal window open. Your task is to analyze the file and identify which protocol is absent from the capture. The options provided are:
ICMP
UDP
TCP
SMTP
Since you’re using a Linux terminal, Tshark is the tool of choice for this analysis. To get started, check the usage of Tshark with the following syntax:
Next, read the capture file (e.g., fuzz-2006-06-26-2594.pcap) using Tshark:
tshark -r fuzz-2006-06-26-2594.pcap
To reduce the amount of output, use the -q option:
tshark -r fuzz-2006-06-26-2594.pcap -q
Then, to display protocol hierarchy statistics without listing every packet, add the -z io,phs switch:
tshark -r fuzz-2006-06-26-2594.pcap -q -z io,phs
If you encounter an error due to a minor misspelling of the file name (for instance, missing a zero), correct the filename exactly as provided (i.e., fuzz-2006-06-26-2594.pcap) and run the command again. The resulting output will display various protocol statistics. By comparing the available protocols (ICMP, UDP, TCP, SMTP), it becomes evident that SMTP is not present.
Question 6: Determining the IP Address with the Highest Traffic
The final question of our demo is:Which IP address has the highest amount of traffic in the Wireshark capture?To answer this, begin by analyzing overall protocol statistics from the capture file using Tshark:
This output provides details such as frame counts and byte counts for various protocols, similar to:
Running as user "root" and group "root". This could be dangerous.Protocol Hierarchy StatisticsFilter:eth frames:691 bytes:99997ip frames:613 bytes:92457udp frames:52 bytes:82530nbns frames:102 bytes:9384dns frames:21 bytes:1932...
For detailed analysis of traffic by individual IP addresses, execute the command with the ip_hosts,tree option:
This command generates statistics for each IP address seen in the capture file. From the detailed output, you should notice that the IP address 192.168.1.2 shows the highest traffic count.A sample output may resemble:
kali-host ~ % tshark -r fuzz-2006-06-26-2594.pcap -q -z ip_hosts,treeRunning as user "root" and group "root". This could be dangerous.IPv4 Statistics/All Addresses:Topic / Item Count Average Min Val Max Val Rate (ms) Percent Burst Rate Burst StartAll Addresses 606192.168.1.2 527 0.0004 100% 0.3000 94.154192.168.1.1 306 0.0003 86.96% 0.2500 94.154192.168.1.255 102 0.0001 56.50% 0.2300 525.361212.242.33.35 72 0.0001 16.84% 0.2300 1116.969147.234.1.253 42 0.0000 6.93% 0.2200 94.154...67.168.1.1 1 0.0000 0.17% 0.1000 944.266192.168.1.2 1 0.0000 0.17% 0.1000 1527.872
This confirms that 192.168.1.2 is responsible for the highest amount of traffic in the capture file.
Always verify the accuracy of the capture file name and the paths provided in your lab instructions to avoid file-not-found errors.
That concludes our network analysis demo using Wireshark. Stay tuned for additional exam insights and more hands-on labs. Happy analyzing!For more information on Wireshark and network analysis best practices, consider exploring the following resources: