

Agent compatibility and integrations
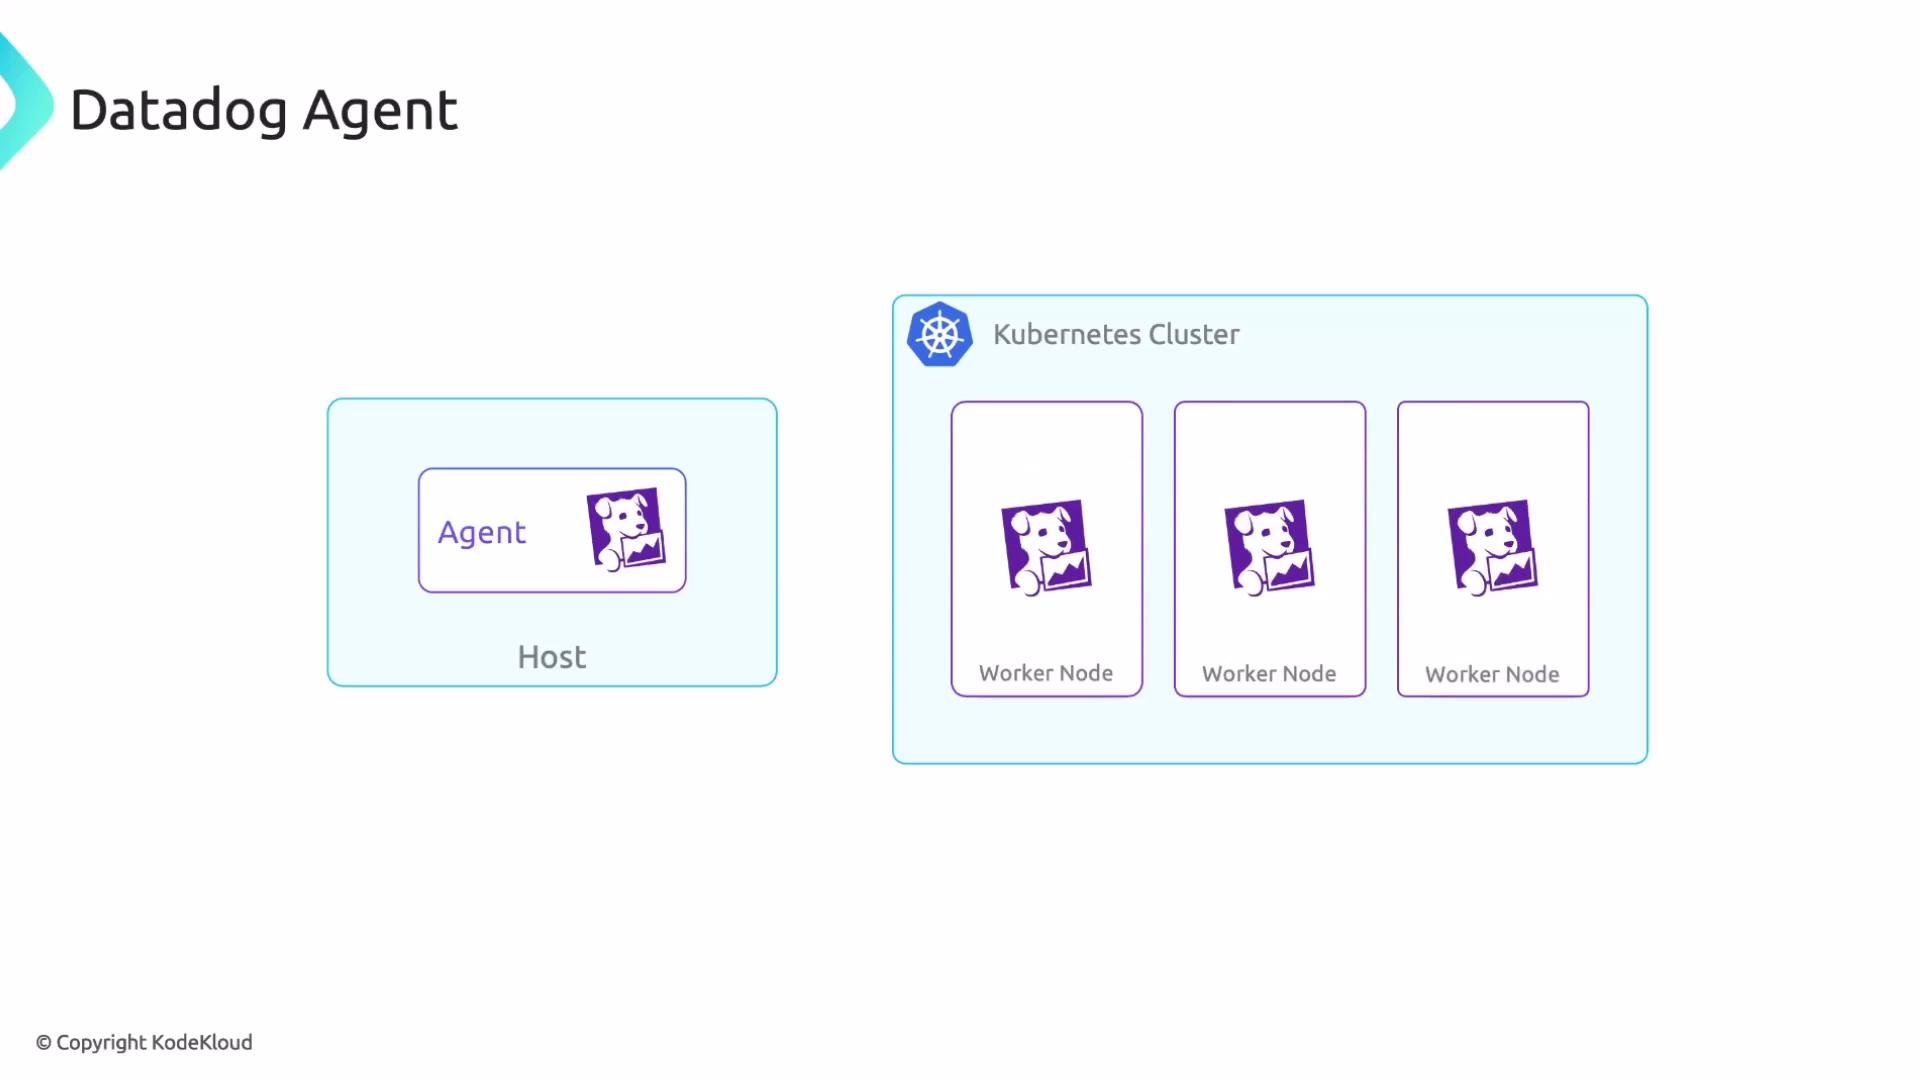
Choose the agent variant that matches the environment where it will run. For example, use the Kubernetes DaemonSet-based Datadog Agent for an EKS cluster (to collect node- and pod-level telemetry) rather than a host-only Linux agent image that isn’t optimized for Kubernetes. Datadog provides built-in agent integrations for many common platforms and distributions such as Kubernetes, Ubuntu, Docker, Fedora, Red Hat Enterprise Linux, Debian, and SUSE. These integrations simplify setup and enable collection of platform-specific metrics and metadata.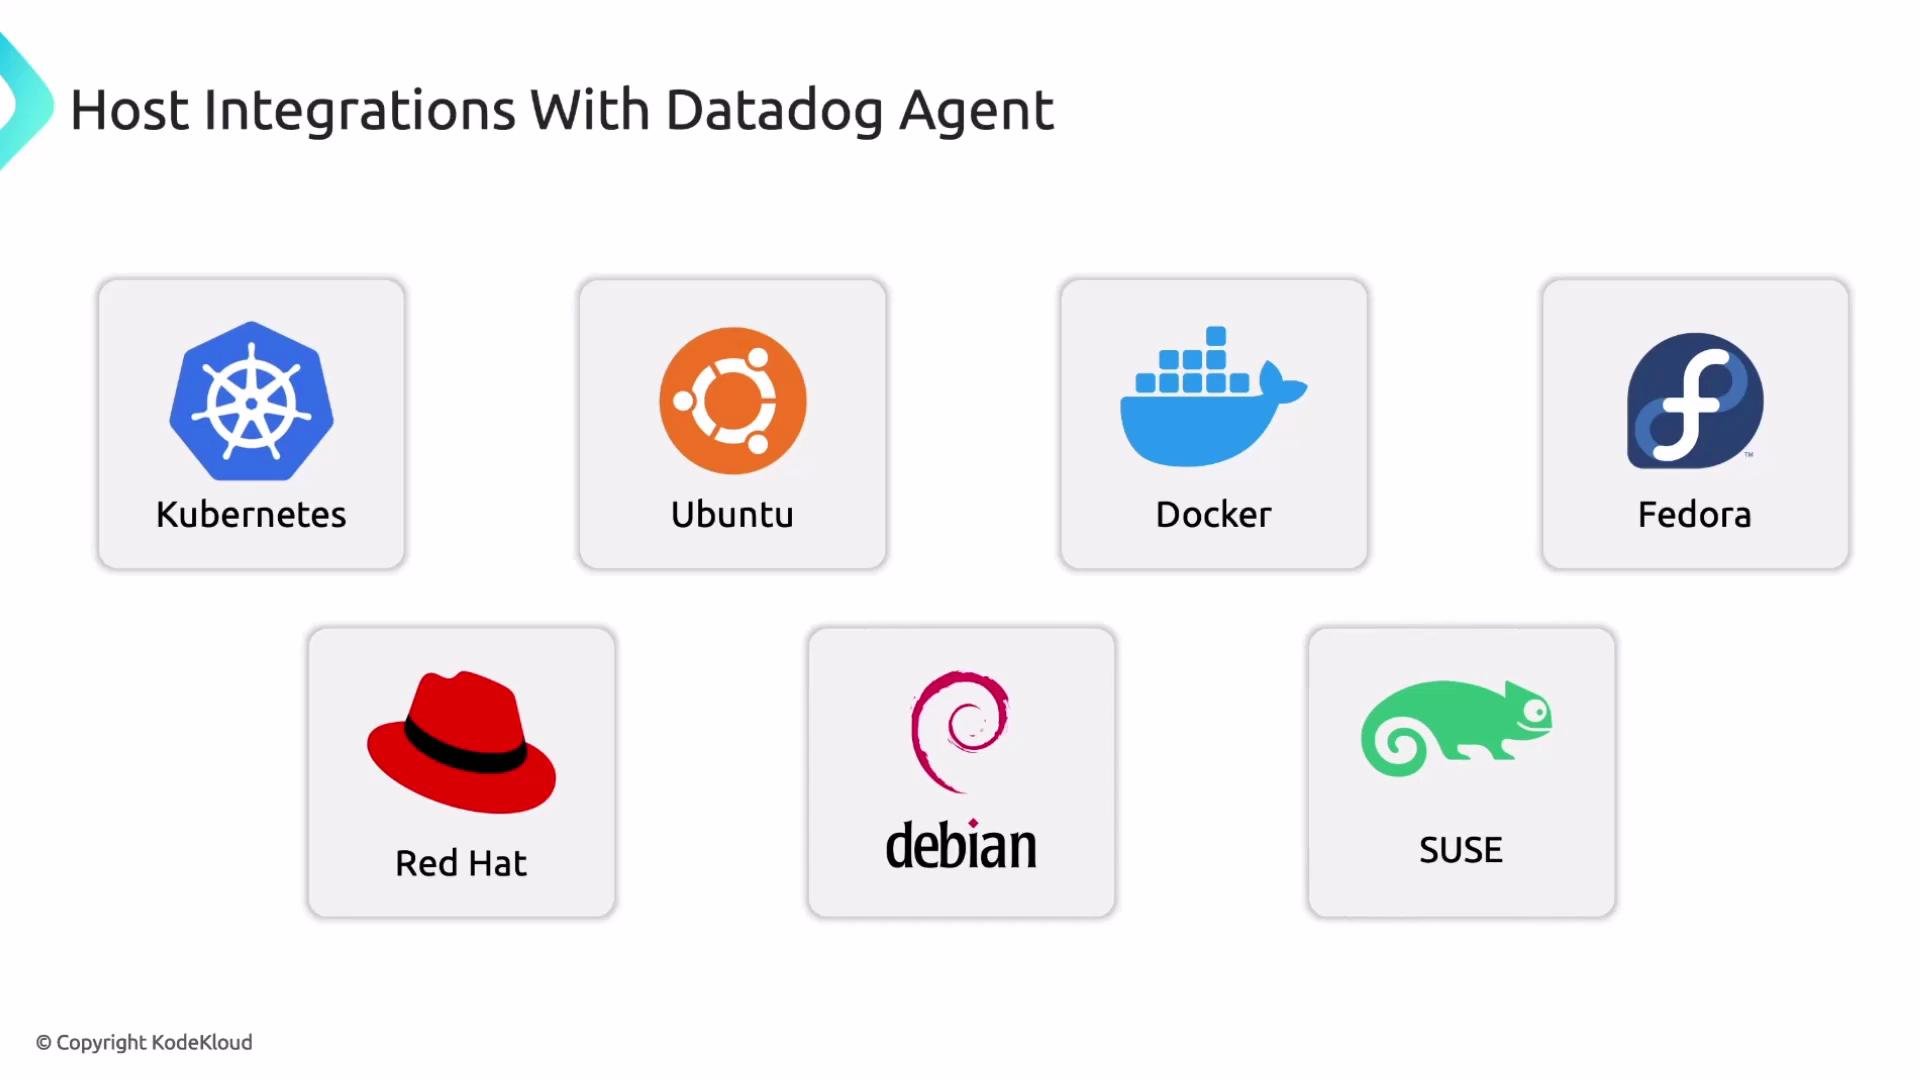
Prerequisites: API key and authentication
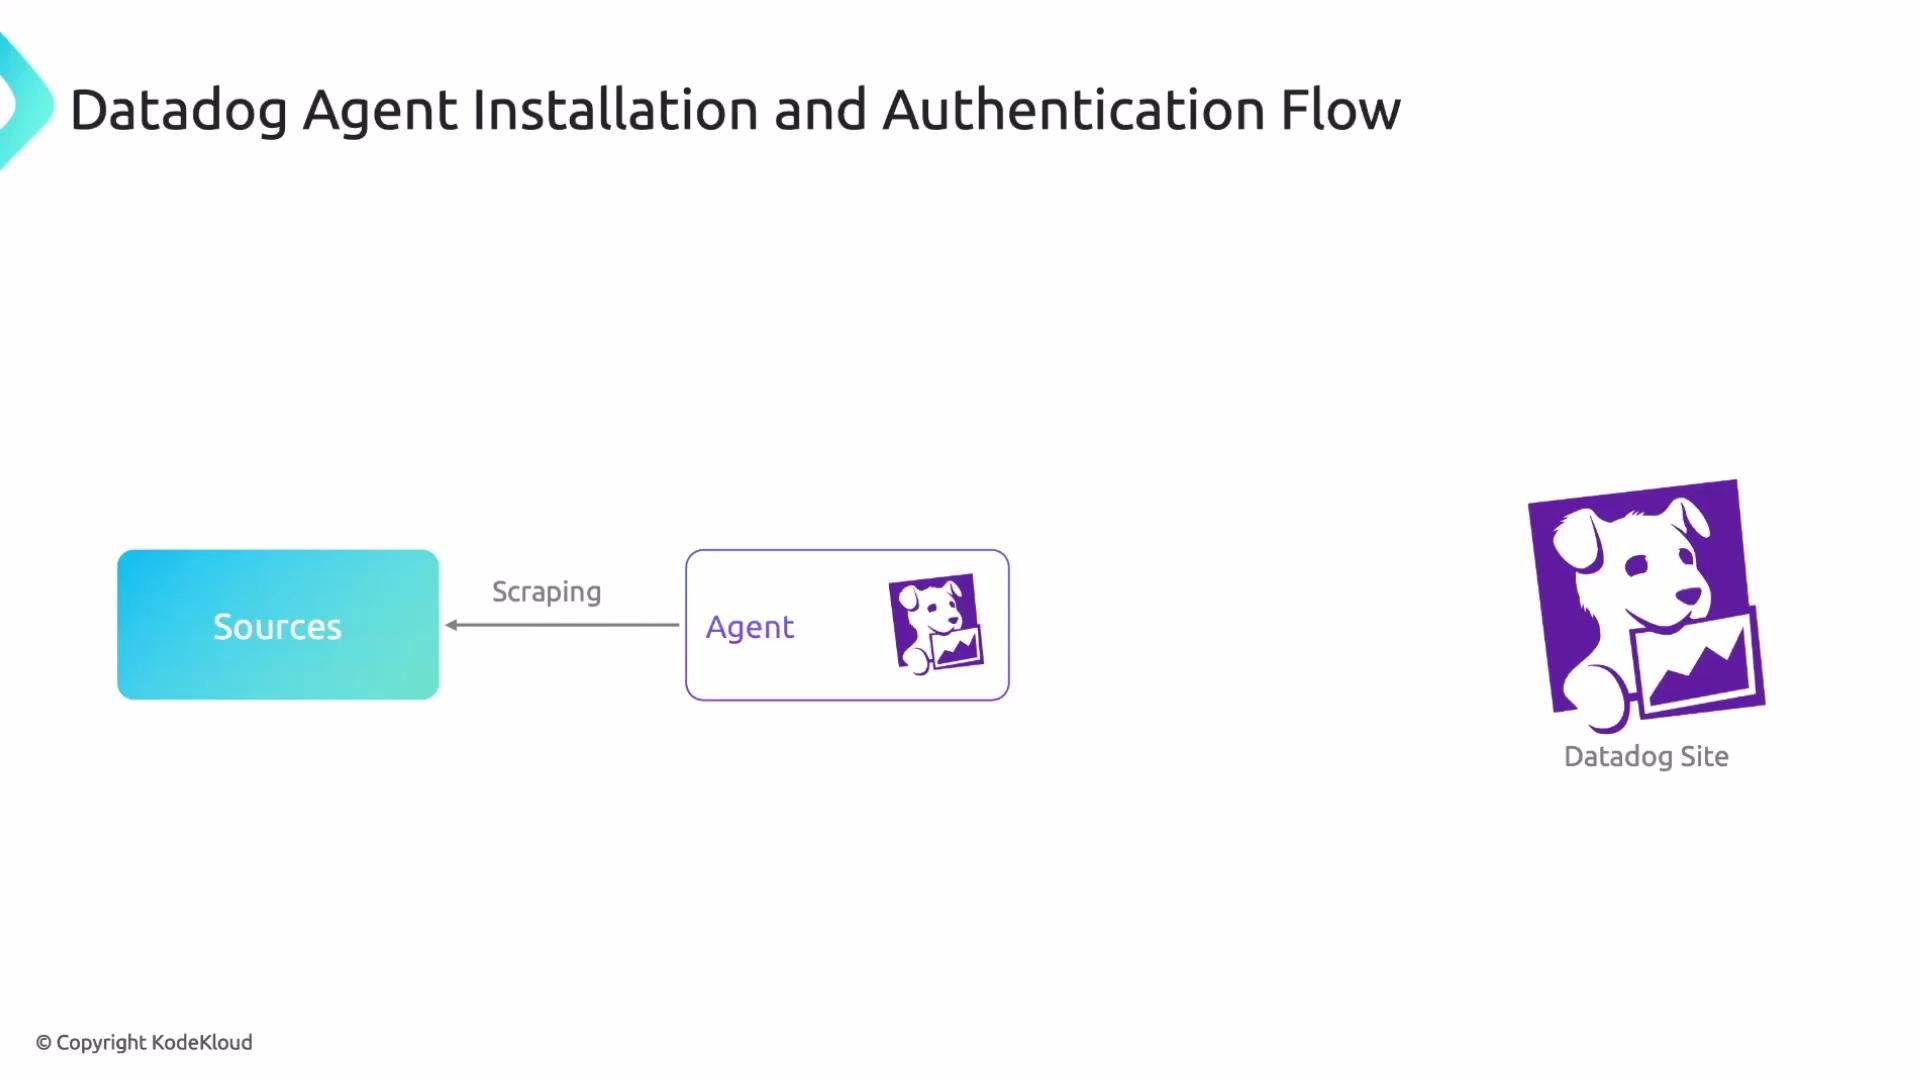
Before installing or configuring an agent you must generate a Datadog API key in the Datadog console. The agent uses this key to authenticate requests to the Datadog backend; telemetry data is accepted only after successful authentication.Keep your Datadog API key secret. Do not commit it to source control; store it in a secrets manager or environment variables instead.
Installing the agent on Linux hosts
On Linux, select the installation instructions that match your distribution (for example, Ubuntu or RHEL) and follow the distro-specific steps in the Datadog docs. After installing and configuring the agent (including setting the API key and enabling any integrations), the agent starts sending telemetry to Datadog.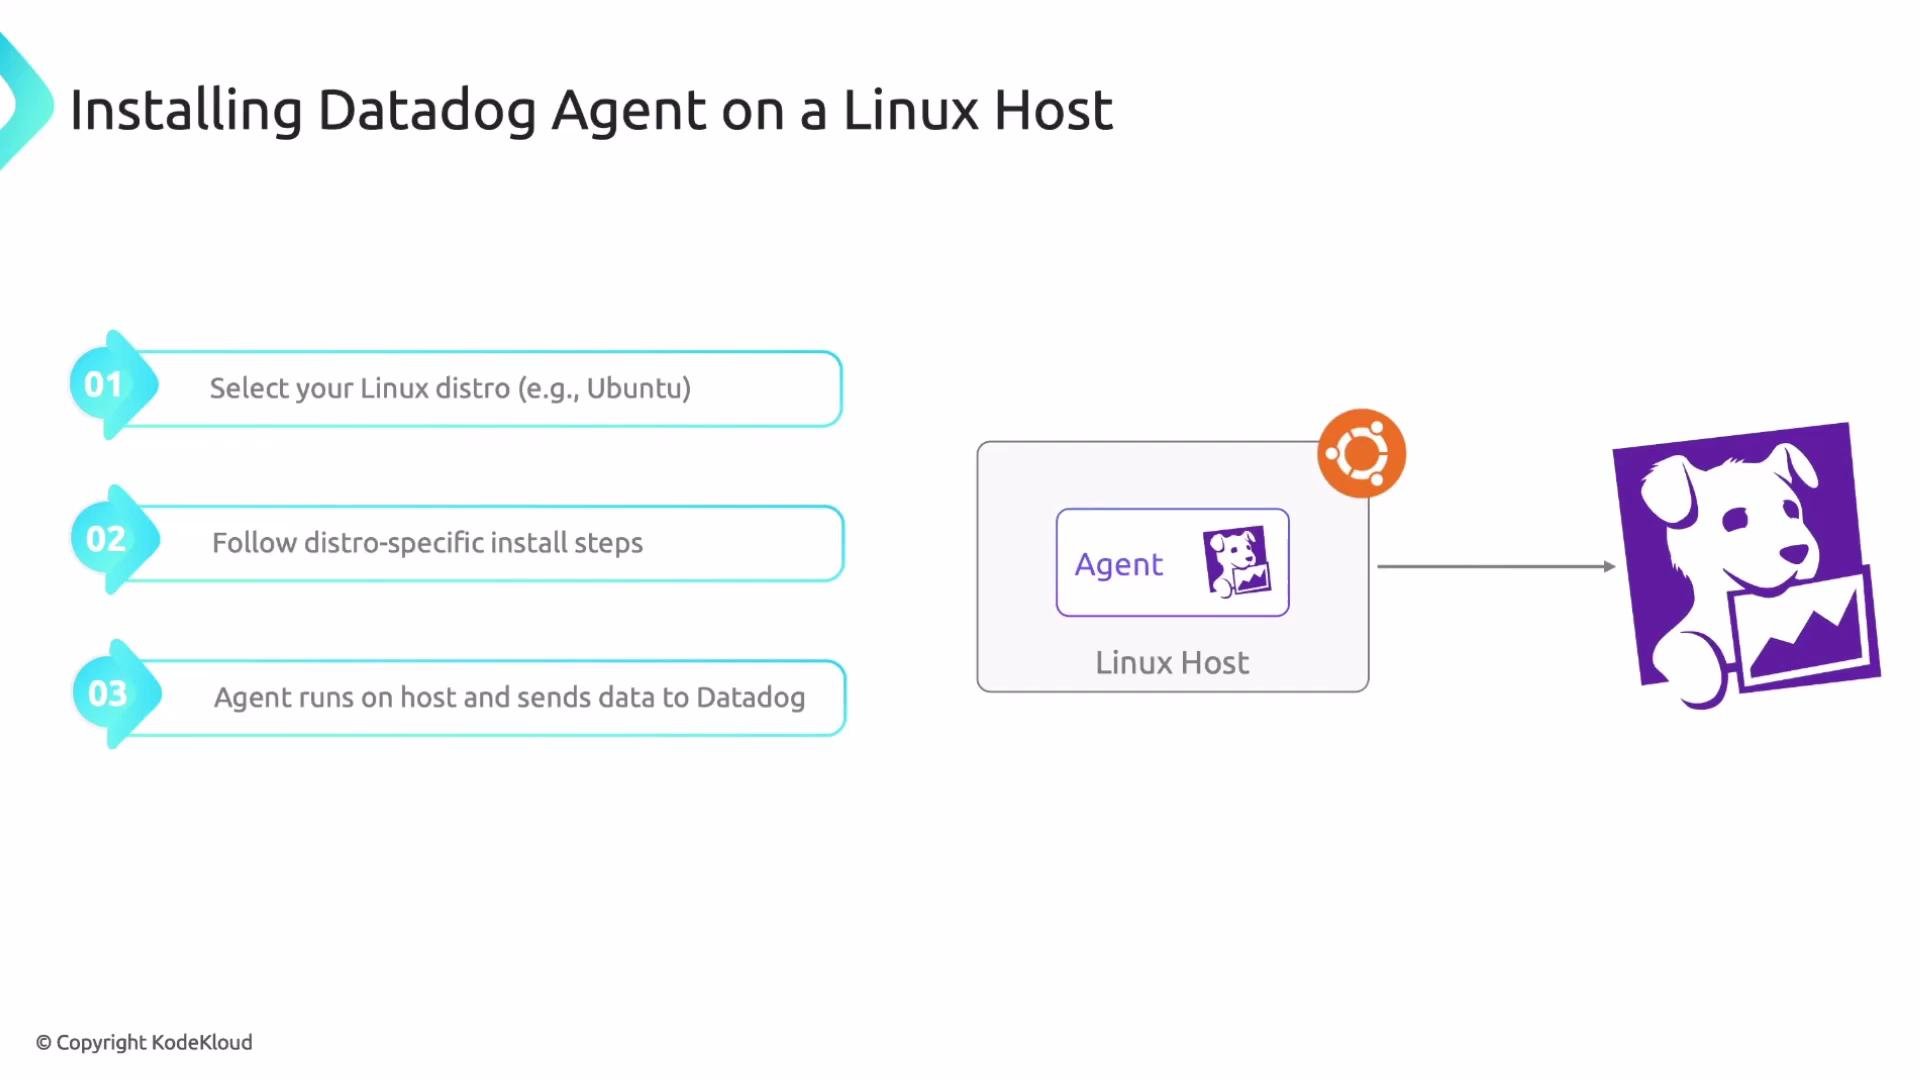
Datadog Agents in Kubernetes
In Kubernetes environments there are two complementary agent types:
Each agent has distinct responsibilities; configure both so you get complete telemetry coverage (cluster-level and node/pod-level).
Ensure the Cluster Agent has sufficient replicas for your cluster size and telemetry volume. Underprovisioning can overload instances; overprovisioning wastes resources. Monitor resource usage and scale replicas accordingly.
Troubleshooting and debugging tools
Datadog agents include built-in debugging tools you can run inside the agent container (or on the host) to inspect configuration, check status, validate connectivity, and create diagnostic bundles for Datadog Support. Common steps:- Exec into a Datadog agent container (adjust namespace and selector to match your deployment):
- Check agent status:
- Generate a diagnostic bundle (flare) for Datadog support:
Summary and next steps
- Datadog Agents run on hosts or in Kubernetes to collect metrics, traces, and logs, and forward them to Datadog.
- Choose the correct agent variant for your environment (Linux distro vs Kubernetes DaemonSet/Deployment).
- Keep your API key secure and follow Datadog’s distro-specific installation steps.
- Use the built-in debugging commands to validate agent status and create diagnostic bundles when needed.
- Datadog Agent documentation: https://docs.datadoghq.com/agent/
- Datadog console (API keys): https://app.datadoghq.com/account/settings#api