Welcome to the Datadog data ingestion lesson from the Datadog migration course at KodeKloud. This guide explains how Datadog collects and sends telemetry from your environment and applications to the Datadog platform. You’ll see how Datadog components are deployed to a local k3d Kubernetes cluster, how authentication is configured, how to instrument a Node.js app with tracing and logs, and how to generate traffic to observe telemetry in Datadog (metrics, logs, traces, and profiling). Key topics covered:
  • Datadog Kubernetes UI overview
  • Local k3d environment (k3s running in Docker)
  • Datadog components in Kubernetes (Agent, Cluster Agent, Operator)
  • Installing Datadog via Helm and creating the API key secret
  • DatadogAgent CR example (operator-based install)
  • Instrumenting a Node.js app with dd-trace
  • Building the Docker image and deploying the app pod
  • Generating traffic with k6 and viewing logs/traces in Datadog

Datadog Infrastructure → Kubernetes Overview

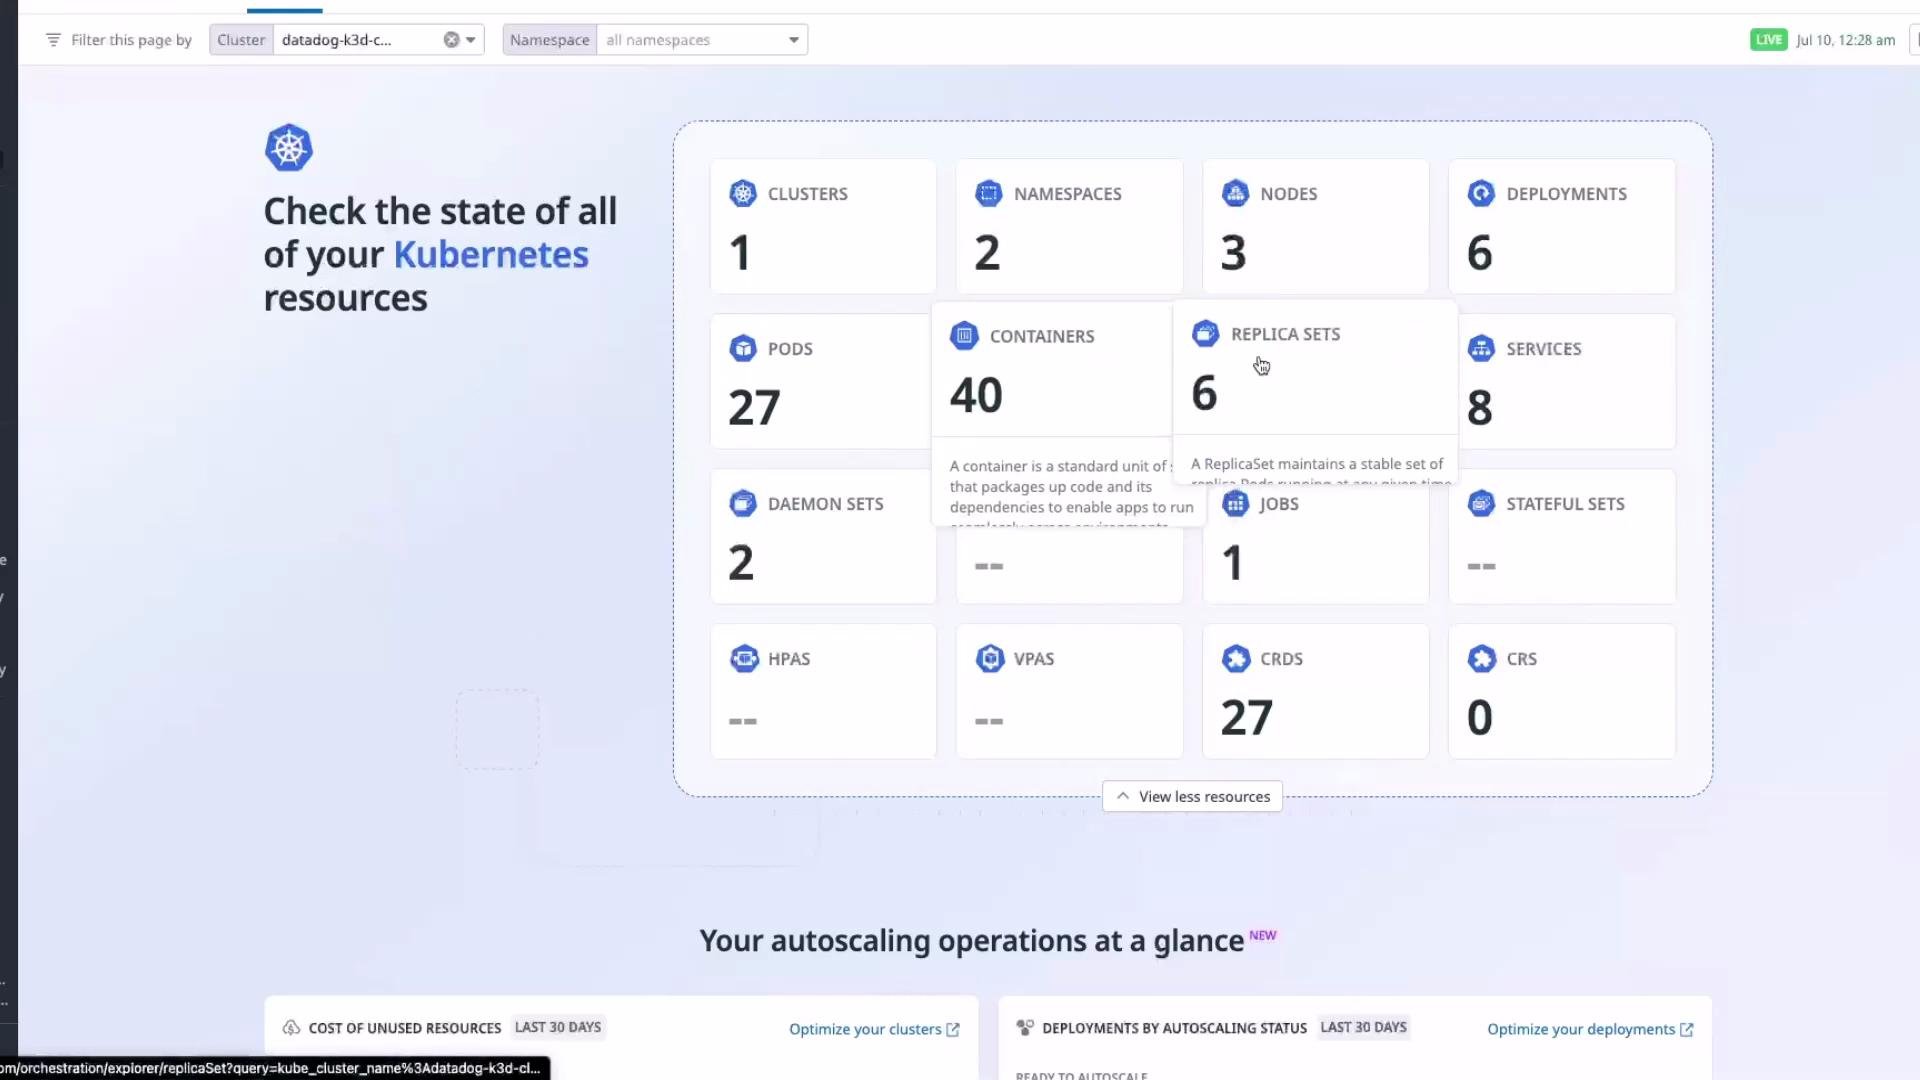
From the Datadog console (this demo uses the US5 site), the Infrastructure → Kubernetes Overview gives a concise, high-level view of connected clusters. Clicking a cluster updates dashboards to show counts for clusters, namespaces, nodes, deployments, pods, containers, ReplicaSets, and Services.
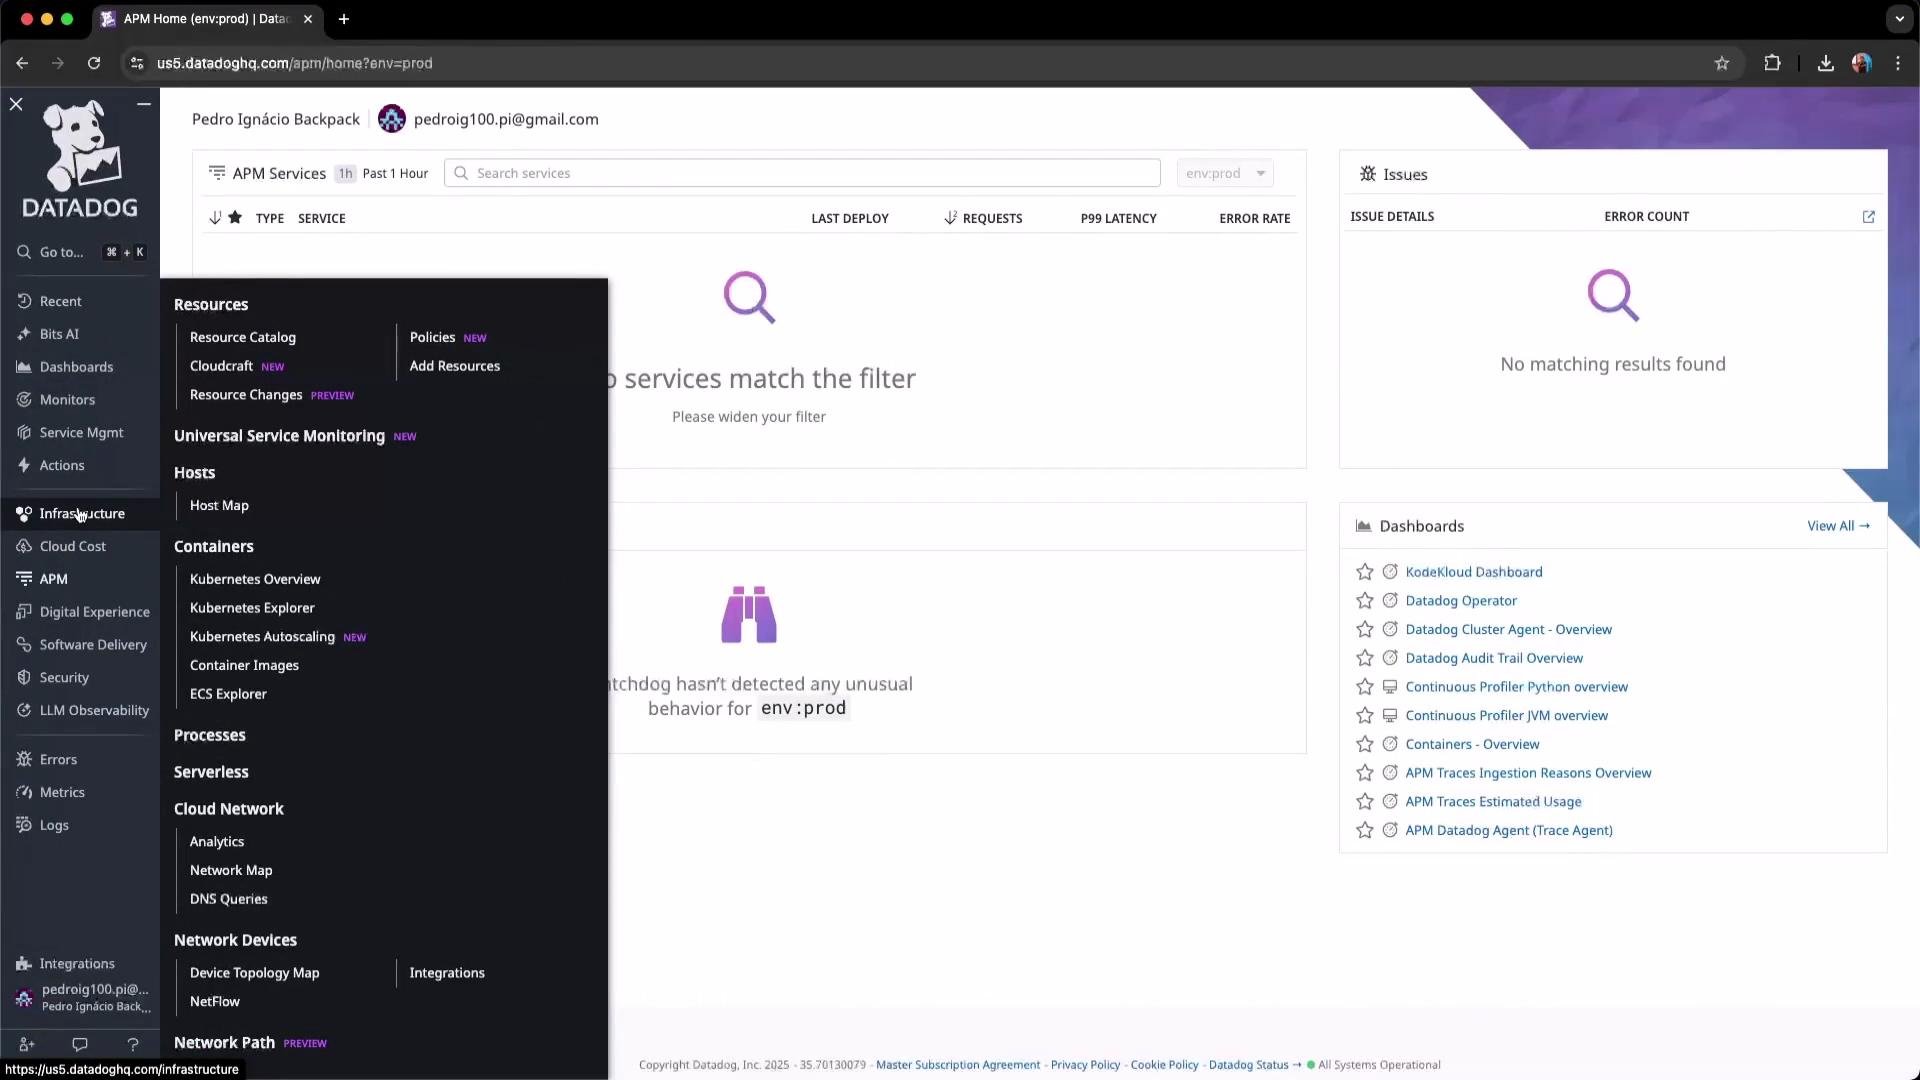
The image shows a Datadog dashboard with a menu open for infrastructure options and a main screen displaying no matches found for services and issues. Dashboard links and other features are visible on the right.
The Kubernetes overview shows useful cluster metrics and summary tiles.
The image shows a dashboard for monitoring Kubernetes resources, displaying various metrics like clusters, nodes, pods, and containers. Each section provides insights into the current state and usage of these resources.
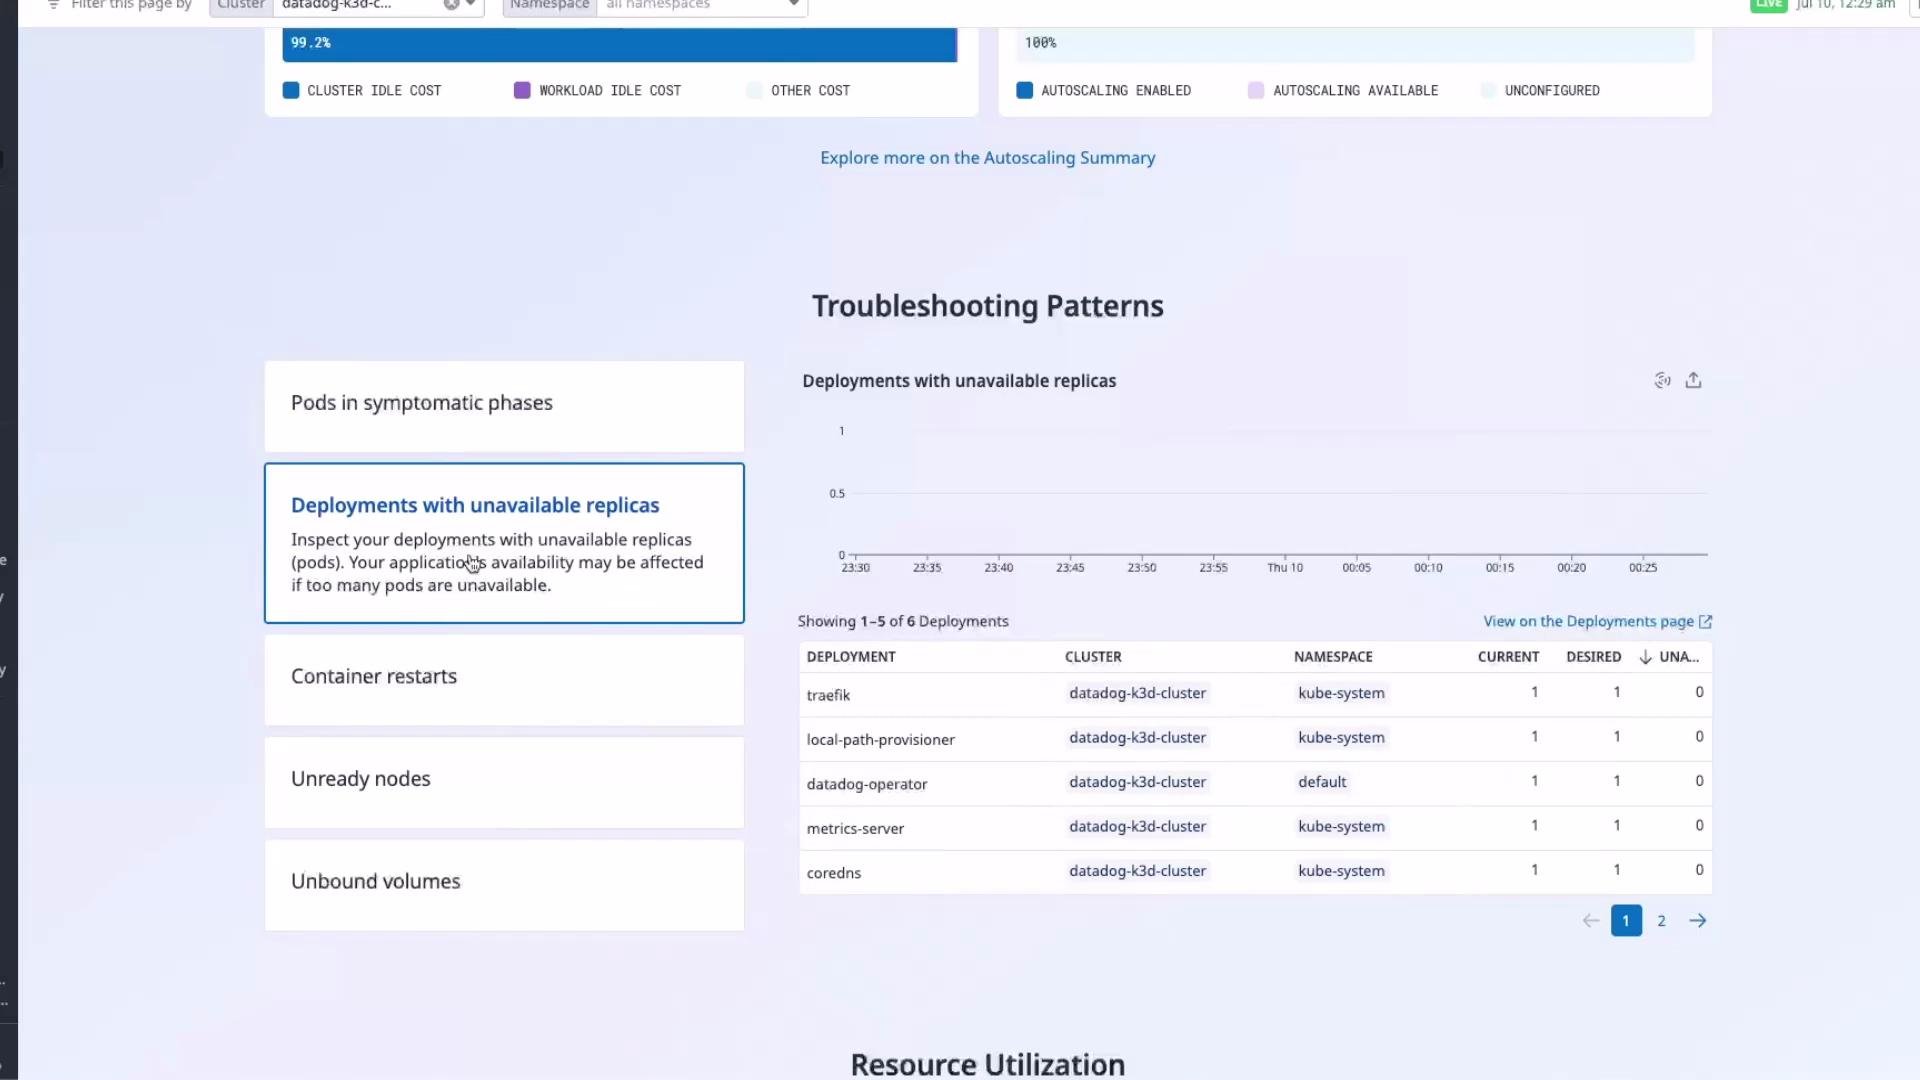
Scrolling in the Kubernetes overview surfaces FinOps insights and application troubleshooting patterns (e.g., deployments with unavailable replicas, pods in symptomatic phases, container restarts, node and volume details).
The image shows a dashboard for troubleshooting patterns in a Kubernetes environment, focusing on deployments with unavailable replicas. It includes a list of deployments, clusters, namespaces, and their current status.
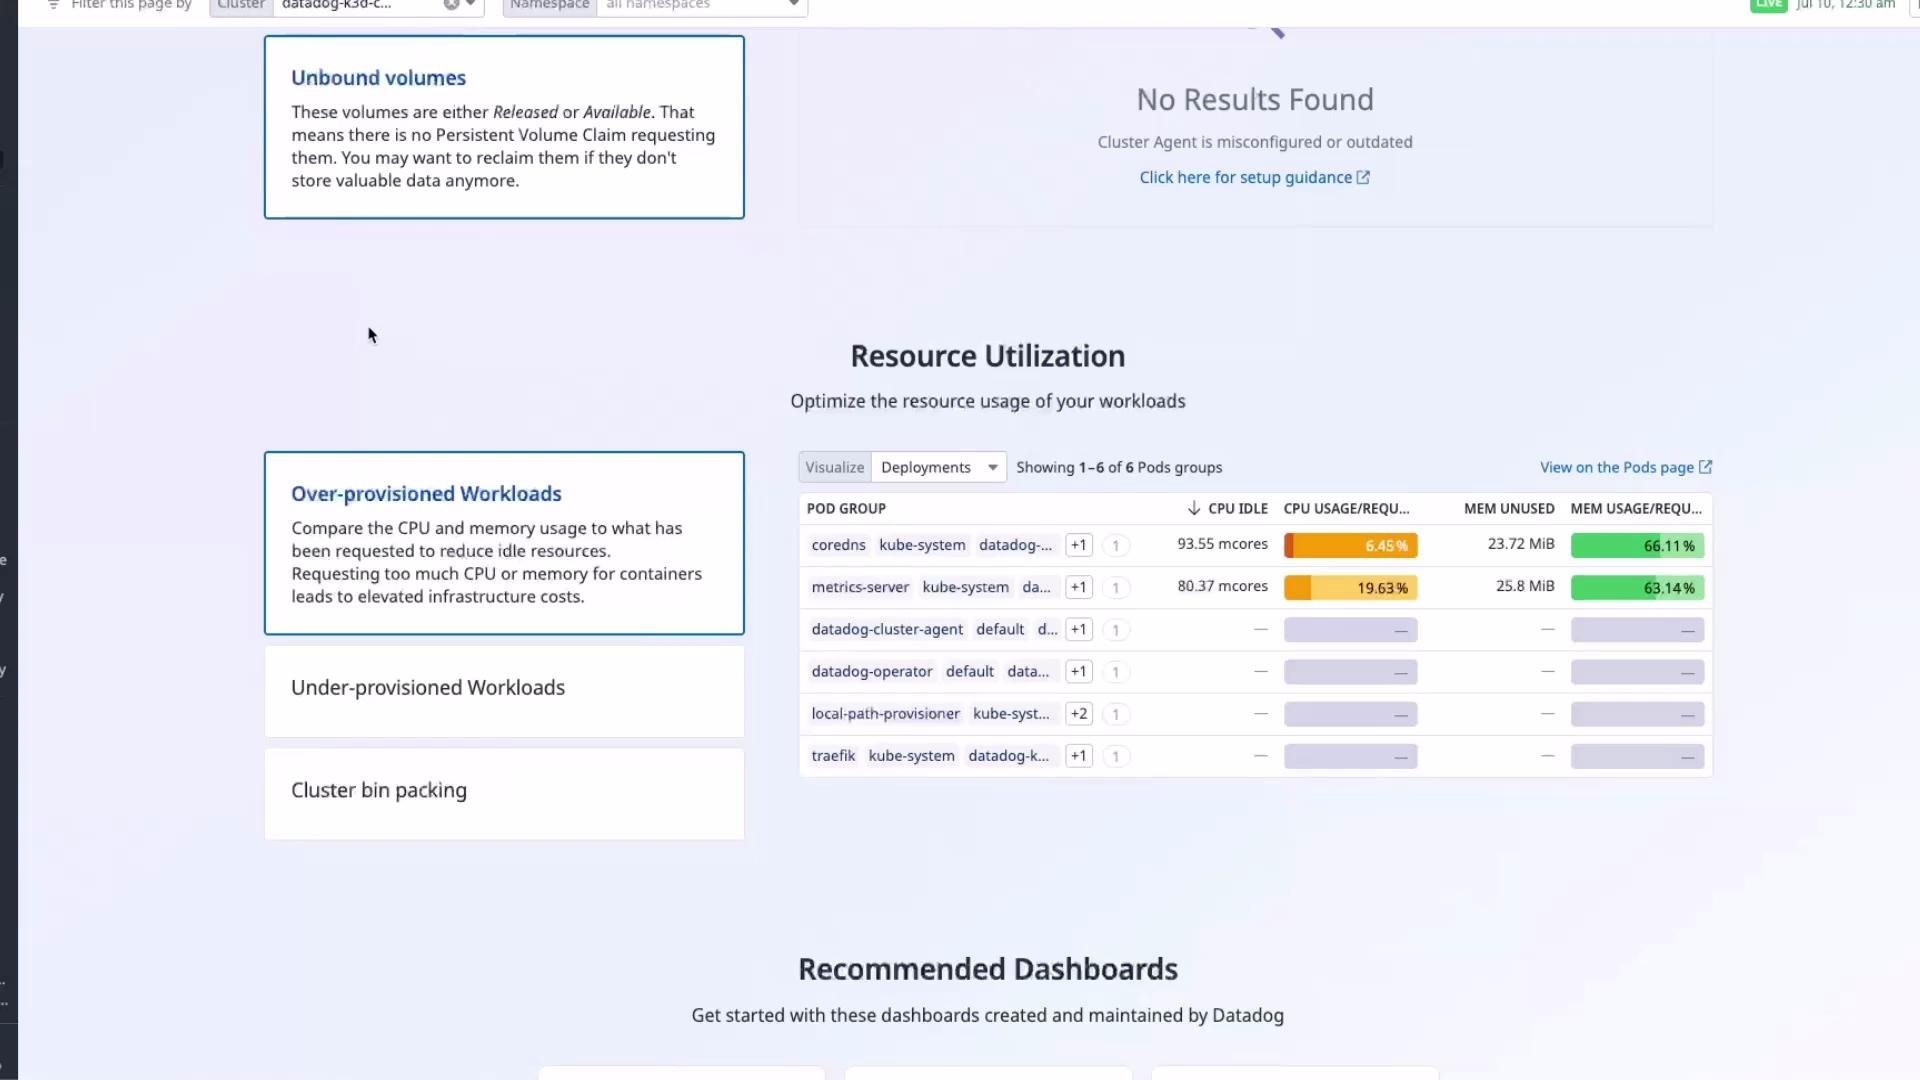
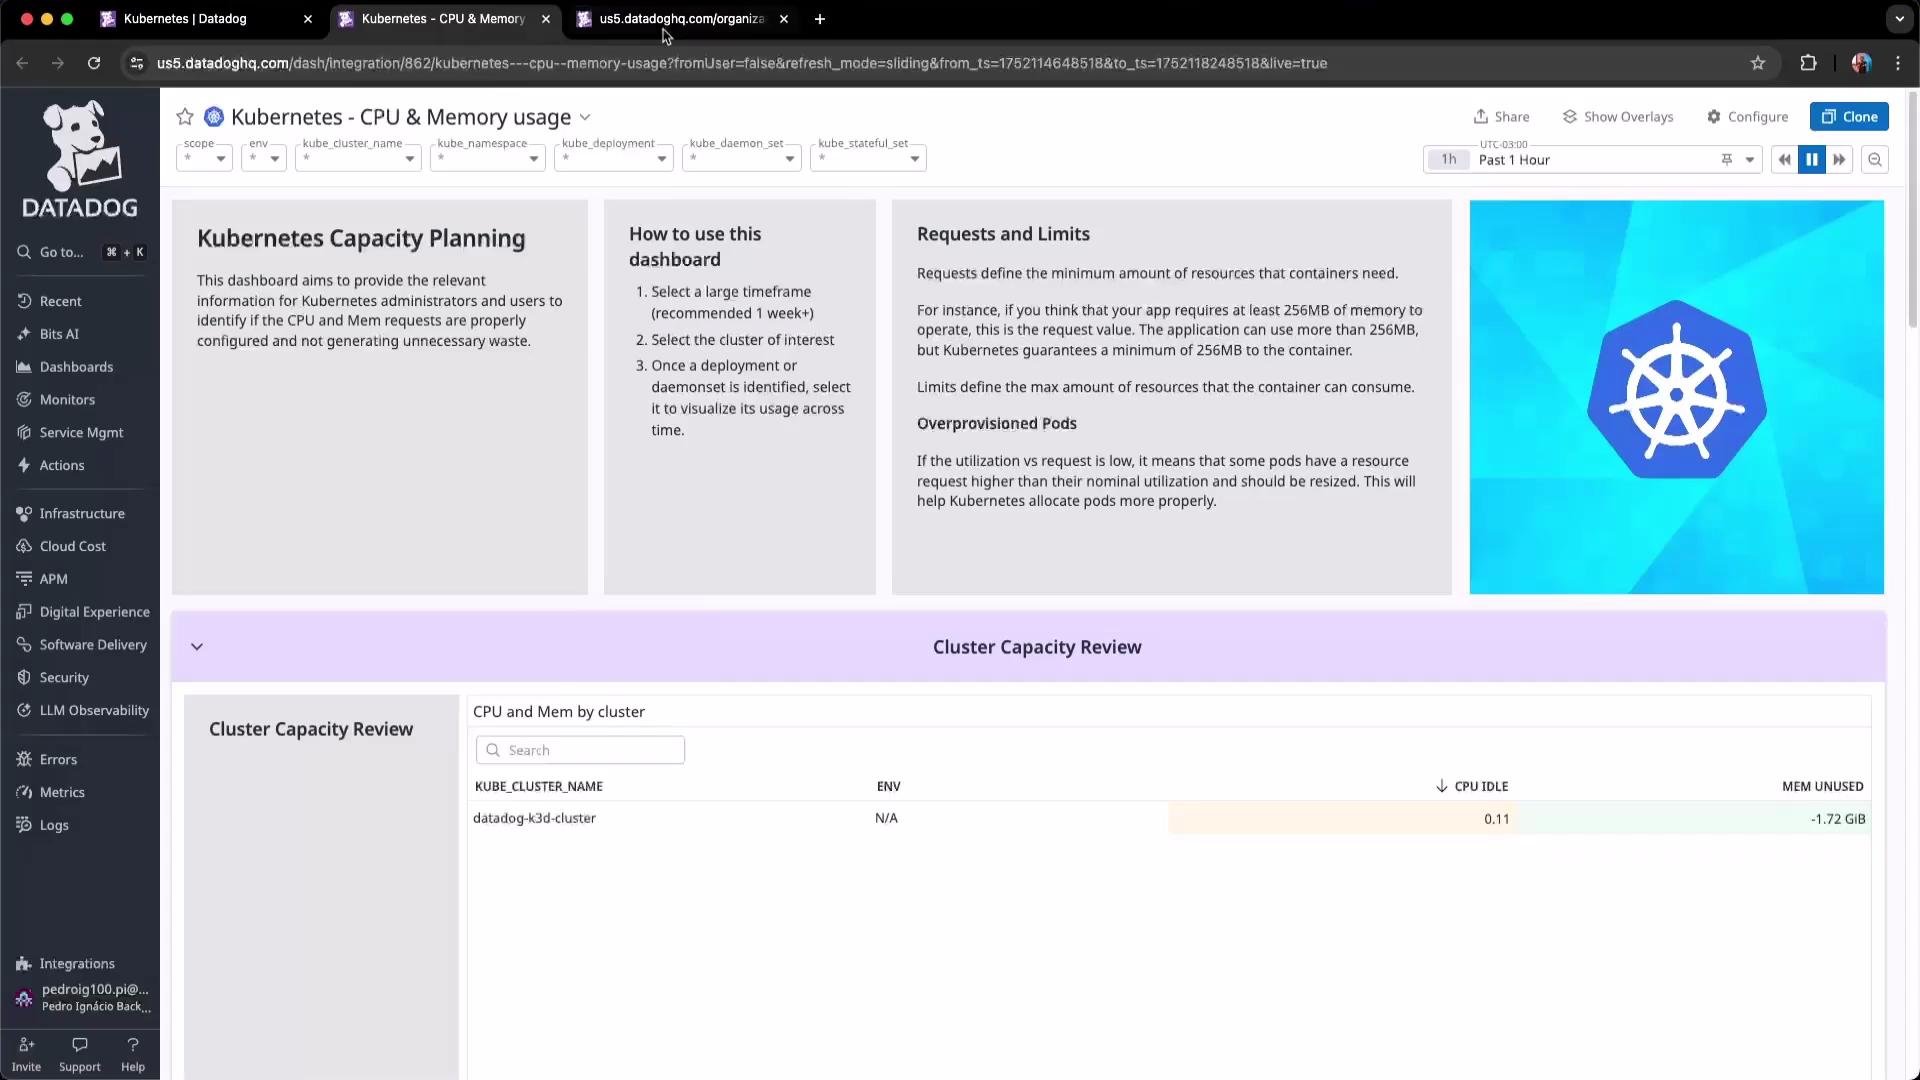
Resource utilization dashboards help with capacity planning — CPU/memory usage, over-provisioned workloads, unbound volumes, and recommended dashboards.
The image shows a dashboard interface displaying resource utilization metrics for various pod groups, including CPU and memory usage. It includes sections for unbound volumes, over-provisioned workloads, and recommended dashboards.

Local lab environment — k3d (k3s in Docker)

This demo uses k3d, a lightweight tool that runs k3s inside Docker. Each k3d node is a Docker container, so docker ps (or k3d docker ps) shows Kubernetes nodes as containers. Example k3d help summary:
# Example k3d help summary
k3d --help
# Available Commands (examples)
#   cluster   Manage cluster(s)
#   node      Manage node(s)
#   image     Handle container images
#   version   Show k3d and default k3s version
Example docker ps output for a k3d cluster:
CONTAINER ID   IMAGE                                    COMMAND                  CREATED         STATUS         PORTS                    NAMES
460856a03c1    ghcr.io/k3d-io/k3d-tools:5.8.3          "/app/k3d-tools noop"    12 minutes ago  Up 12 minutes  0.0.0.0:52149->6443/tcp  k3d-datadog-cluster-tools
82f4a878a850    ghcr.io/k3d-io/k3d-proxy:5.8.3          "/bin/sh -c nginx-pr…"   4 days ago      Up 12 minutes  0.0.0.0:52148->80/tcp    k3d-datadog-cluster-serverlb
c73a12740bec    rancher/k3s:v1.31.5-k3s1                 "/bin/k3d-entrypoint…"   4 days ago      Up 12 minutes  0.0.0.0:52147->6443/tcp  k3d-datadog-cluster-agent-1
754962cb41     rancher/k3s:v1.31.5-k3s1                 "/bin/k3d-entrypoint…"   4 days ago      Up 12 minutes  0.0.0.0:52146->6443/tcp  k3d-datadog-cluster-agent-0
ce256fc721     rancher/k3s:v1.31.5-k3s1                 "/bin/k3d-entrypoint…"   4 days ago      Up 12 minutes  0.0.0.0:52145->6443/tcp  k3d-datadog-cluster-server-0
From inside the cluster, use kubectl to list nodes and pods:
kubectl get nodes
# NAME                             STATUS   ROLES                  AGE    VERSION
# k3d-datadog-cluster-agent-0      Ready    <none>                4d7h   v1.31.5+k3s1
# k3d-datadog-cluster-agent-1      Ready    <none>                4d7h   v1.31.5+k3s1
# k3d-datadog-cluster-server-0     Ready    control-plane,master   4d7h   v1.31.5+k3s1
kubectl get pods
# NAME                                      READY   STATUS    RESTARTS   AGE
# app-1                                     1/1     Running   2          13m
# datadog-agent-g5fd5                       2/2     Running   0          12m
# datadog-agent-xm9t                        2/2     Running   0          11m
# datadog-cluster-agent-79b5c775bb-rtcnf    2/2     Running   1          11m
# datadog-operator-6c9b7978f-r24mx          1/1     Running   1          13m

Datadog components in Kubernetes

Common Datadog components deployed in Kubernetes (installed via Helm or Operator):
ComponentPurposeNotes / Example
datadog-agent (DaemonSet)Runs on every node to collect host & container metrics, logs, traces, and profilesDeployed as a DaemonSet to ensure per-node collection
datadog-cluster-agent (Deployment)Cluster-level aggregator and API for cluster features (cluster checks, orchestrator metadata)Scale based on cluster size
datadog-operator (Deployment)Reconciles Datadog custom resources when using the OperatorPresent only if operator-based install is used
Verify daemonsets and deployments:
kubectl get daemonsets
# NAME          DESIRED   CURRENT   READY   UP-TO-DATE   AVAILABLE   AGE
# datadog-agent 3         3         3       3            3           4d7h
kubectl get deployment
# NAME                   READY   UP-TO-DATE   AVAILABLE   AGE
# datadog-cluster-agent  1/1     1            1           4d7h
# datadog-operator       1/1     1            1           4d7h

Installing Datadog via Helm

Add the Datadog Helm repo and install the chart:
helm repo add datadog https://helm.datadoghq.com
helm repo update
helm install datadog datadog/datadog
You can install the chart either before or after creating the Kubernetes secret that contains the Datadog API key, but the Agent requires credentials to authenticate and send telemetry.

API keys and Kubernetes secrets

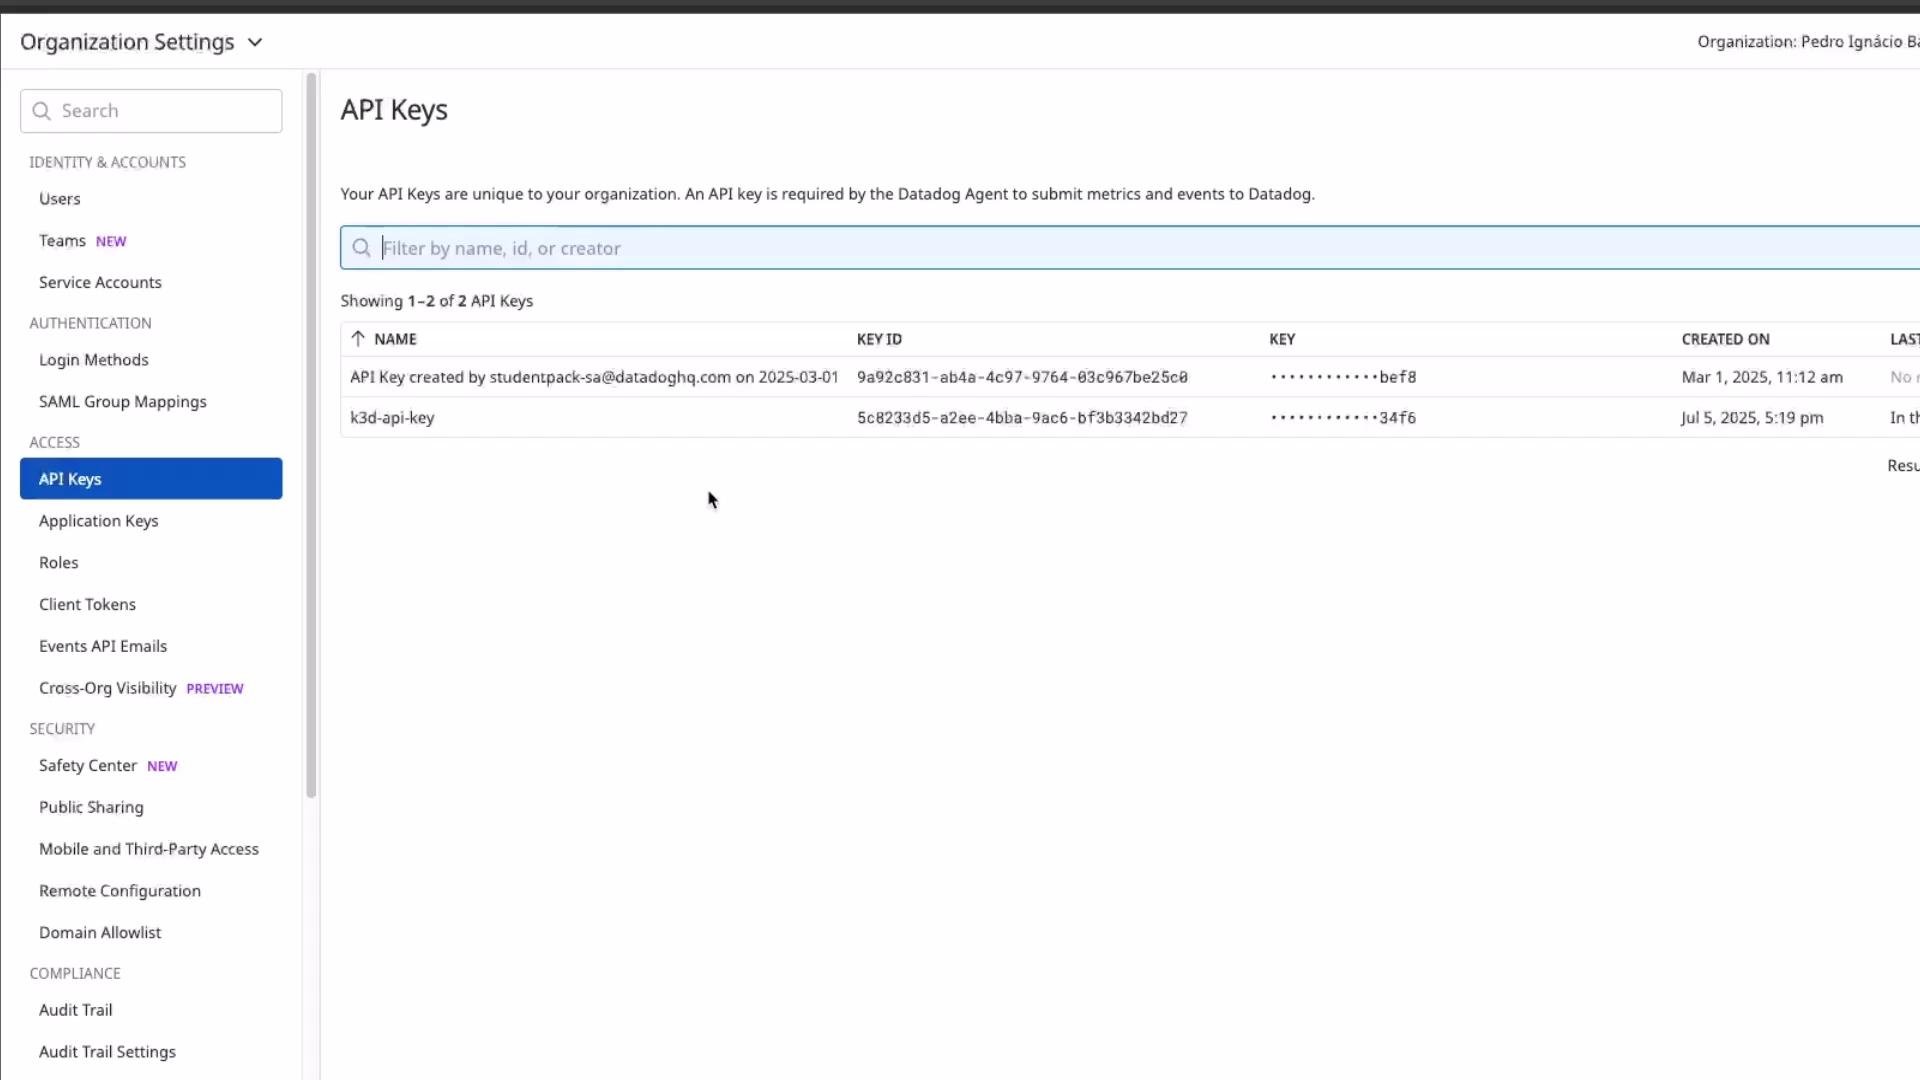
Create an API key in the Datadog web UI (Organization Settings → API keys). Store the key in a Kubernetes secret for the Agent to use:
kubectl create secret generic datadog-secret --from-literal=api-key='<DATADOG_API_KEY>'
Replace <DATADOG_API_KEY> with the key you copied from Datadog. Verify the secret exists:
kubectl get secrets
# NAME            TYPE     DATA   AGE
kubectl describe secret datadog-secret
# Name:         datadog-secret
# Namespace:    default
# Type:         Opaque
# Data
# ====
# api-key: 32 bytes
Datadog UI views for API keys and cluster dashboards:
The image shows a Datadog dashboard displaying the state of Kubernetes resources, including clusters, namespaces, nodes, and other metrics, alongside information on autoscaling operations and resource costs.
The image shows a screen from an application under "Organization Settings," specifically displaying a list of API keys along with their details such as name, key ID, creation date, and last used date.

DatadogAgent (Operator) example

When using the Datadog Operator, the DatadogAgent CR references the secret with the API key. Example DatadogAgent manifest:
apiVersion: datadoghq.com/v1alpha1
kind: DatadogAgent
metadata:
  name: datadog
spec:
  global:
    clusterName: datadog-k3d-cluster
    site: us5.datadoghq.com
  credentials:
    secret:
      secretName: datadog-secret
      keyName: api-key
  features:
    orchestratorExplorer:
      enabled: true
    logCollection:
      enabled: true
      containerCollectAll: true
    apm:
      enabled: true
      unixDomainSocketConfig:
        path: /var/run/datadog/apm.socket # default
Important fields:
  • clusterName — how the cluster will appear in Datadog.
  • site — Datadog site/region (e.g., us5.datadoghq.com).
  • credentials.secret — Kubernetes secret name/key that contains the API key.
  • features — enable orchestratorExplorer, logCollection, apm, and profiling.
Apply the DatadogAgent manifest:
kubectl apply -f datadog-agent.yaml
If the Agents start without a valid secret or with an incorrect secret reference, they will fail to authenticate. Use kubectl logs on the Agent pods to diagnose authentication errors.
Ensure the secret name and key in the DatadogAgent manifest match the actual Kubernetes secret. Missing or incorrect API key references will prevent the Agent from sending telemetry.

Application instrumentation (Node.js)

This demo uses a simple Node.js REST API with three routes. To enable Datadog tracing for Node.js, install dd-trace and initialize it as early as possible — before other imports or application initialization.
Always require and initialize dd-trace at the top of your application entrypoint (before requiring frameworks like express) so auto-instrumentation captures requests and internal spans.
Example index.js (tracing + basic routes):
const tracer = require('dd-trace').init();
const express = require('express');
const app = express();
const port = 80;

app.get('/', (req, res) => {
  console.log('Request received at root route');
  res.send('Hello, World!');
});

app.get('/route1', (req, res) => {
  console.error('Error simulated on route 1');
  sum();
  subtraction();
  res.send('This is route 1');
});

app.get('/route2', (req, res) => {
  console.warn('Warn log on route 2');
  subtraction();
  res.send('This is route 2');
});

app.listen(port, () => {
  console.log(`Server is running on http://localhost:${port}`);
});

function sum() {
  let a = 10;
  let b = 20;
  return a + b;
}

function subtraction() {
  let a = 20;
  let b = 10;
  return a - b;
}

Dockerfile

Make sure dd-trace is installed in the image so the tracer import resolves at runtime.
FROM node:18-alpine

# Create app directory
WORKDIR /usr/src/app

# Install app dependencies (copy package files first for layer caching)
COPY package*.json ./
RUN npm install --production && npm cache clean --force

# Install Datadog tracer
RUN npm install dd-trace

# Bundle app source
COPY . .

# Expose the port the app runs on
EXPOSE 80

# Start the app
CMD [ "node", "index.js" ]

Pod manifest (example)

The application pod example includes environment variables used by the Datadog tracer/agent and references the datadog-secret for the API key.
apiVersion: v1
kind: Pod
metadata:
  name: app-1
  labels:
    app: app-1
spec:
  containers:
    - name: app-teste-node-container
      image: pedroignacio/app-teste-node:0.2
      imagePullPolicy: Never
      ports:
        - containerPort: 80
      env:
        - name: DD_TRACE_AGENT_URL
          value: "http://datadog-agent.default.svc.cluster.local:8126"
        - name: DD_AGENT_HOST
          value: "datadog-agent.default.svc.cluster.local"
        - name: DD_TRACE_AGENT_PORT
          value: "8126"
        - name: DD_ENV
          value: "prod"
        - name: DD_SERVICE
          value: "node-app"
        - name: DD_PROFILING_ENABLED
          value: "true"
        - name: DD_PROFILING_TIMELINE_ENABLED
          value: "true"
        - name: DD_LOGS_INJECTION
          value: "true"
        - name: DD_APM_ENABLED
          value: "true"
        - name: DD_TRACE_SAMPLE_RATE
          value: "1.0"
        - name: DATADOG_API_KEY
          valueFrom:
            secretKeyRef:
              name: datadog-secret
              key: api-key
Apply the pod manifest and check pods:
kubectl apply -f trace-pod-manifest.yaml
kubectl get pods

Traffic generation with k6

Use a lightweight k6 script to exercise the Node.js routes and quickly create traces and logs. load.js:
import http from 'k6/http';
import { sleep } from 'k6';

export let options = {
  duration: '1m',
  vus: 10, // Number of virtual users
};

const endpoint1 = __ENV.ENDPOINT1 || 'http://localhost:3030/';
const endpoint2 = __ENV.ENDPOINT2 || 'http://localhost:3030/route1';
const endpoint3 = __ENV.ENDPOINT3 || 'http://localhost:3030/route2';

export default function () {
  http.get(endpoint1);
  http.get(endpoint2);
  http.get(endpoint3);
  sleep(1);
}
Run k6 (after port-forwarding or deploying the service so the endpoints are reachable):
k6 run load.js

Logs and traces in Datadog

The Datadog Agent forwards logs and receives traces (APM) on port 8126. After generating traffic, you can inspect application logs and traces in Datadog. Logs Explorer (filter by service, host, or container) shows timestamp, host, service, content, and extracted severity levels (info/warn/error).
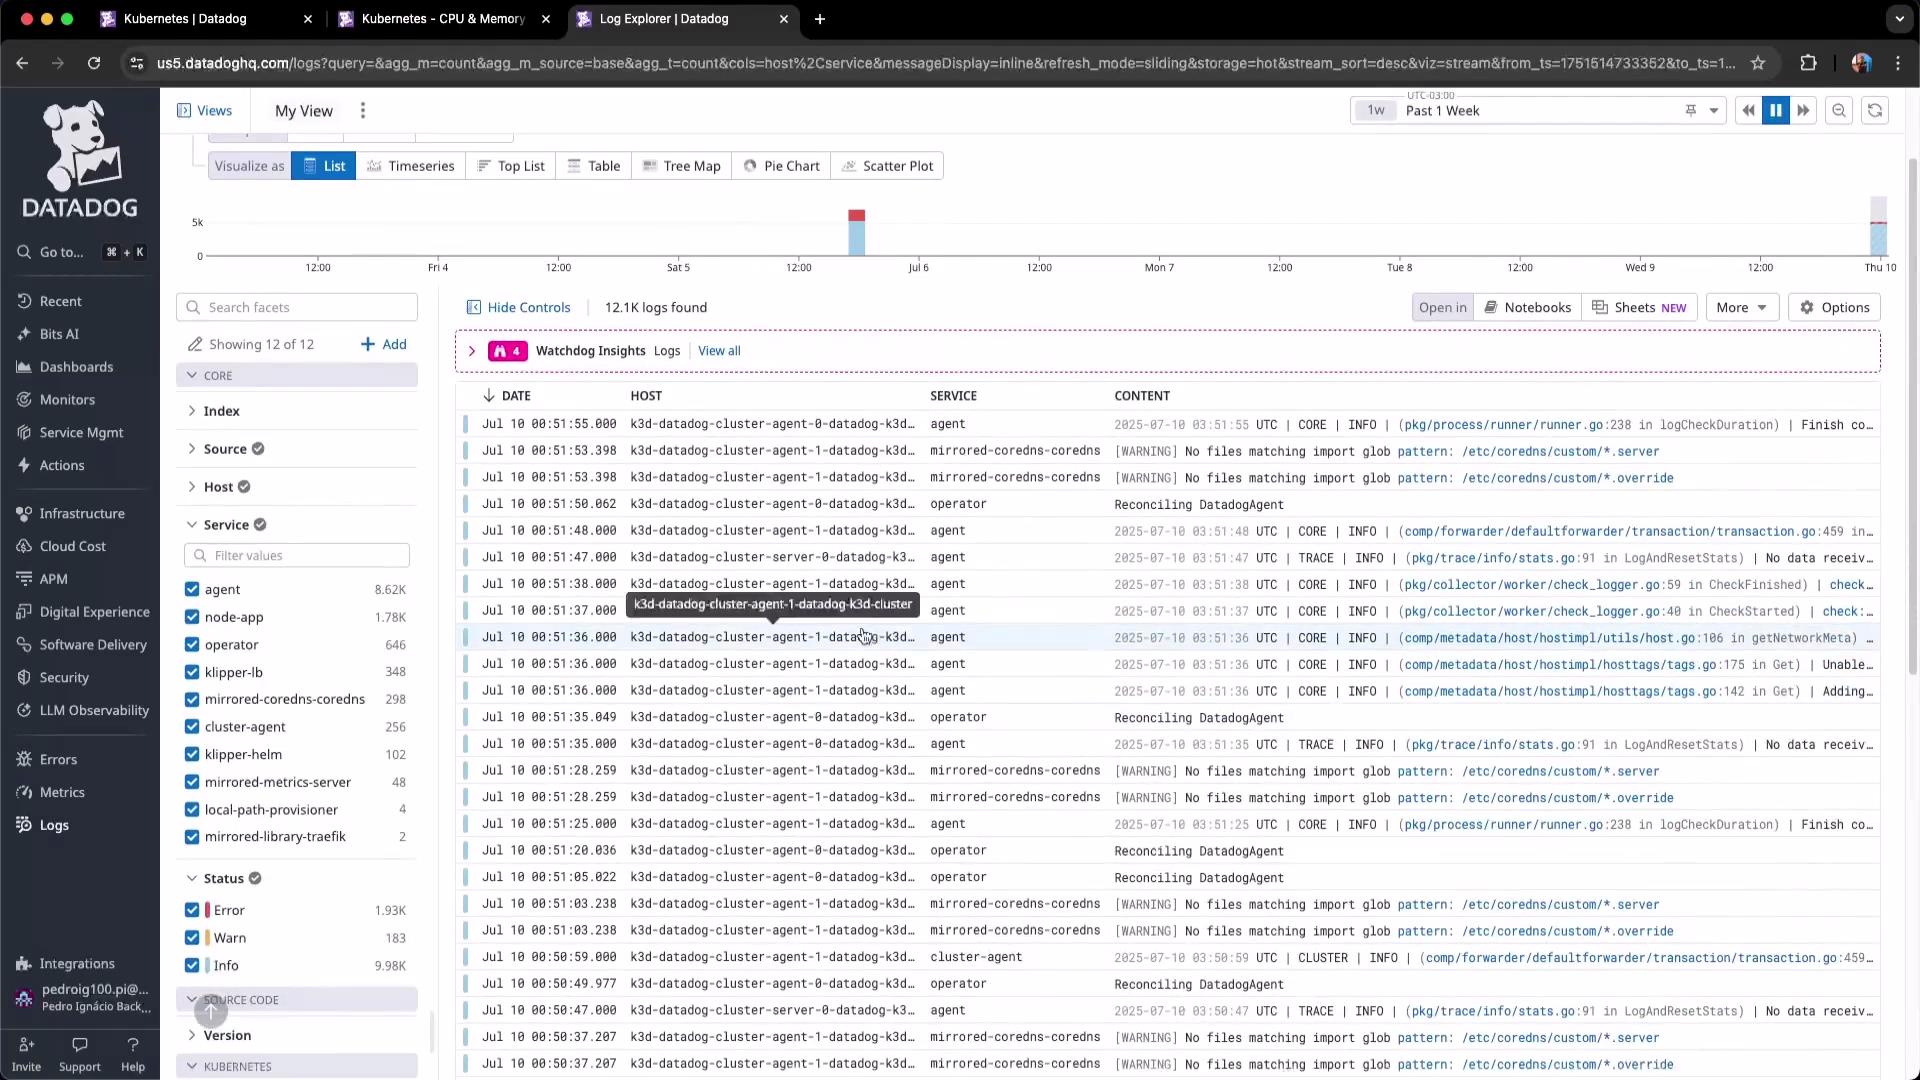
The image shows a Datadog interface displaying log data, with filters and sources listed on the left and detailed logs including dates, hosts, services, and content in the main view.
Use the left sidebar filters to narrow logs to your node-app service or to a specific host/container.
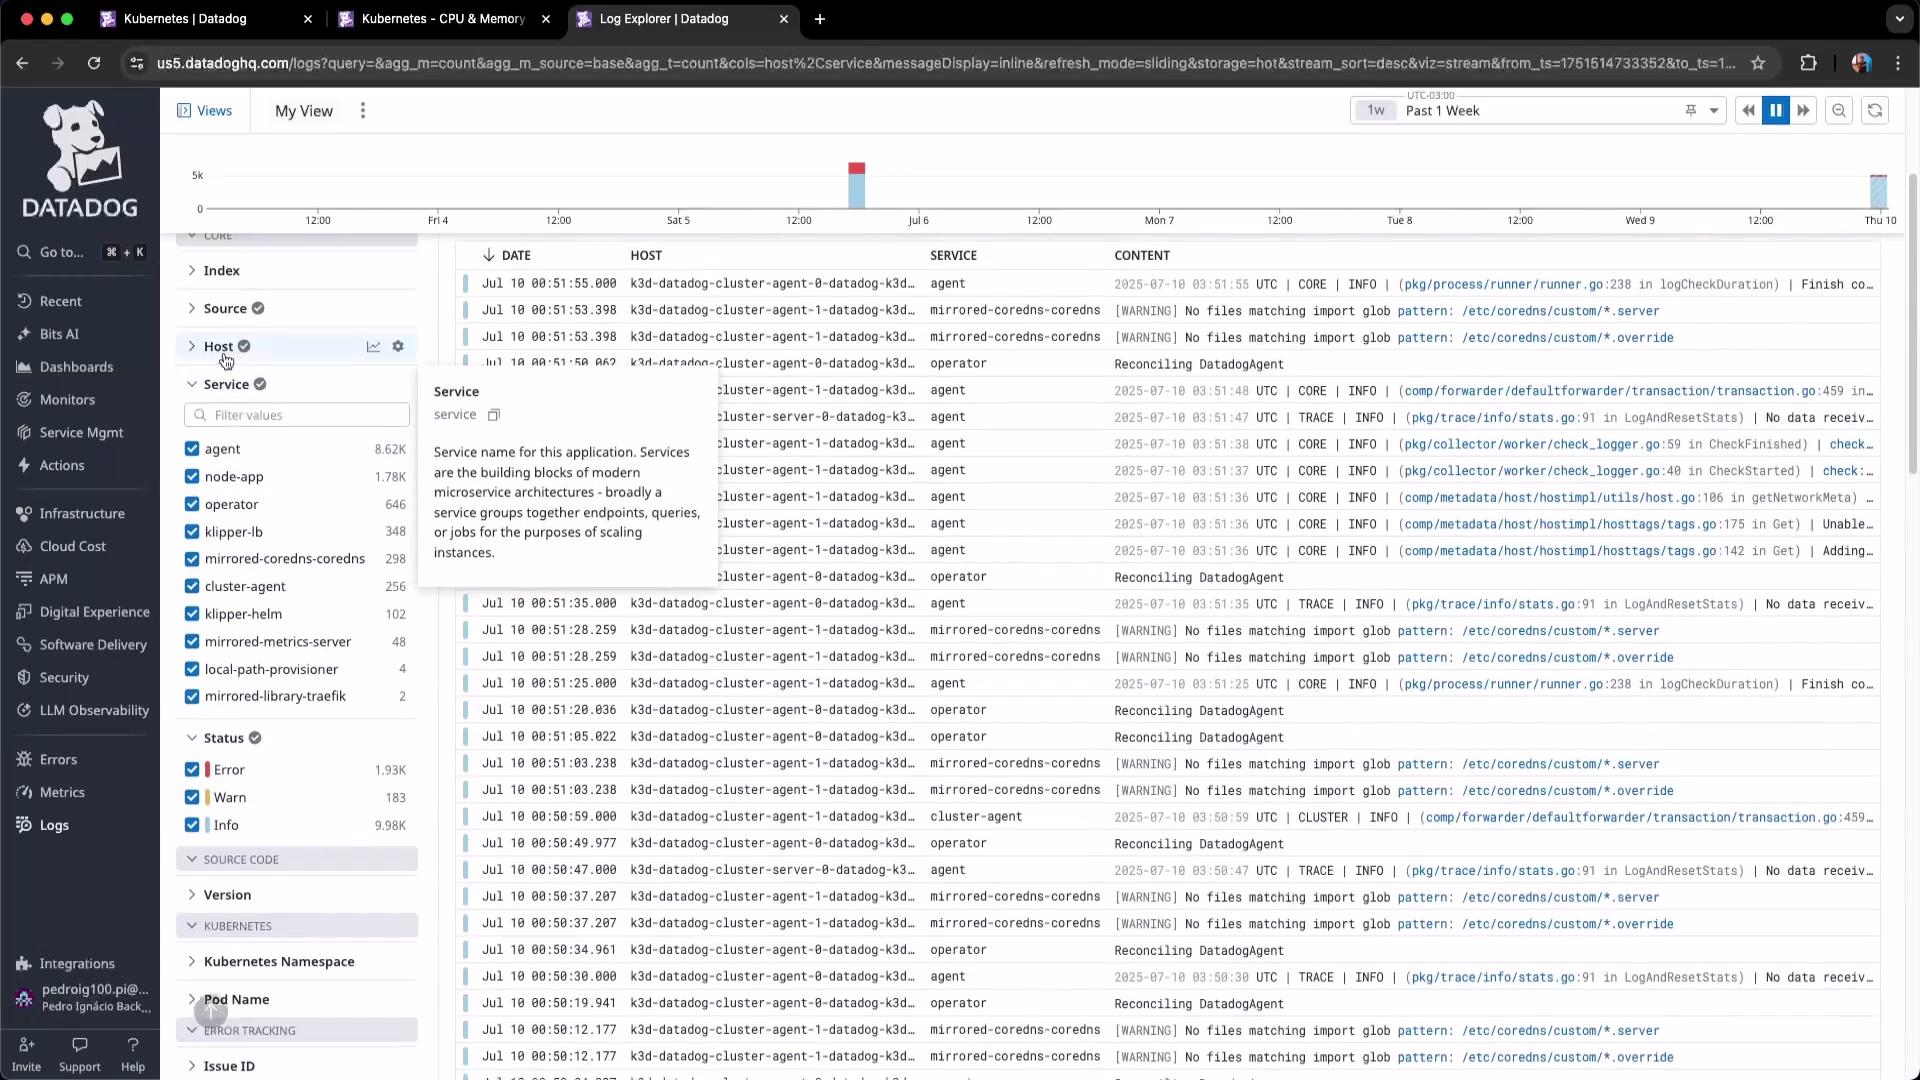
The image shows a Datadog Log Explorer interface displaying log data with details such as date, host, service, and content, alongside filtering options on the left sidebar.
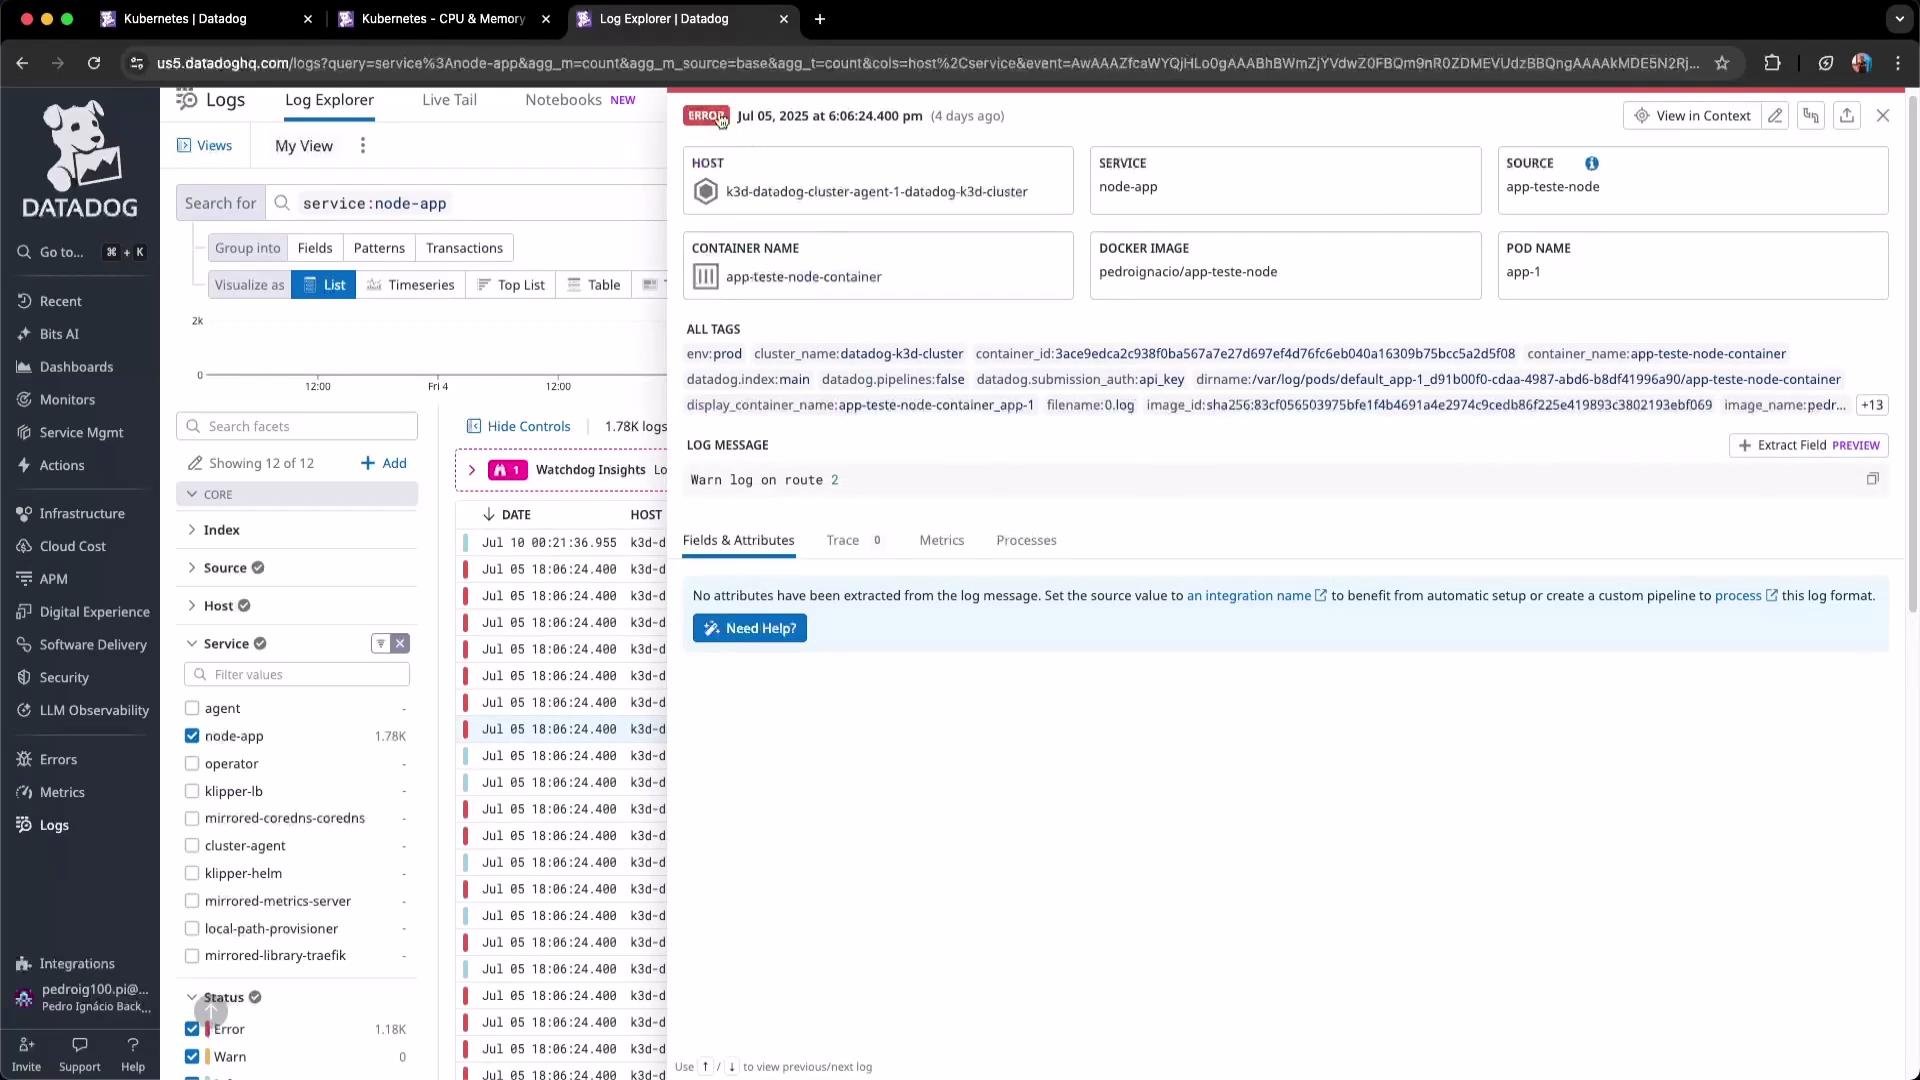
Click into an application log to see extracted fields and severity. The example below shows an error emitted by route1 in the Node.js app.
The image shows a screenshot of the Datadog Log Explorer interface, displaying logs for the "node-app" service with a visible error message dated July 5, 2025. It includes filters and details about hosts, sources, and containers.
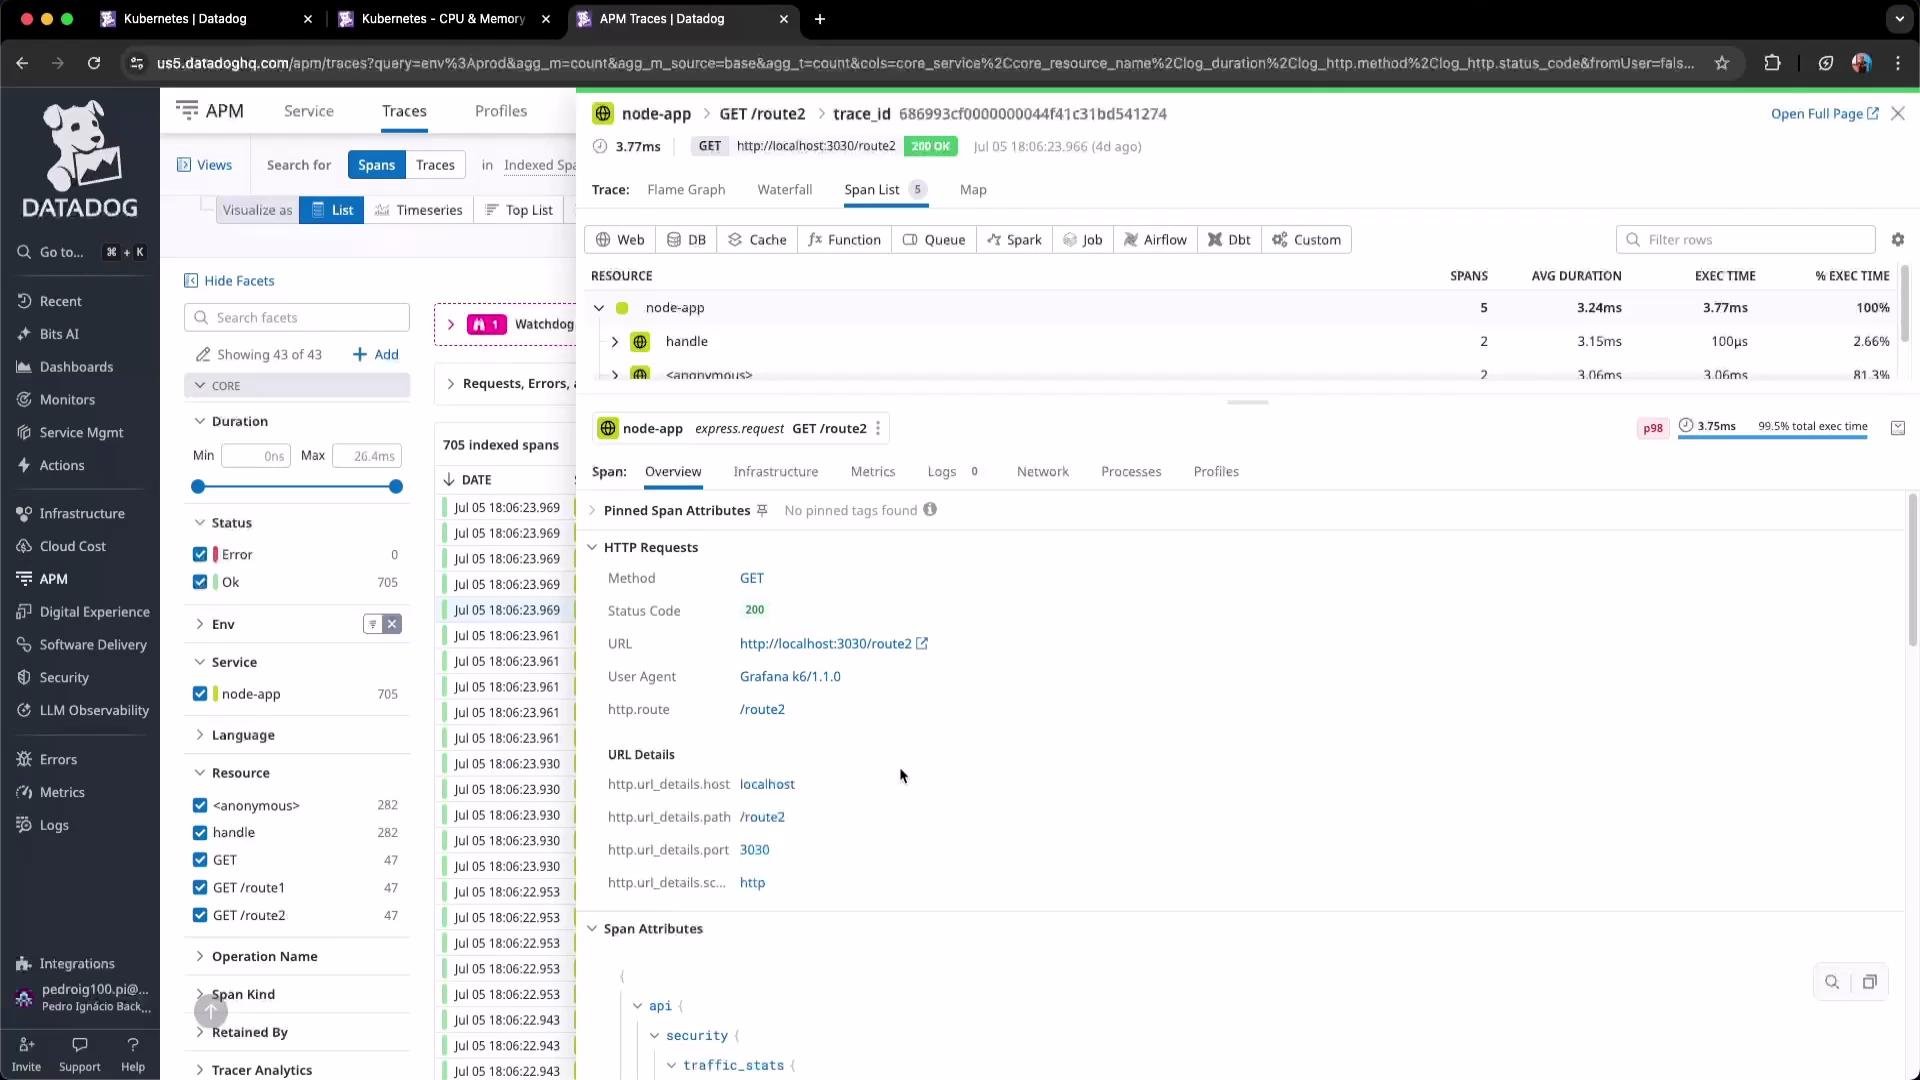
APM → Trace Explorer displays traces composed of spans (Express handlers, DB calls, HTTP calls, etc.). Click a trace to view span breakdowns, attributes (environment, user agent, route, status code), and timings. This example shows a GET /route2 trace.
The image shows a Datadog APM interface displaying traces and span details for an HTTP GET request to a "node-app" service on route "/route2." The HTTP request was successful with a status code of 200.
Traces are critical for distributed systems — they reveal service call flows, span durations, and where latencies or errors occur.

Wrap up — What you accomplished

This lesson demonstrated how to:
  • Deploy and validate Datadog components (Agent, Cluster Agent, Operator) in Kubernetes and verify daemonsets/pods.
  • Create a Kubernetes secret for the Datadog API key and reference it in the DatadogAgent configuration.
  • Instrument a Node.js application with dd-trace (initialize at the top of the entrypoint) and include the tracer in the Docker image.
  • Configure the application pod with environment variables so the Agent can collect traces, logs, and profiles.
  • Generate traffic with k6 and observe logs/traces inside Datadog.
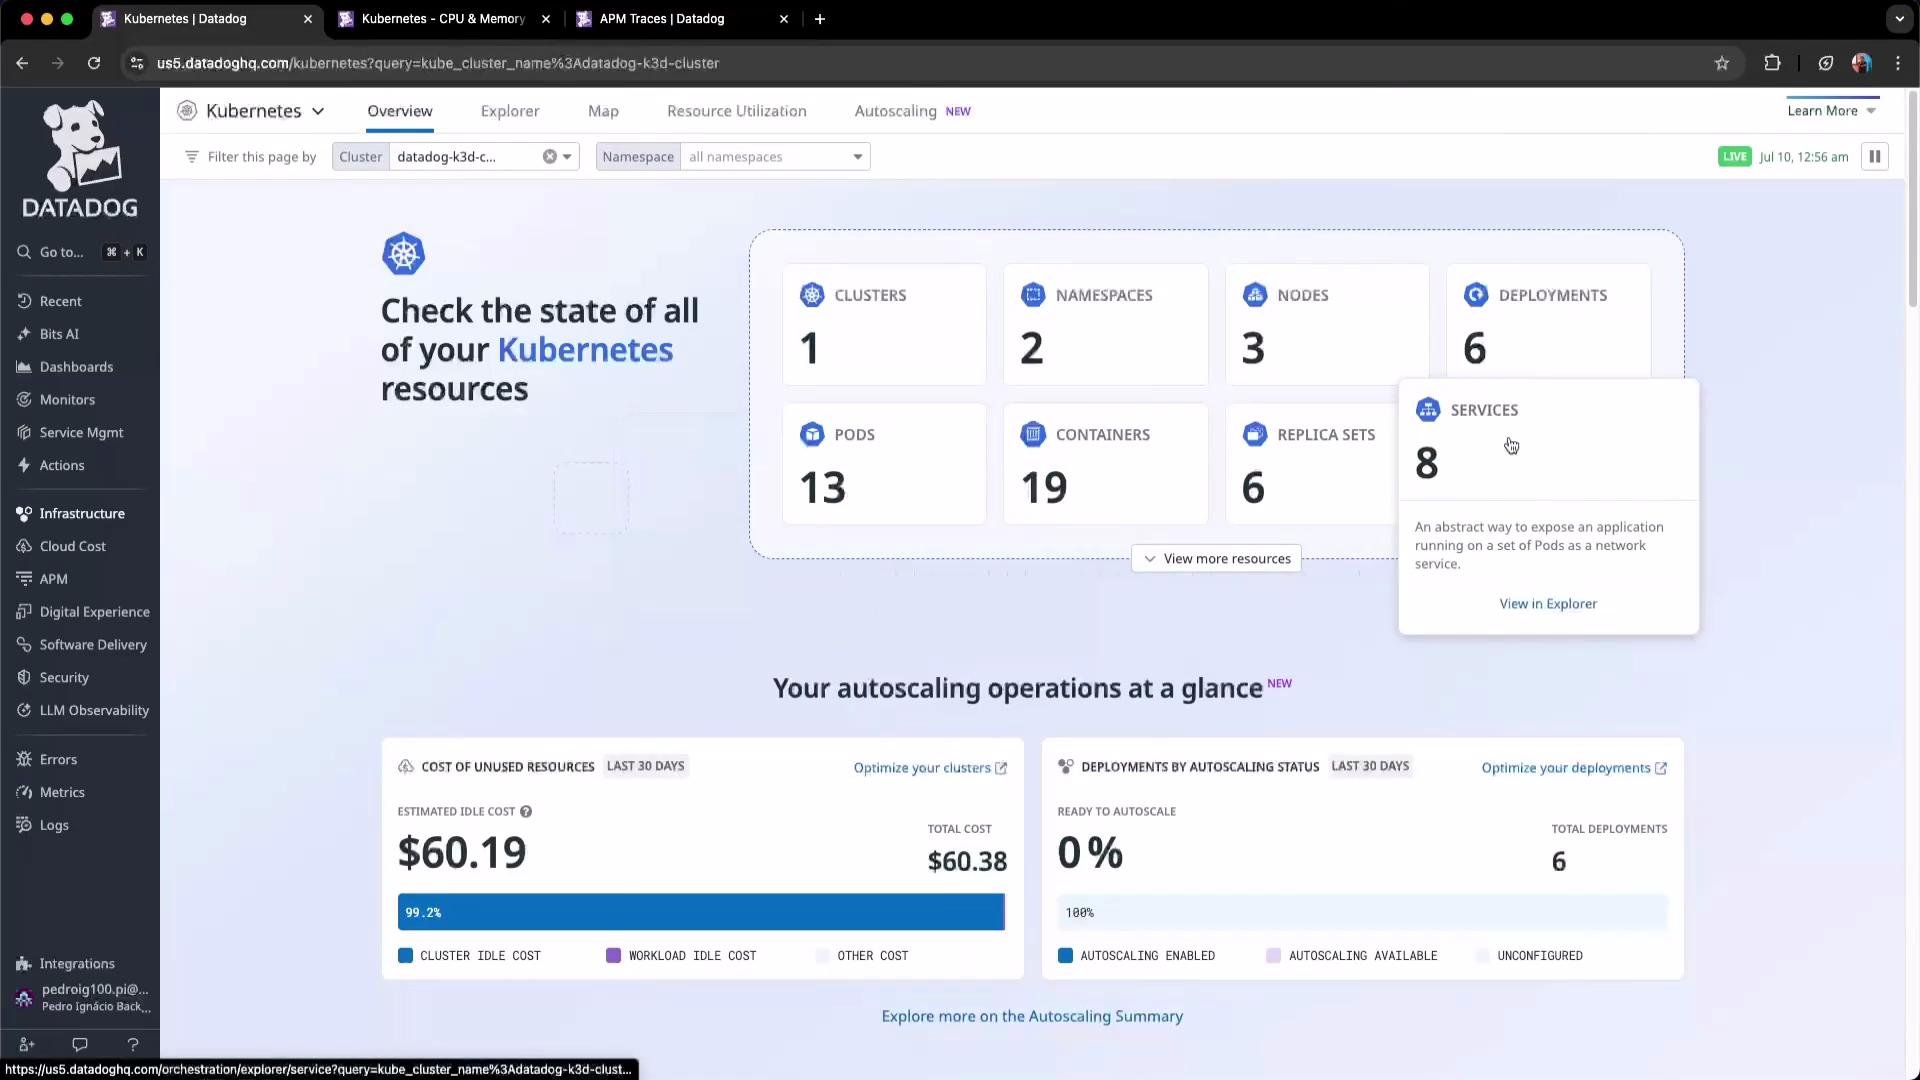
Final dashboard view:
The image shows a Datadog dashboard displaying the state of Kubernetes resources, including clusters, namespaces, nodes, and other metrics, alongside information on autoscaling operations and resource costs.
Follow these steps — install the Helm chart or operator, create the API key secret, apply the DatadogAgent CR (if using the operator), instrument your app, and generate traffic — to capture rich telemetry in Datadog: metrics, logs, traces, and profiles for monitoring and troubleshooting. Links and references

Watch Video