

Overview
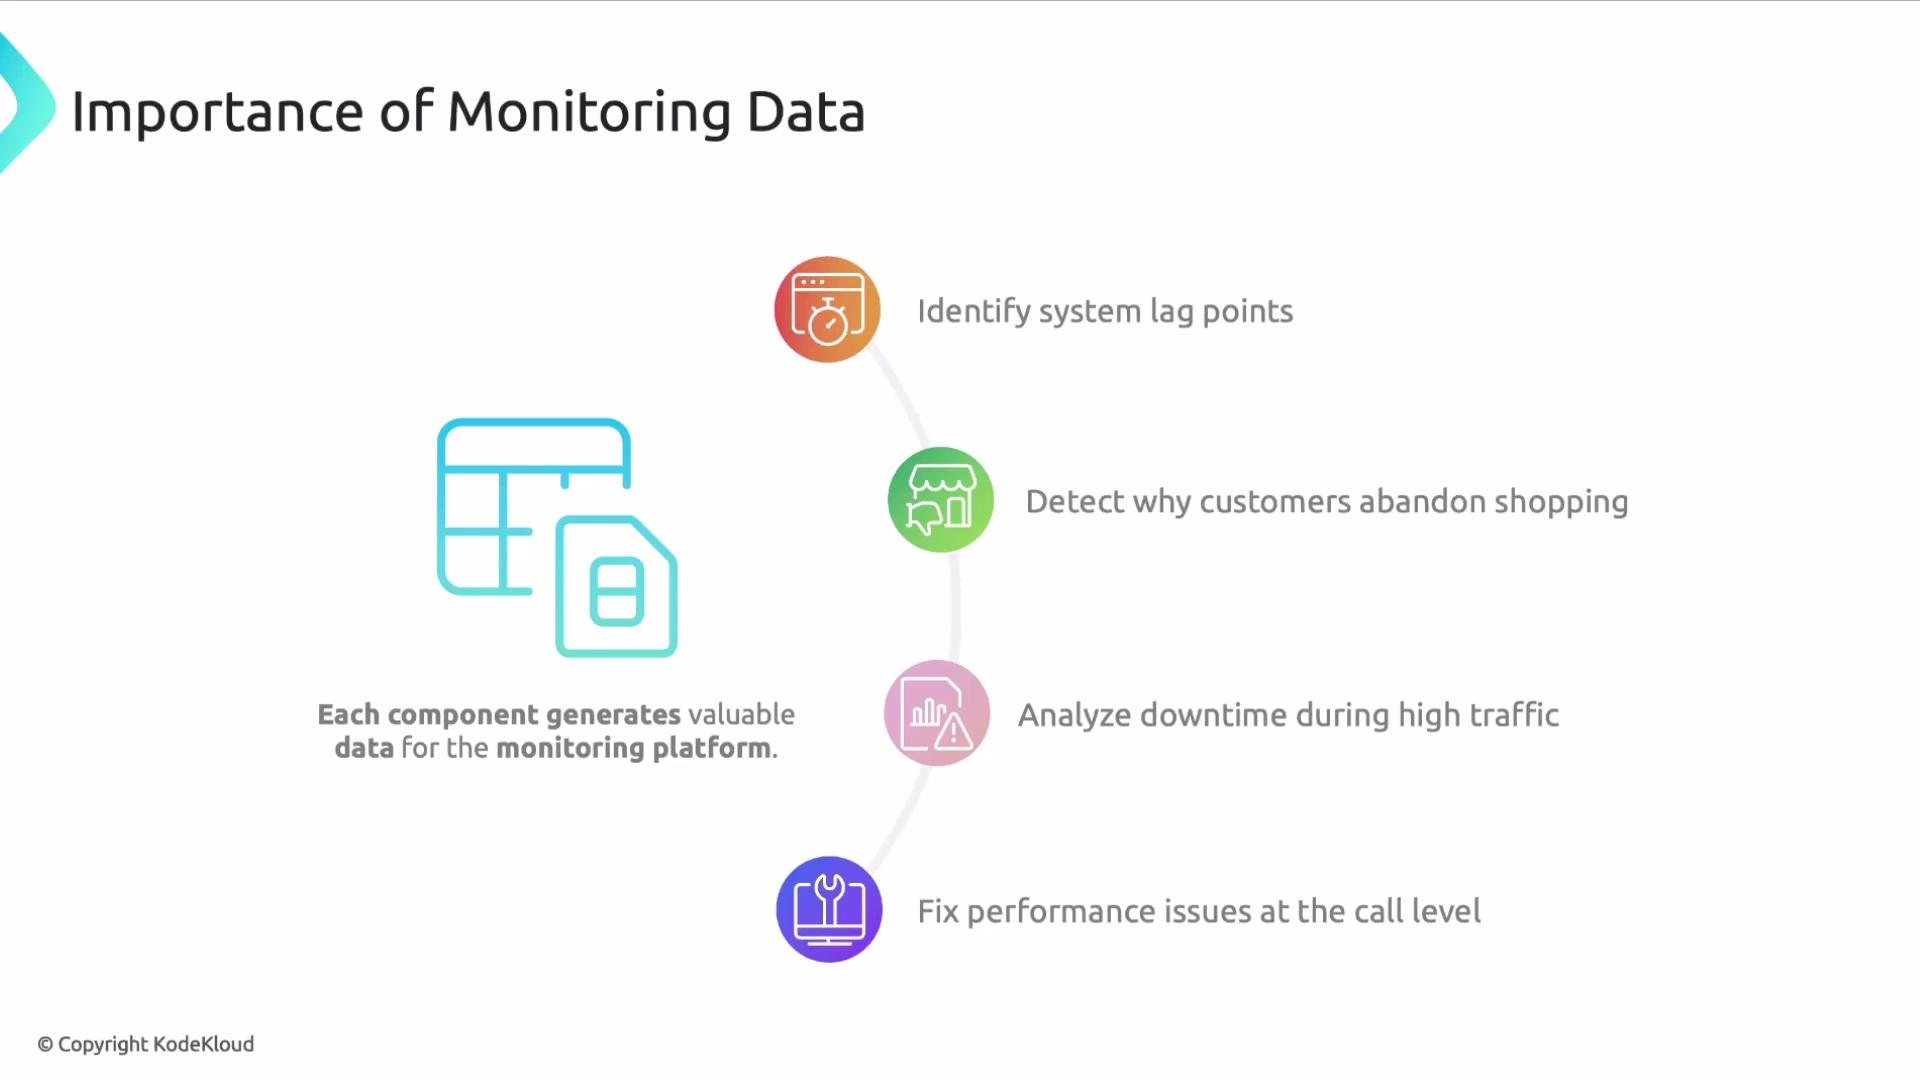
When a user initiates a request (from mobile, web, or another client), multiple components collaborate to fulfill it. Each hop emits signals (logs, metrics, traces, events) that, when collected and correlated, answer operational and business questions such as:- Why is the system slow?
- Why are customers abandoning carts?
- Which service or function causes a performance regression?
- Why do some services fail under load?
User request journey and where telemetry is generated
Typical request flow:- The user accesses the platform via a client.
- The request reaches an ingress layer or API gateway that may perform authentication, authorization, rate-limiting, and policy checks.
- The gateway forwards the request to one or more microservices that implement the business logic.
- Microservices may resolve the request directly or call downstream systems such as databases, caches, or message queues.
- Inside each service, methods and modules execute, performing reads/writes and invoking external APIs.
Telemetry types (what to collect and why)
Collecting the right combination of these signals allows teams to correlate symptoms (e.g., a spike in error rates) with causes (e.g., slow downstream DB queries) and business impact (e.g., checkout abandonment).
Telemetry collection pipeline
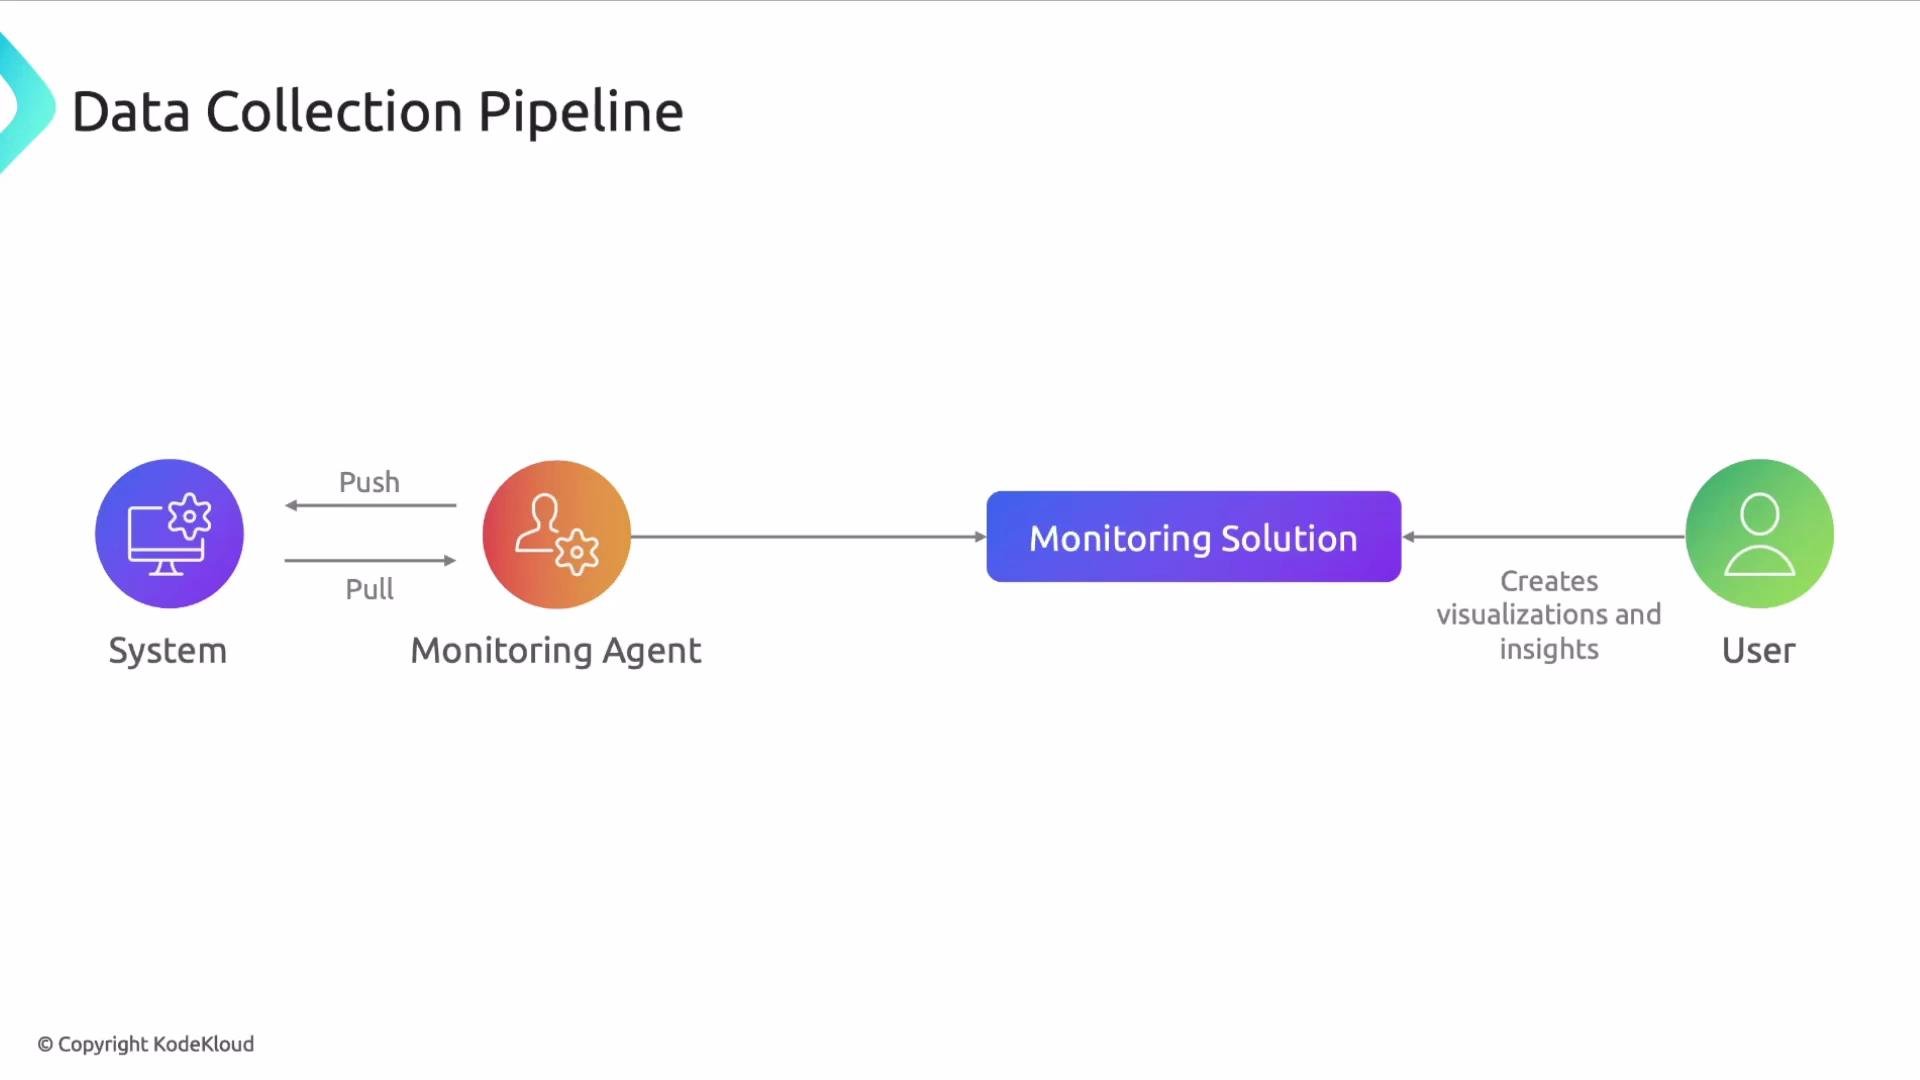
A reliable, efficient collection pipeline is critical. A common pipeline consists of the following stages:- Instrumentation and collection
- Applications emit telemetry via automatic instrumentation (language SDKs, middleware) or manual instrumentation (explicit API calls).
- Use consistent context propagation and standardized formats (e.g., OpenTelemetry) to ensure traces can be reassembled.
- Agent or collector
- An agent or collector runs on the host, in a sidecar, or as a centralized service.
- Collection models include push (apps send telemetry) and pull (the collector scrapes endpoints such as Prometheus exporters).
- Local processing
- Agents/collectors perform batching, buffering, sampling, aggregation, enrichment (adding metadata/tags), and filtering to reduce noise and manage cost.
- Make processing rules configurable per component/environment.
- Export to backend
- Processed telemetry is exported securely to the monitoring backend using retries, backoff, compression, and encryption.
- Storage and visualization
- The backend stores telemetry for a configured retention period and provides querying, alerting, and visualization to turn signals into action.
Operational considerations — best practices
- Correlation and context propagation
- Use distributed tracing and propagate trace/span IDs across process and network boundaries so traces can be stitched end-to-end. See OpenTelemetry for standards and examples: https://opentelemetry.io/docs/concepts/signals/traces/
- Sampling and aggregation
- Apply sampling and aggregation at the agent/collector to control ingestion volume and cost while preserving representative traces for debugging and SLO calculations.
- Enrichment and tagging
- Add service, environment, region, version, or customer identifiers at collection time to improve filtering and troubleshooting in the backend.
- Reliability
- Ensure agents buffer locally and retry exports on transient failures so telemetry is not lost during outages.
- Security and privacy
- Redact sensitive data before export, use encryption in transit, and enforce access controls to meet compliance requirements.
Retention and compliance are business decisions. Configure retention lengths and data redaction according to your regulatory and cost requirements.
Putting it together: actionable outcomes
With properly instrumented applications and a resilient collection pipeline, teams can:- Build dashboards that map system health to business KPIs.
- Create alerts tied to SLOs and operational thresholds.
- Perform deep-dive investigations using traces and logs to identify and fix the root cause.
- Optimize cost by tuning sampling, retention, and aggregation policies.
Links and references
- OpenTelemetry Traces: https://opentelemetry.io/docs/concepts/signals/traces/
- Prometheus exporters and instrumentation: https://prometheus.io/docs/instrumenting/exporters/
- Kubernetes concepts (for platform-native collectors): https://kubernetes.io/docs/concepts/overview/what-is-kubernetes/