

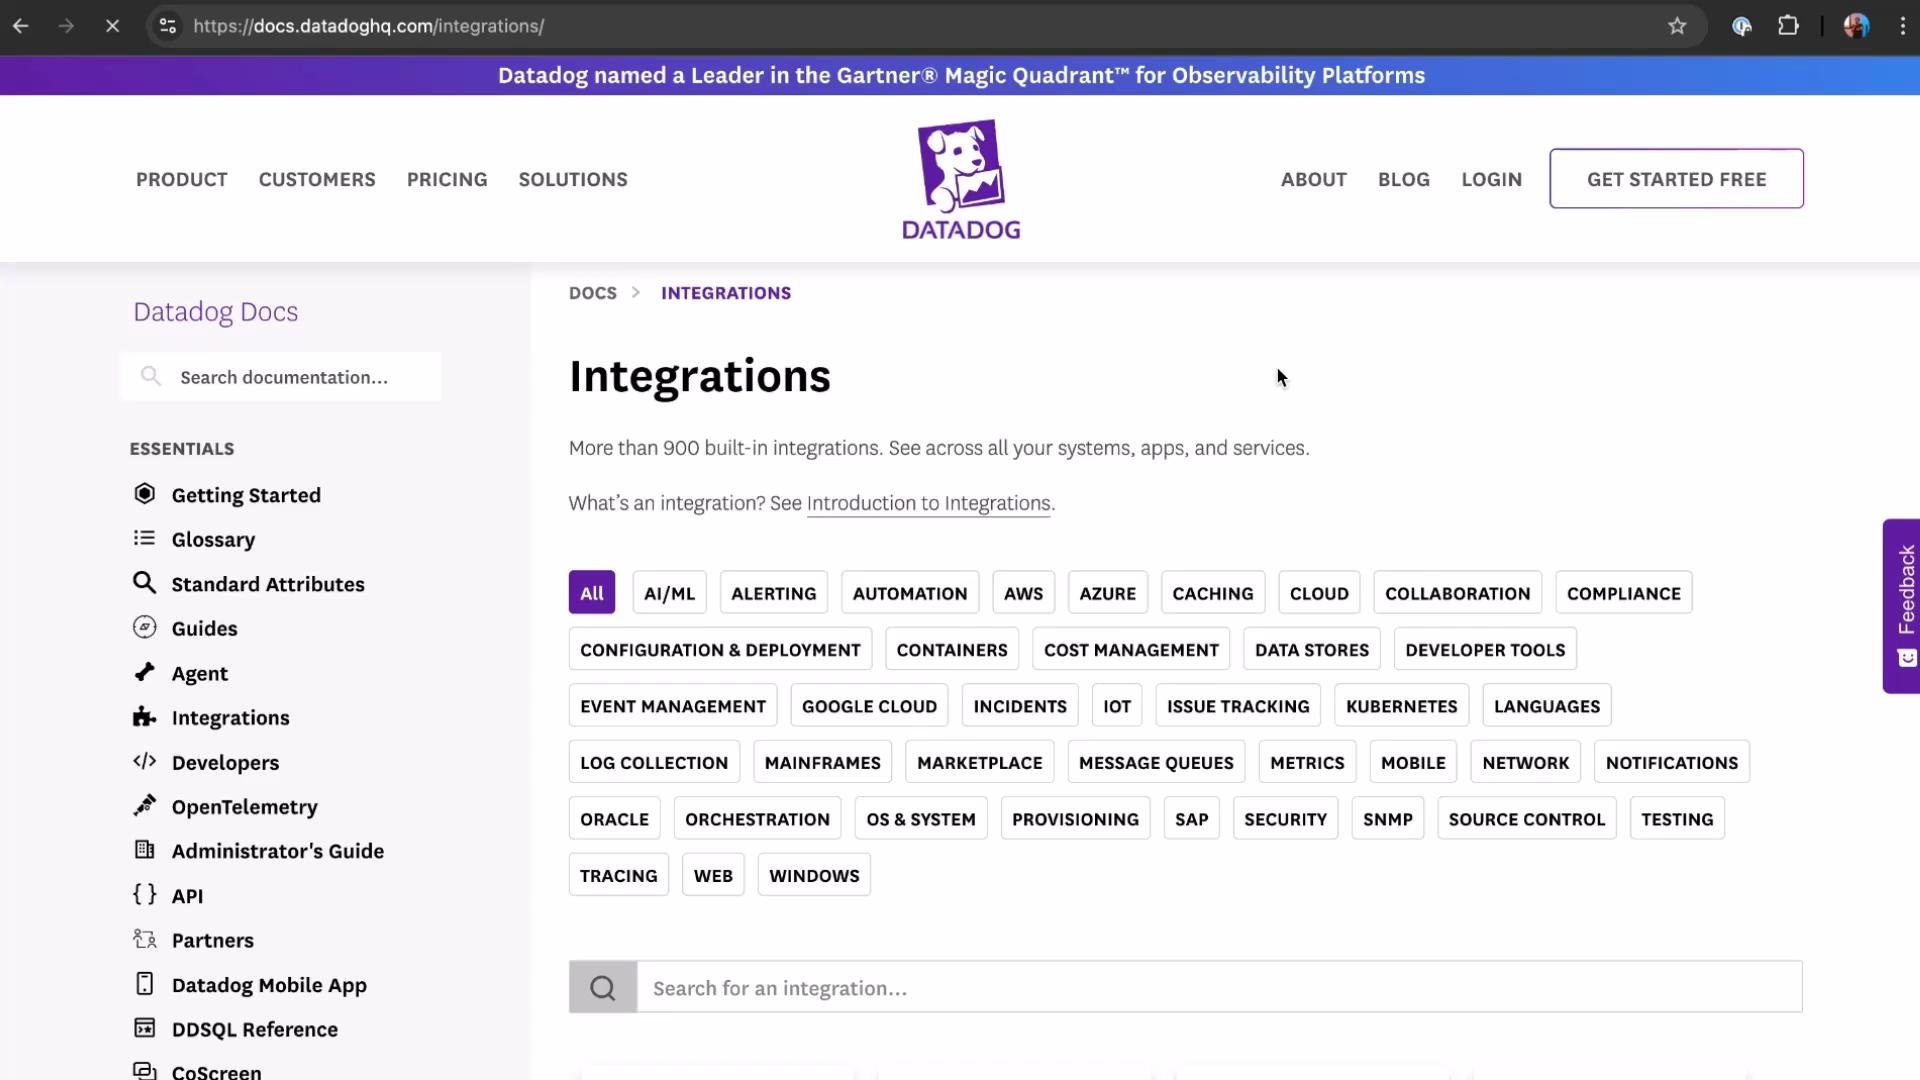
- The Datadog Integrations documentation lists every officially supported integration. You can filter and search by category (for example, AI/ML, cloud providers, orchestration, observability tools).
- Example: filtering on Google Cloud surfaces integrations such as CheckWAF, GigaOm, Google Cloud APIs, and BigQuery—each entry includes setup steps, configuration options, and the data types collected.
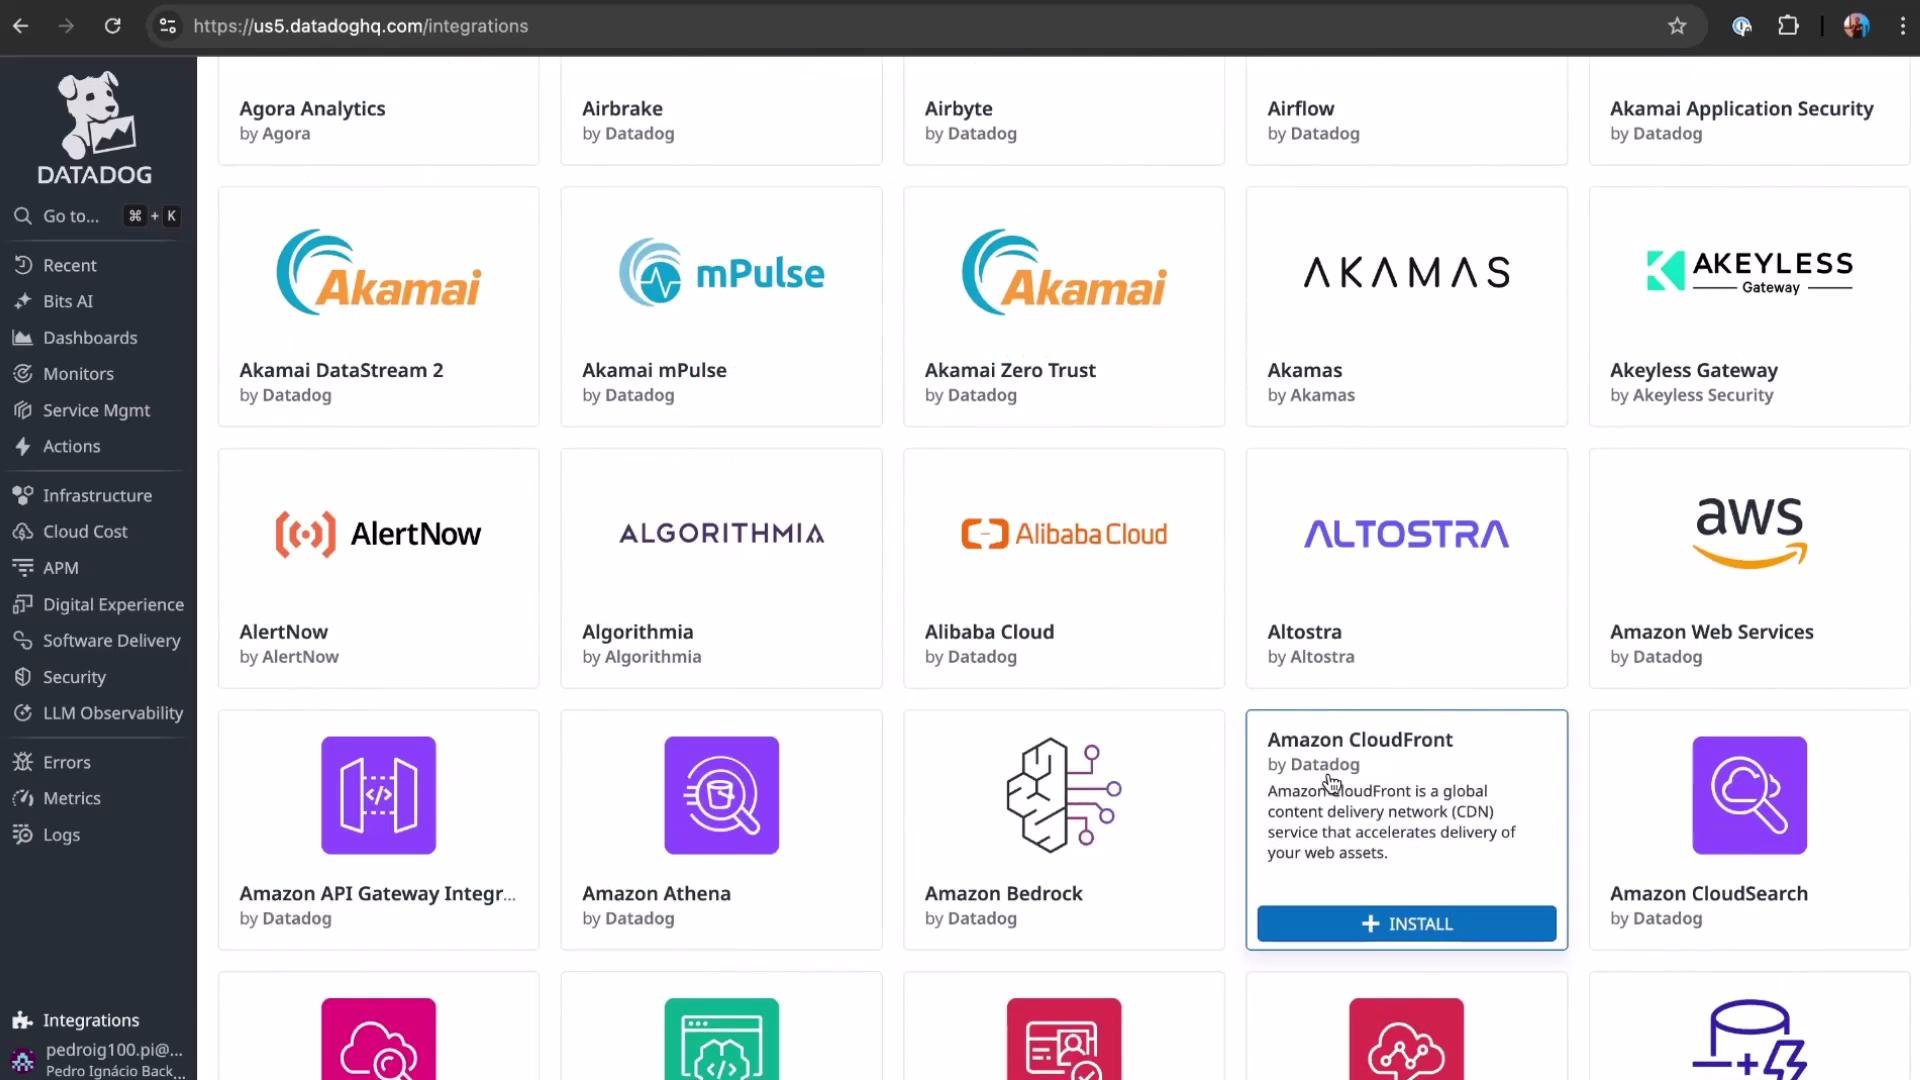
- From the Datadog console go to Integrations → Integrations to view a platform-side catalog that mirrors the documentation.
- The console also surfaces suggested or autodetected integrations based on telemetry observed from your environment.
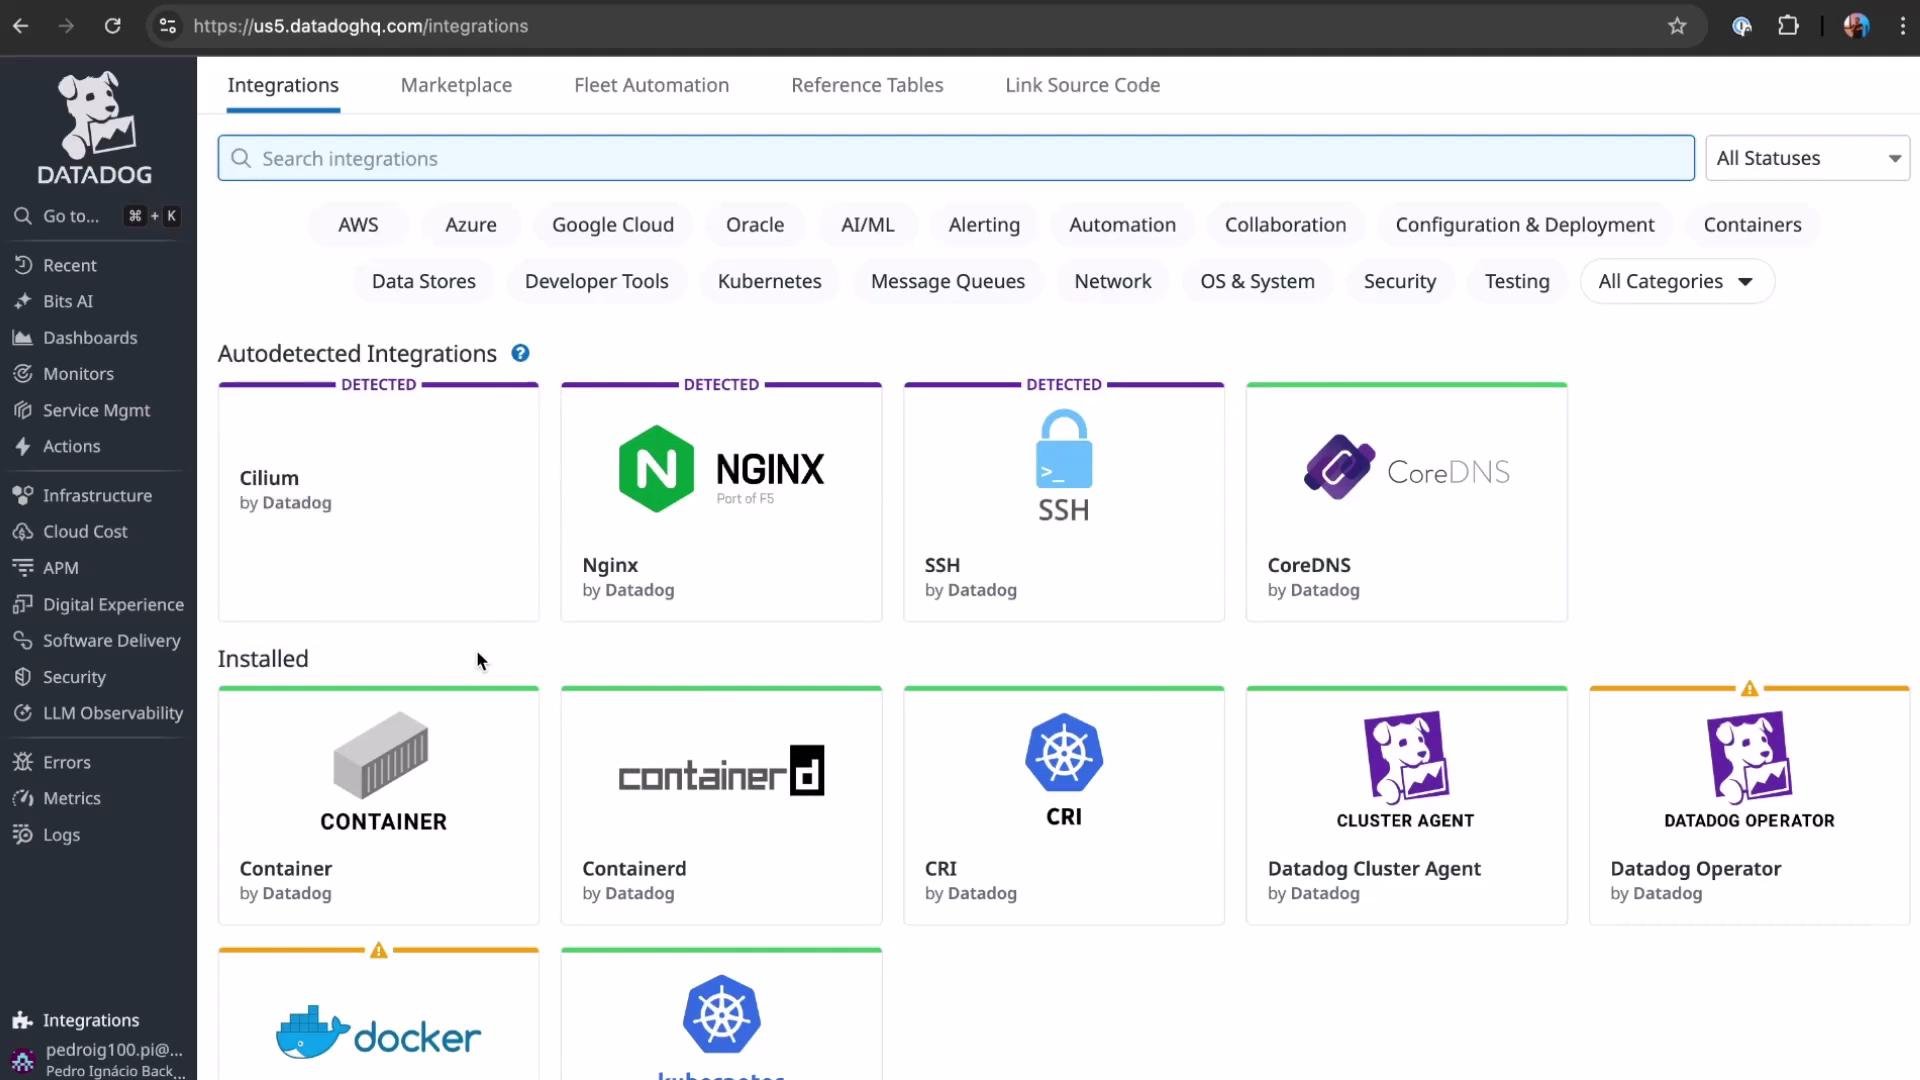
- Suggested integrations discovered by Datadog based on detected technologies.
- Autodetected and installed integrations (for example, Nginx, SSH, Docker).
- Detailed configuration guides that explain:
- What the integration collects: metrics, logs, and/or traces.
- Required Datadog Agent versions and any integration package versions.
- Authentication and permission requirements (API keys, service accounts, IAM roles).
Full catalog and Marketplace
- The documentation lists the full catalog—everything from 1Password and Active Directory to major cloud providers and managed services.
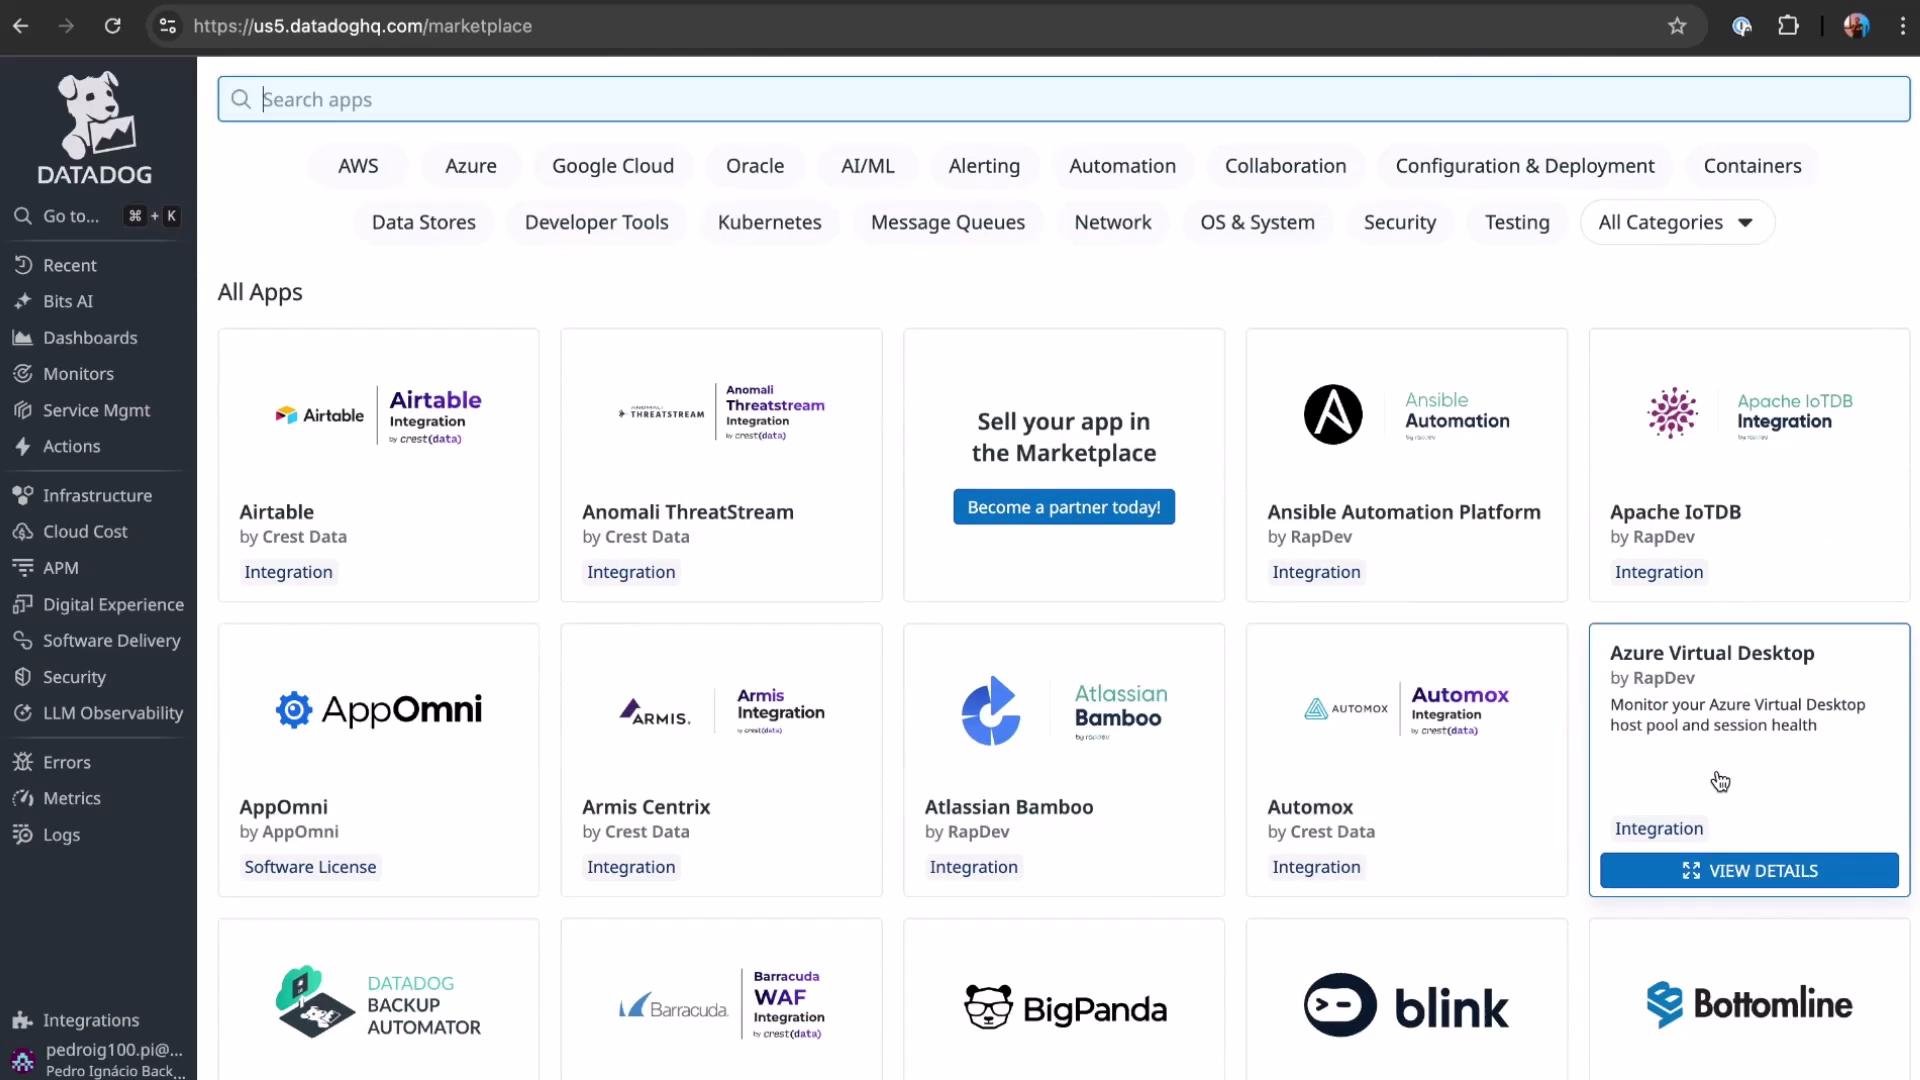
- Datadog’s Marketplace extends functionality with vendor and community-contributed apps. Marketplace items can provide specialized dashboards, CI/CD integrations, or tooling that is not part of core integrations.
- Verify Agent and integration package versions against the integration’s documentation before deploying.
- Confirm permissions and credentials (API keys, service accounts, IAM roles) are scoped correctly and follow the principle of least privilege.
- Test in staging with a minimal configuration to validate telemetry collection and avoid noise in production.
- Use the Marketplace for specialized use-cases or vendor-provided integrations that extend core Datadog capabilities.
- Monitor initial data volumes and set appropriate retention/ingestion limits to control cost.
Misconfigured credentials or excessive permissions can cause missing data or security exposure. Always use scoped service accounts and test in a non-production environment first.
Before enabling integrations in production, confirm your Datadog Agent version and the permissions needed (API keys, service accounts, or IAM roles). This prevents partial data collection and permission-related failures.
- Datadog Integrations documentation: https://docs.datadoghq.com/integrations/
- Datadog Marketplace: https://www.datadoghq.com/marketplace/
- Datadog Agent docs: https://docs.datadoghq.com/agent/
- Redis: https://redis.io/
- Ubuntu Server: https://ubuntu.com/server
- OpenJDK: https://openjdk.org/
- Google Cloud: https://cloud.google.com/
- CircleCI: https://circleci.com/
- Ansible: https://www.ansible.com/