

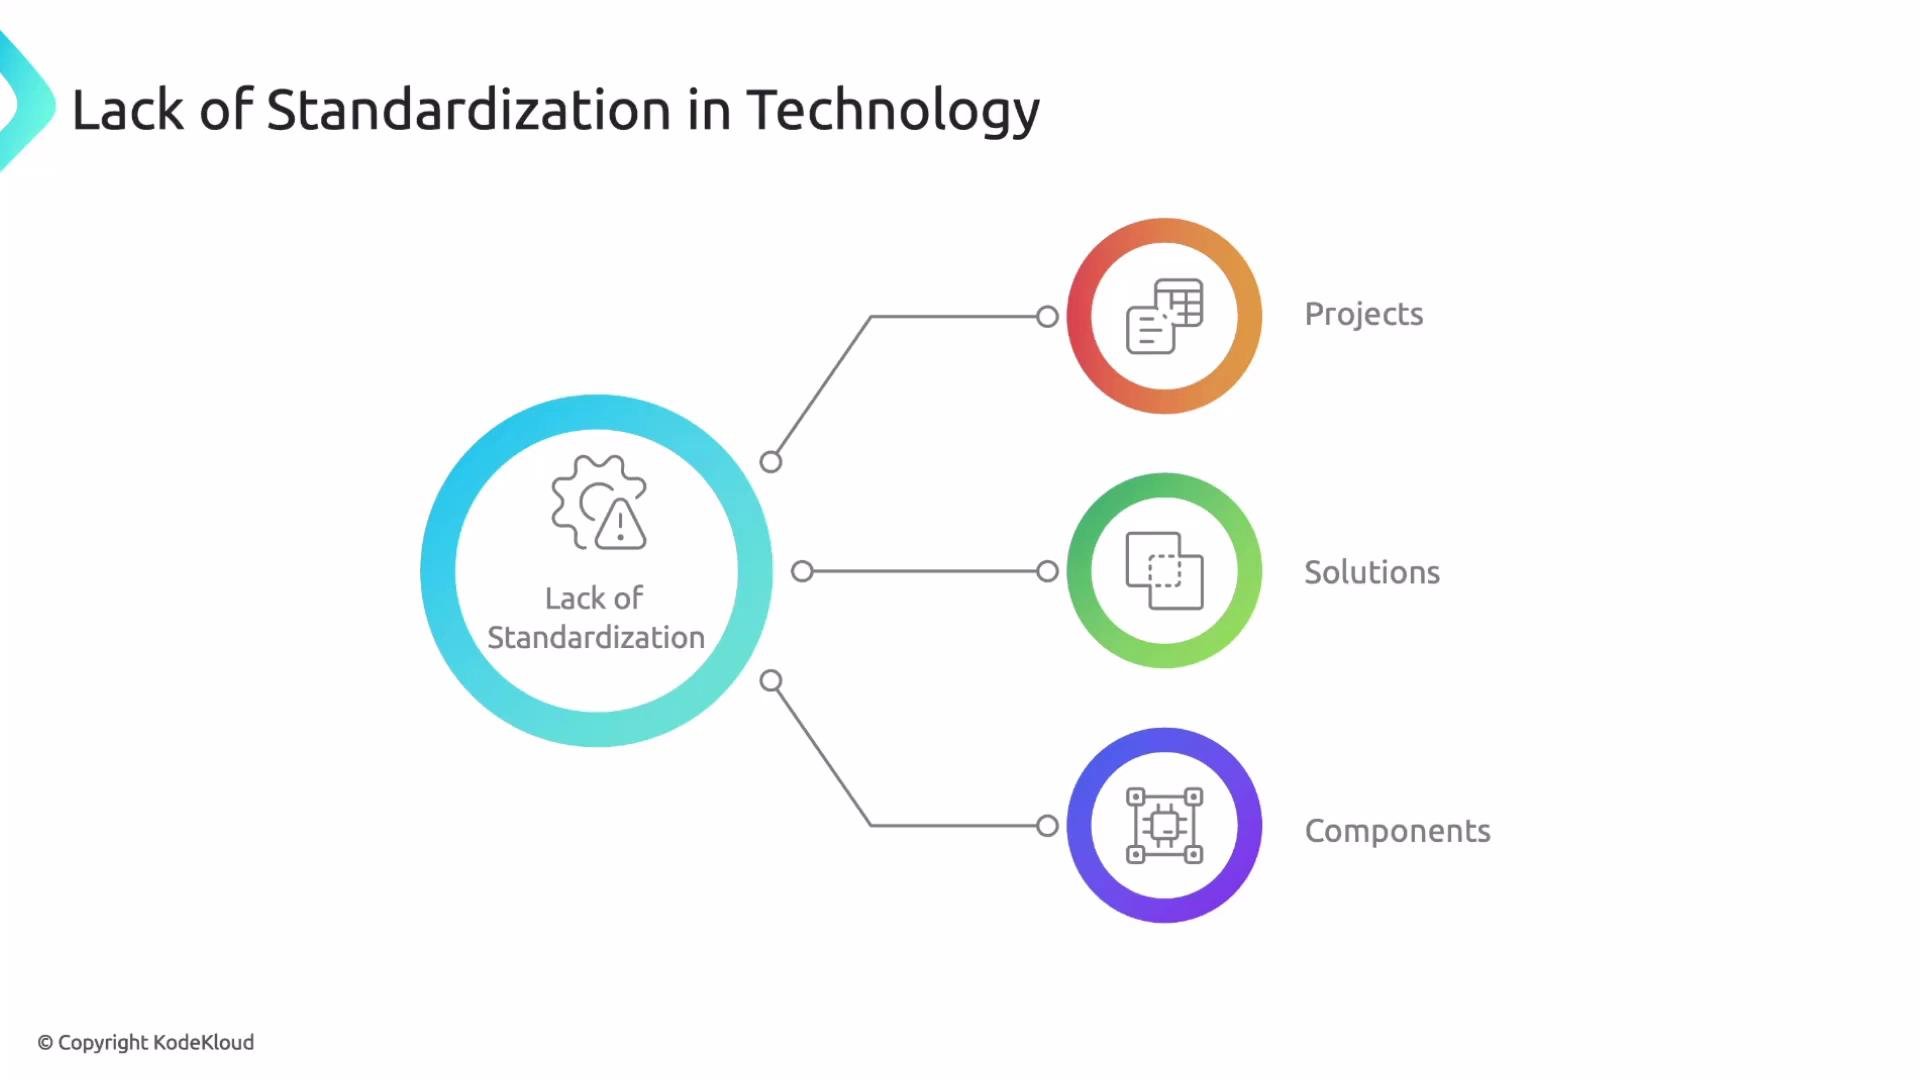
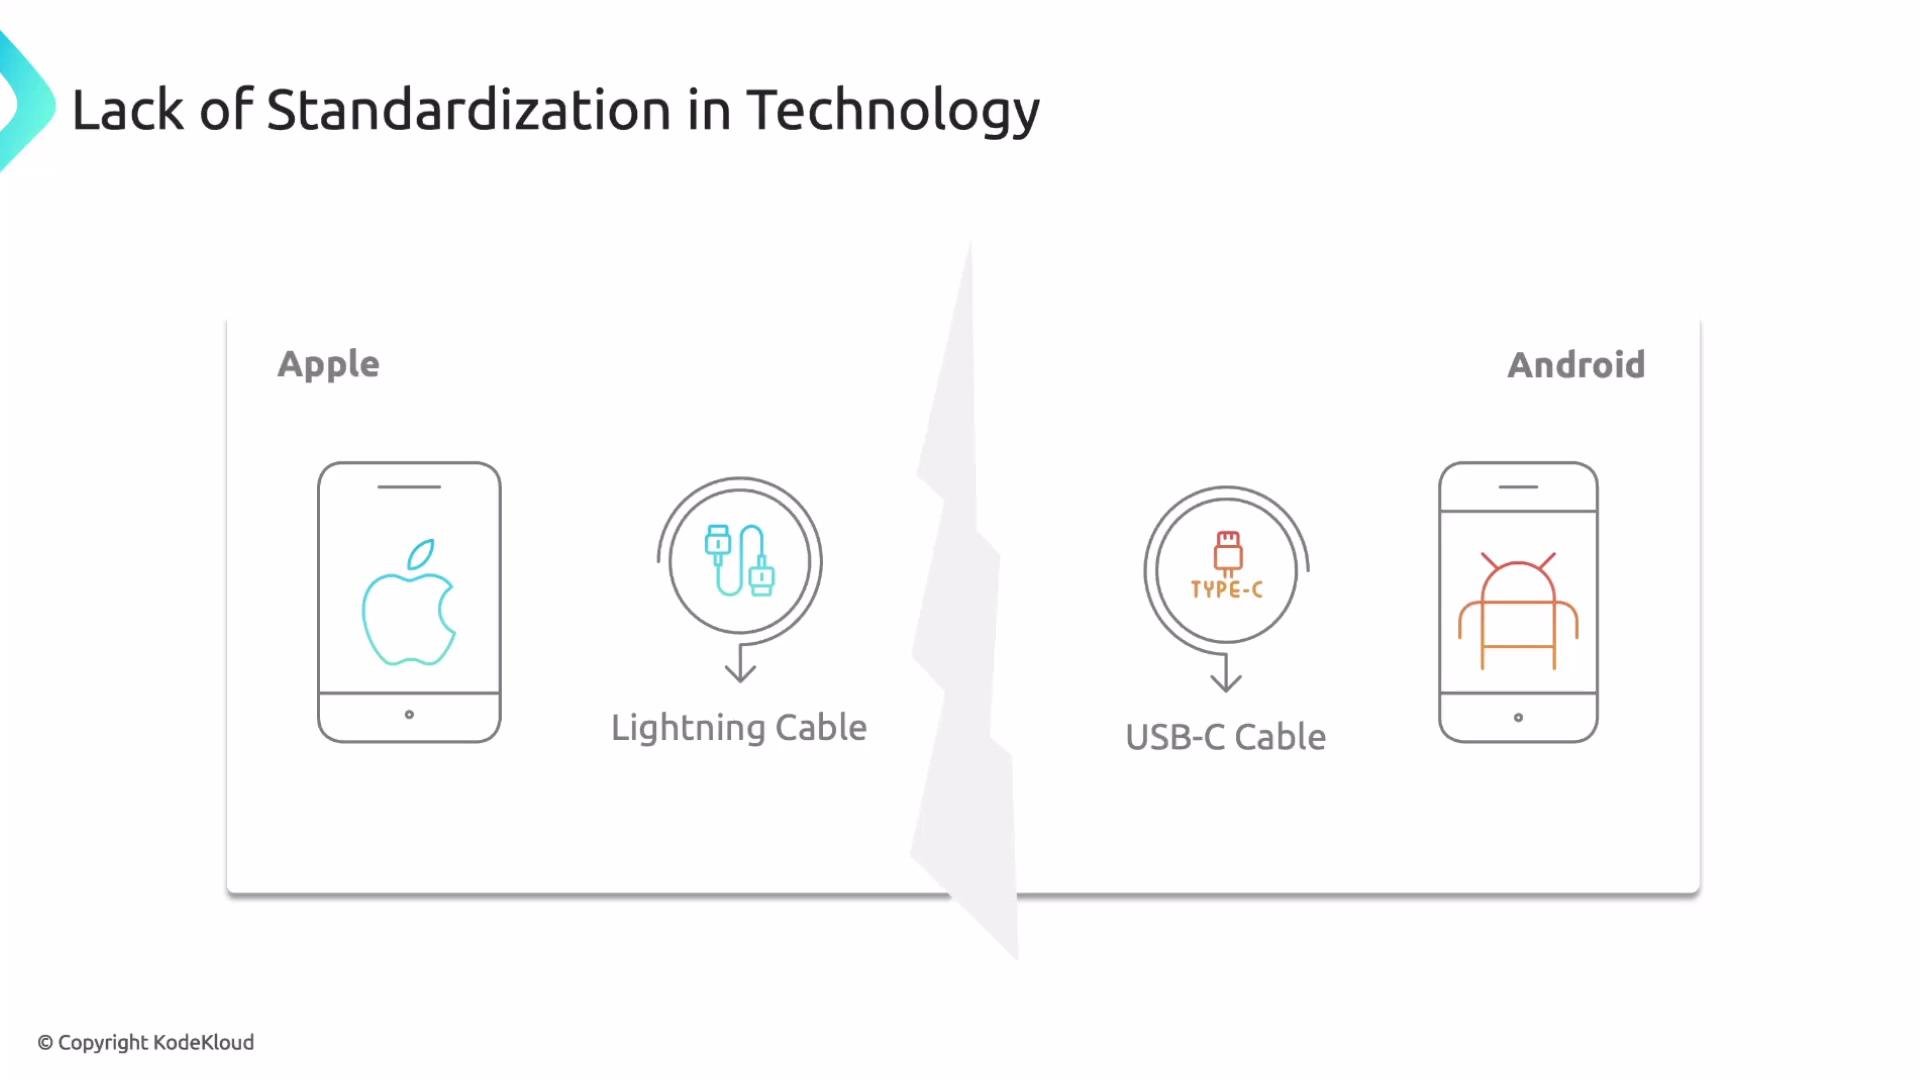
- Instrumentation and data collection (the telemetry sources)
- The OpenTelemetry Collector (central ingestion, processing, and export)
- Auto-instrumentation: Agents or libraries that automatically add telemetry to applications without changing application logic. Useful for rapid coverage and legacy codebases.
- OpenTelemetry API (manual/custom instrumentation): A stable API developers use to add explicit traces, metrics, and logs where automatic instrumentation is insufficient or when richer semantics are required.
- SDKs: Language-specific SDK implementations that provide configuration, context propagation, resource attributes, and wiring to exporters.
The OpenTelemetry Collector
The Collector is a vendor-neutral agent/gateway that centralizes collection, optional in-pipeline processing, and exporting of telemetry to backends. It decouples data producers from consumers so you can add, remove, or change backends without changing application instrumentation.
Core Collector components:
Telemetry sources send data to the Collector, which ingests, optionally transforms, and exports it to configured backends. Using the Collector enables centralized control over sampling, enrichment, and routing.
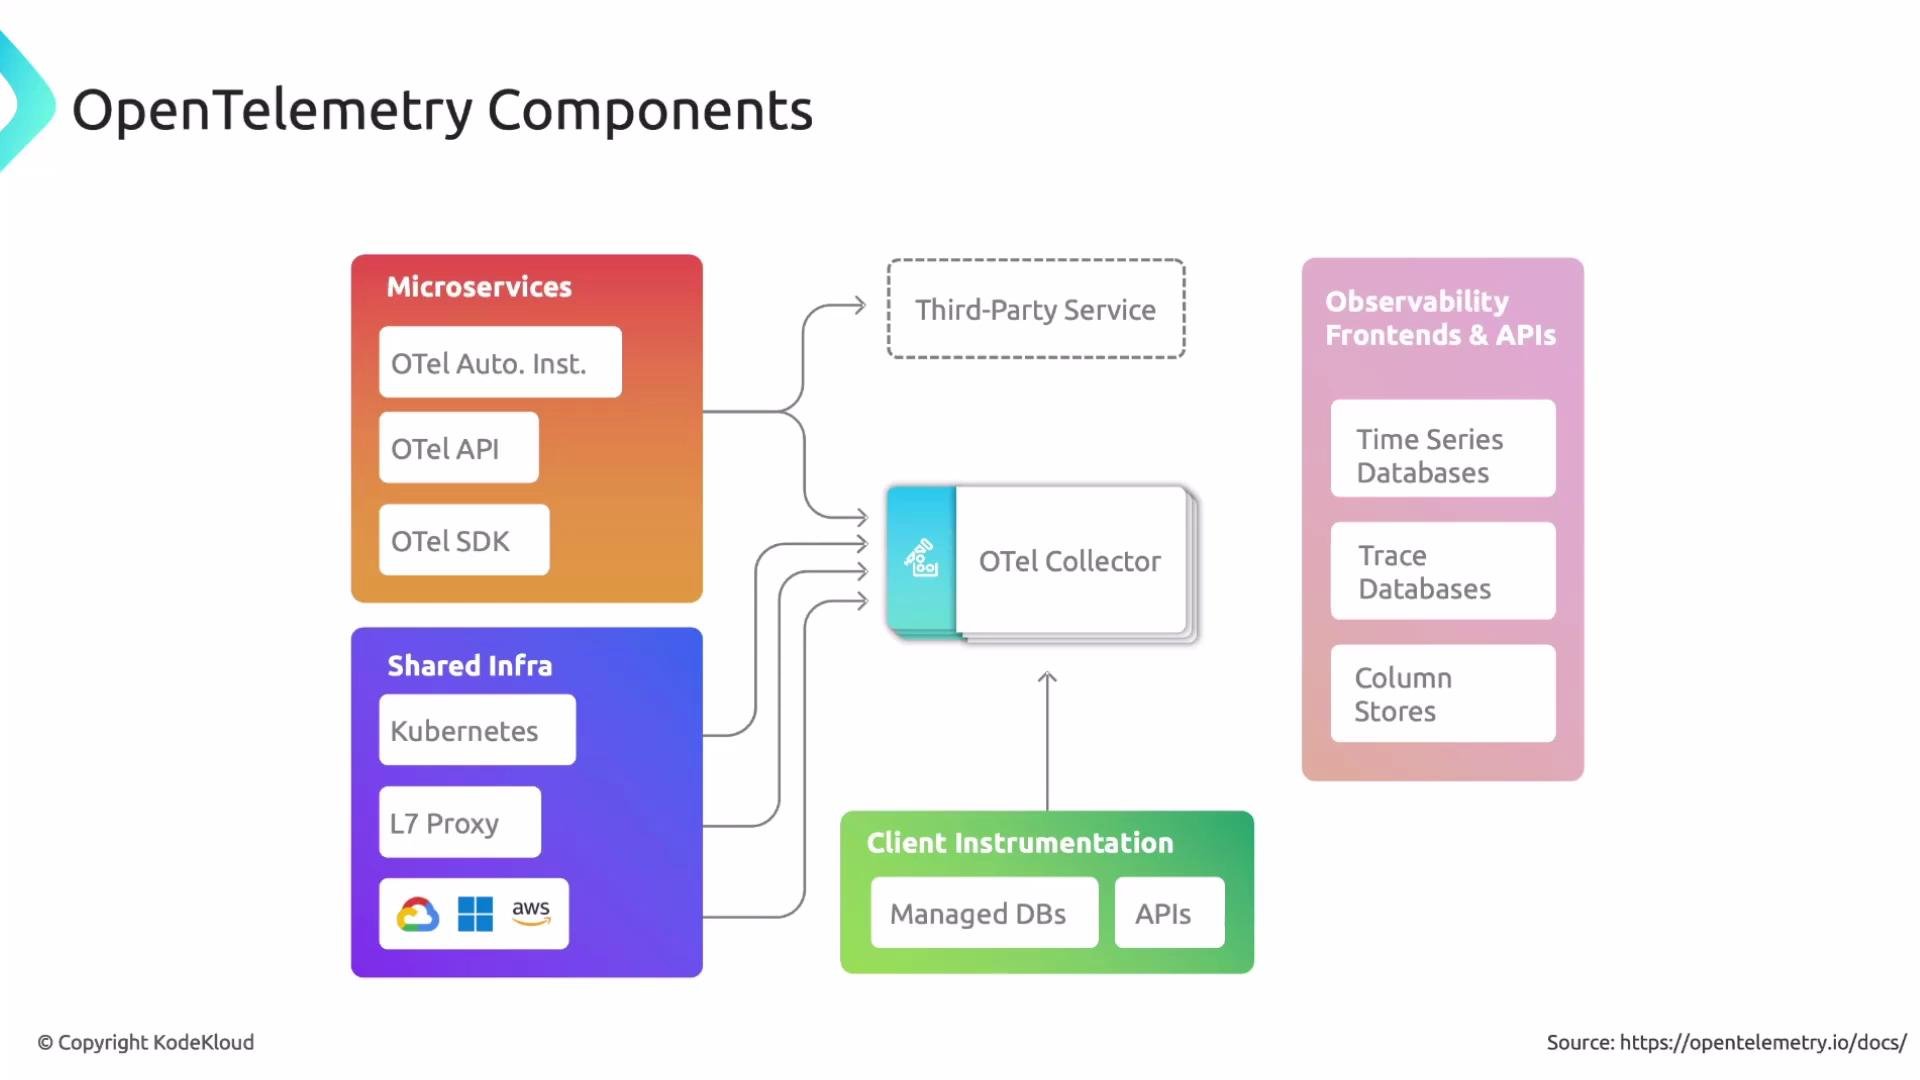
The OpenTelemetry Collector can be deployed as an agent (sidecar or node-level) close to your applications, or as a gateway (centralized) to receive and forward telemetry from multiple sources — choose the deployment model that matches your scaling and security needs.
-
Higher-quality telemetry
The OpenTelemetry specification encourages consistent resource attributes and rich metadata, improving traceability and making cross-service correlation easier. -
Vendor flexibility and easier migrations
Standardized instrumentation lets you switch or add observability backends with minimal changes to application code. -
Scalability and performance
Collector and SDK implementations are designed for high-throughput environments; proper configuration ensures reliable telemetry under heavy load. -
Centralized processing and control
Using the Collector allows you to apply sampling, filtering, enrichment, and routing consistently across all your telemetry.
- Explore official guides and quickstarts at the OpenTelemetry website: https://opentelemetry.io
- Consider an initial setup that includes auto-instrumentation plus a Collector deployment (agent or gateway) that exports to your chosen backend(s).
- For production, design Collector topology (agent vs gateway), sampling strategy, and resource attribute conventions before scaling.
- OpenTelemetry Documentation
- OTLP protocol specification
- Jaeger Tracing
- Prometheus
- Datadog
- Grafana
- Dynatrace