Guidance for instrumenting applications and updating CI/CD pipelines during migration to an observability platform, including tracer integration, testing, decommissioning legacy collectors, and migration documentation
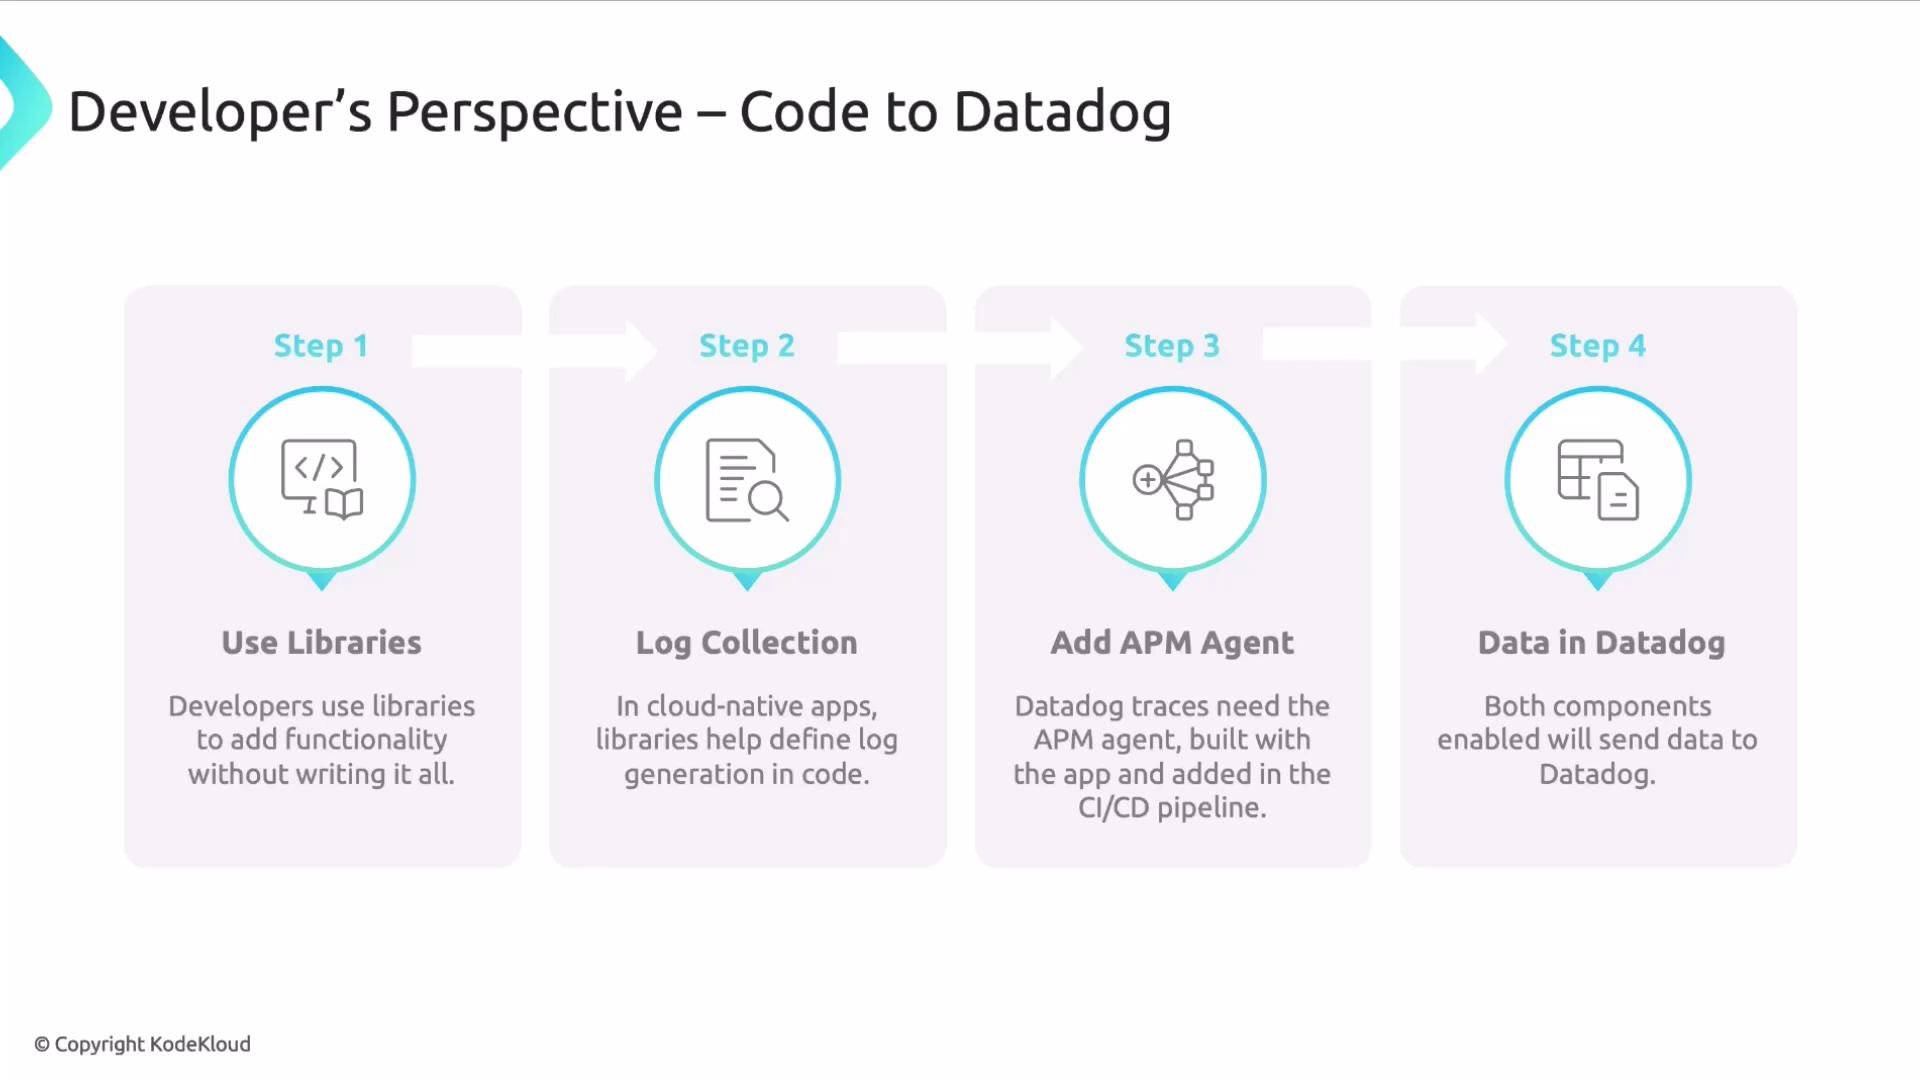
In this lesson we cover how applications are integrated into an observability solution during a migration. From a developer’s point of view, application integration typically means adding libraries and agents to application code and the build/deploy pipeline so telemetry—logs, metrics, and traces—is produced and delivered to the observability platform.Libraries let teams implement common telemetry behavior without re-creating it. In cloud-native systems, a typical pattern is log collection: the app emits logs via a library API and that library formats and forwards logs into the collection pipeline.Traces are captured by an APM tracer that must be integrated with your application. Integration approaches vary by runtime and can include:
compiling or packaging a tracing library into the build artifact, or
attaching a runtime agent (for example, a JVM agent) at deploy time.
Make sure your CI/CD pipeline includes the appropriate steps—either bundling tracer libraries into artifacts or configuring deployments to attach runtime agents. Enabling these build and deploy steps ensures the observability platform receives application telemetry.Observability collection is flexible—there are multiple ways to generate and forward logs and traces depending on your stack, constraints, and operational requirements.
Typical developer workflow
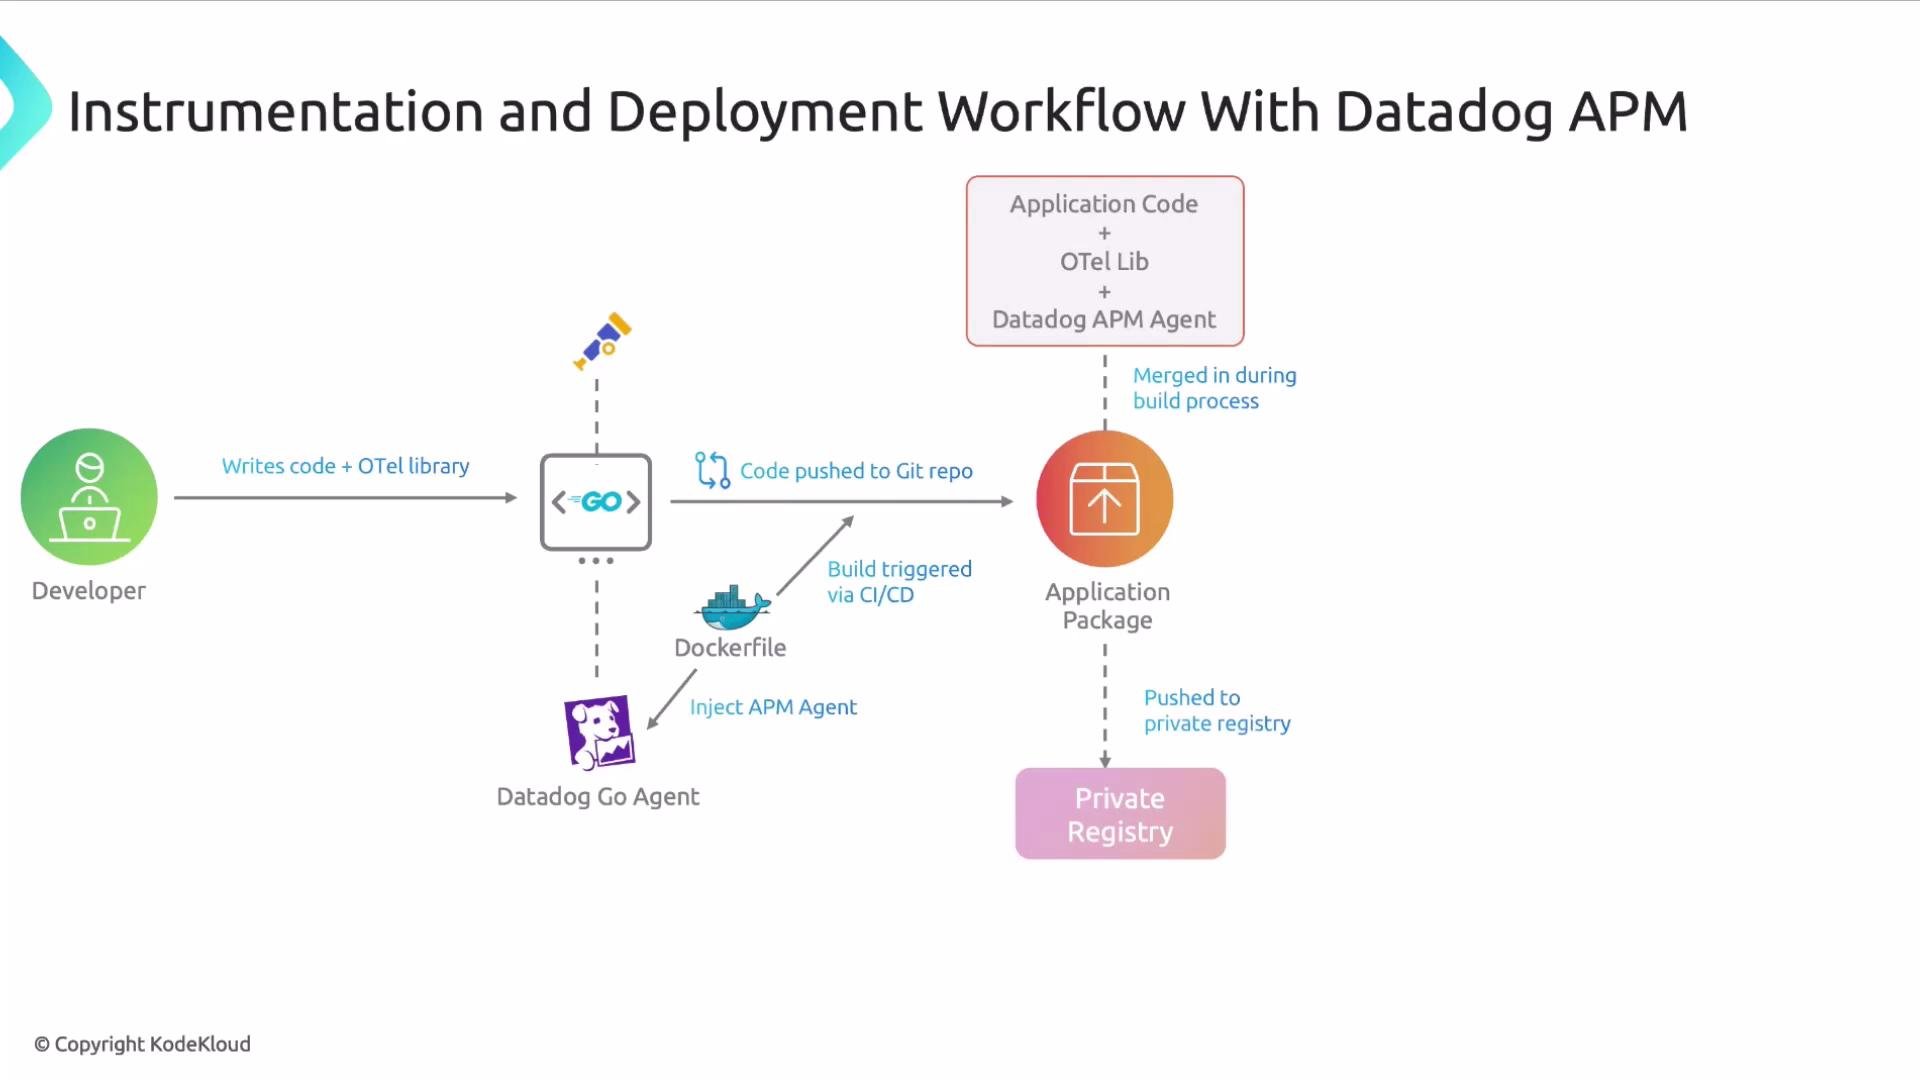
A common workflow looks like this: a developer writes application code and uses a telemetry library such as OpenTelemetry (or a vendor-provided library) to instrument logging, metrics, and traces. The code is pushed to a source repository (for example, GitHub) using Git. That push triggers a CI/CD pipeline that builds the application, includes the chosen tracer (for example, the Datadog APM tracer or another compatible tracer), produces an artifact, and publishes it to a private registry. The artifact is then deployed to a Kubernetes cluster (or other runtime). Once running, the instrumented application sends telemetry to Datadog for engineers to analyze.
Coordinating instrumentation during migration
Instrumenting new applications is straightforward. Migrating existing services requires coordination across teams and automation pipelines. Below are the key considerations and practical actions to include in your migration plan.Key considerations and recommended actions
Consideration
Action / Example
Pipeline modification
Update CI/CD to include build steps that install or bundle tracer libraries, exporters, and config. Example: add a build stage that runs npm install @opentelemetry/sdk or includes the tracer jar in your Docker image. Coordinate these changes with release windows.
Evolving artifacts
Expect container images and artifacts to change. Ensure image build, signing, and registry policies accommodate new dependencies and updated SBOMs.
Version compatibility
Verify that your runtime (language, framework) and the chosen APM/agent versions are compatible. Test combinations in staging before production rollout.
Communication
Inform teams that consume or depend on the service about migration windows and potential behavior changes. Maintain a runbook for rollback and contact points.
Legacy deactivation
Plan to remove old agents, collectors, and forwarding rules to avoid duplicated or inconsistent telemetry. Include deactivation steps in deployment recipes.
Migration recipes & docs
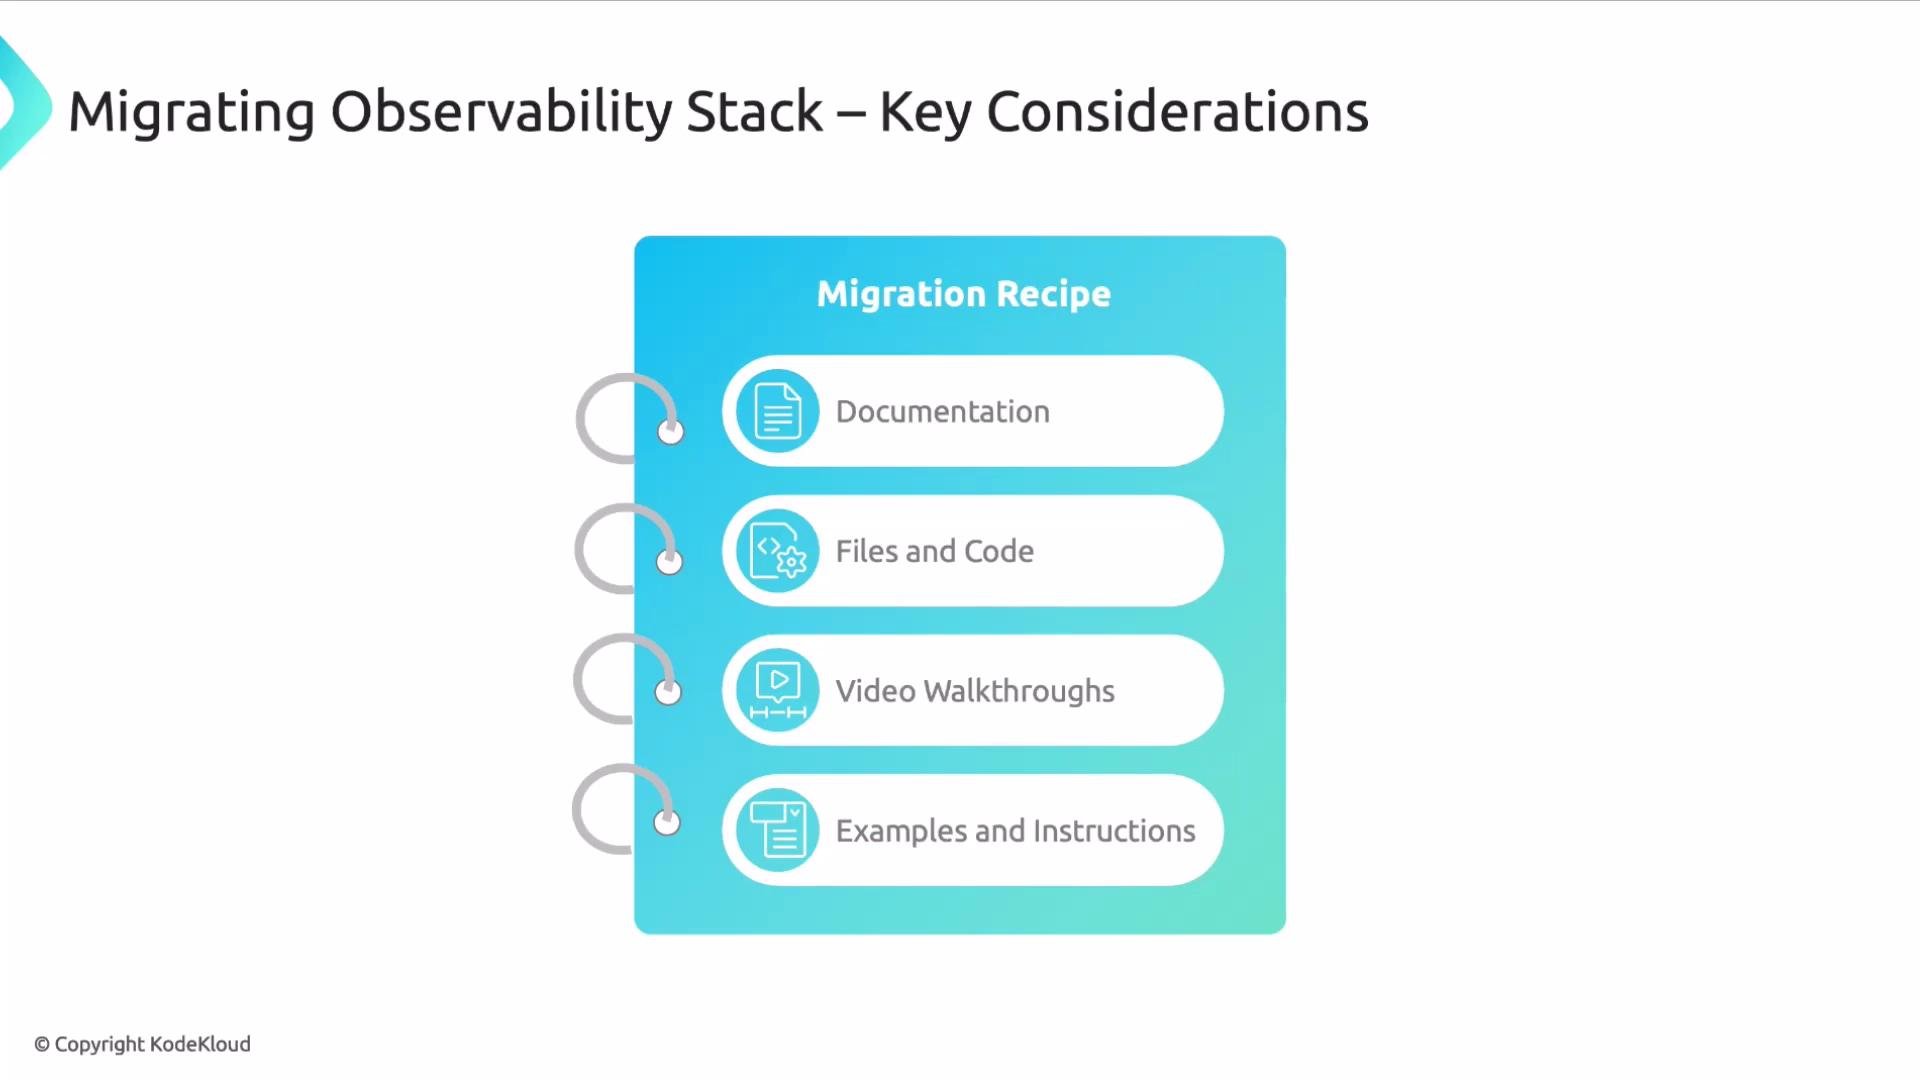
Provide clear, technology-specific guides: code snippets, config files, example manifests, CI/CD snippets, video walkthroughs, and troubleshooting steps.
Before migrating, validate tracer and library versions in a staging environment. Automated integration tests that assert telemetry is produced (logs, metrics, traces) will reduce surprises in production.
Operational coordination
Pipeline modification
Update your CI/CD pipelines to add build steps that bundle the tracer, exporters, and configuration. These changes often need to align with release schedules to avoid blocking deployments.
Evolving artifacts
Instrumentation typically changes your images and artifacts. Update image build, signing, and registry processes to include new dependencies and security scans.
Version compatibility
Confirm language runtime and framework versions are supported by your chosen agents and libraries. Verify compatibility for any third-party instrumentation before rolling out at scale.
Communication
Coordinate with teams that own dependent services. Migration windows can overlap with normal traffic, so plan maintenance windows and communications to reduce impact.
Do not leave legacy collectors or agents running in parallel indefinitely. Duplicate collectors can create duplicated metrics and traces, skewing alerts and dashboards. Decommission legacy tooling as part of your migration checklist.
Legacy deactivation
Decommission legacy agents, collectors, and forwarding rules once the new instrumentation is verified. Include deactivation in deployment and rollback procedures so retries and rollbacks behave predictably.
Migration recipes and documentation
Provide step-by-step, technology-specific migration guides for developers and operators. Useful artifacts include code snippets, configuration manifests, CI/CD snippets, example container images, video walkthroughs, and troubleshooting tips to speed adoption.
Next steps
Create a staging plan that exercises telemetry end-to-end.
Add CI/CD tests that verify logs, traces, and metrics are exported.
Publish migration recipes for each supported runtime and framework.
That’s it for this lesson. I hope you found it useful.