

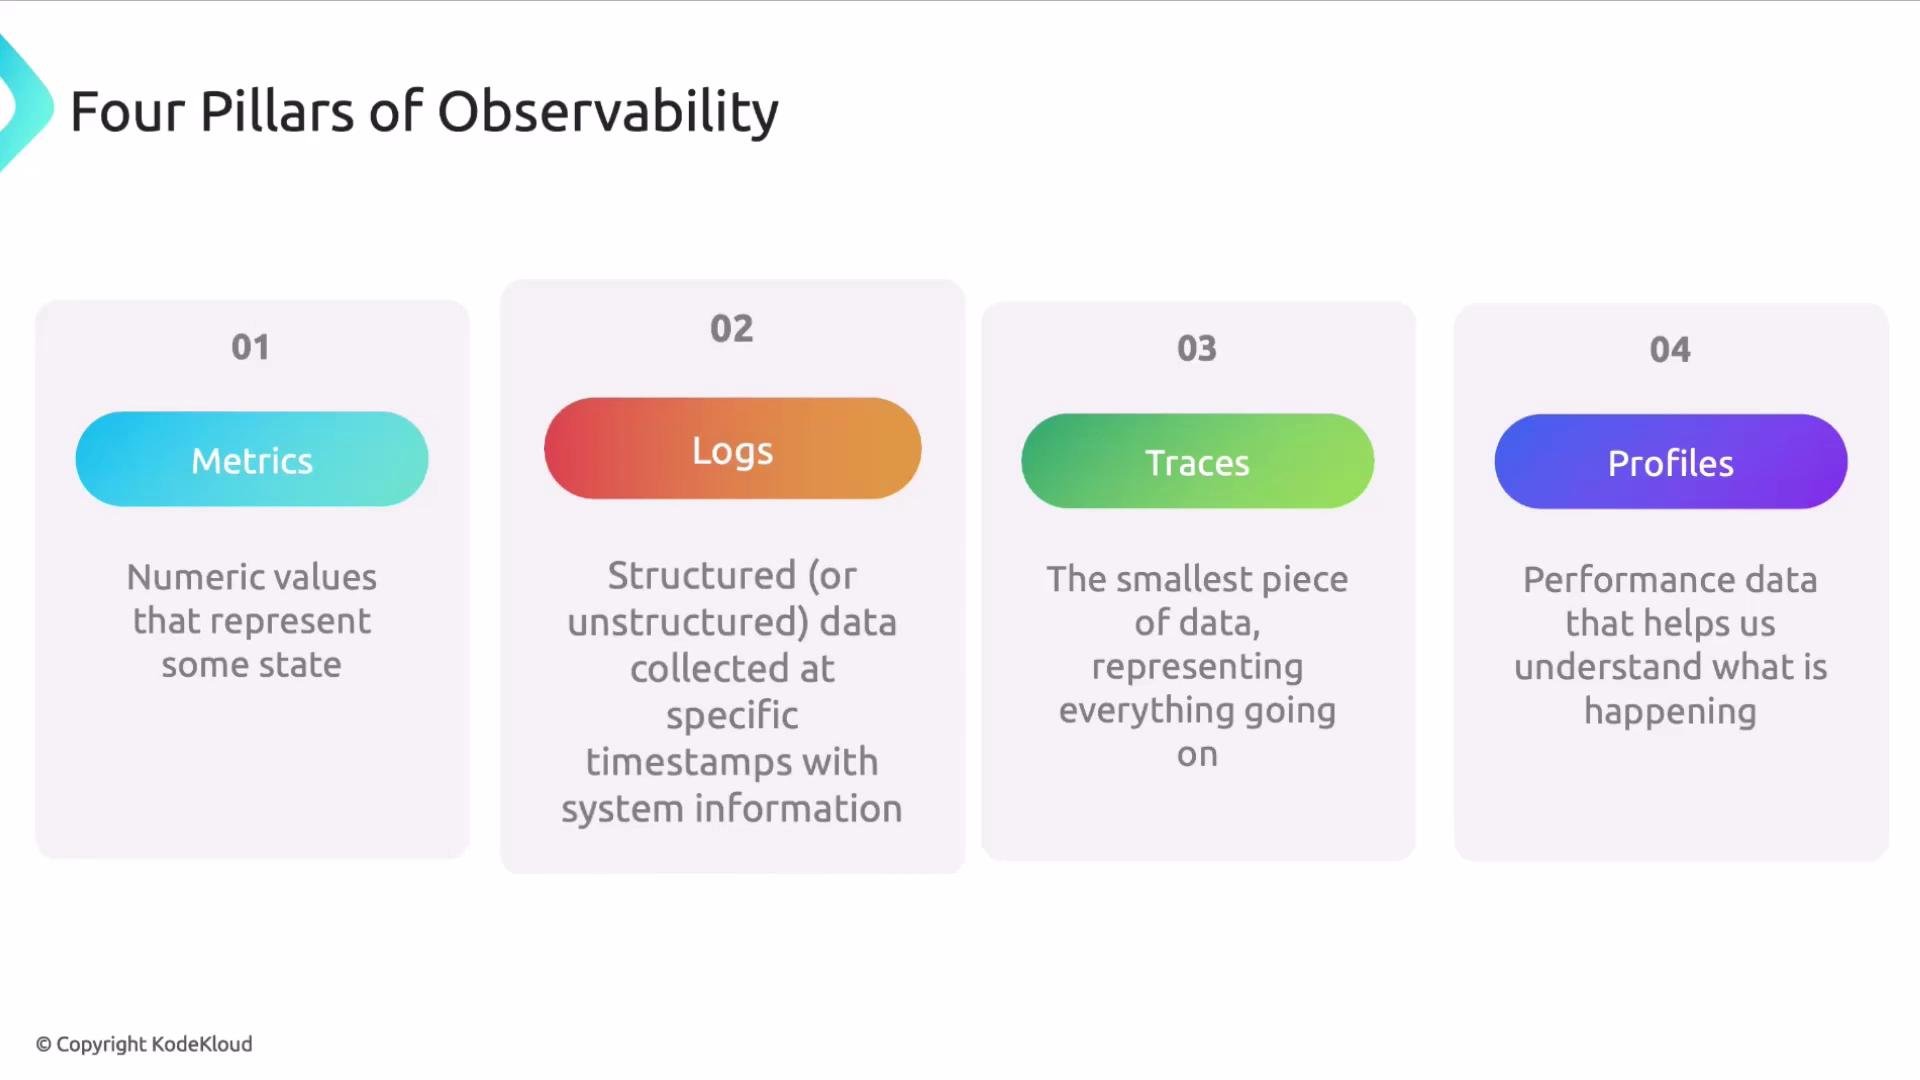
Observability is most powerful when you combine telemetry types: metrics for trends and alerts, logs for detailed events, traces for request flow, and profiles for resource-level hotspots.
Metrics
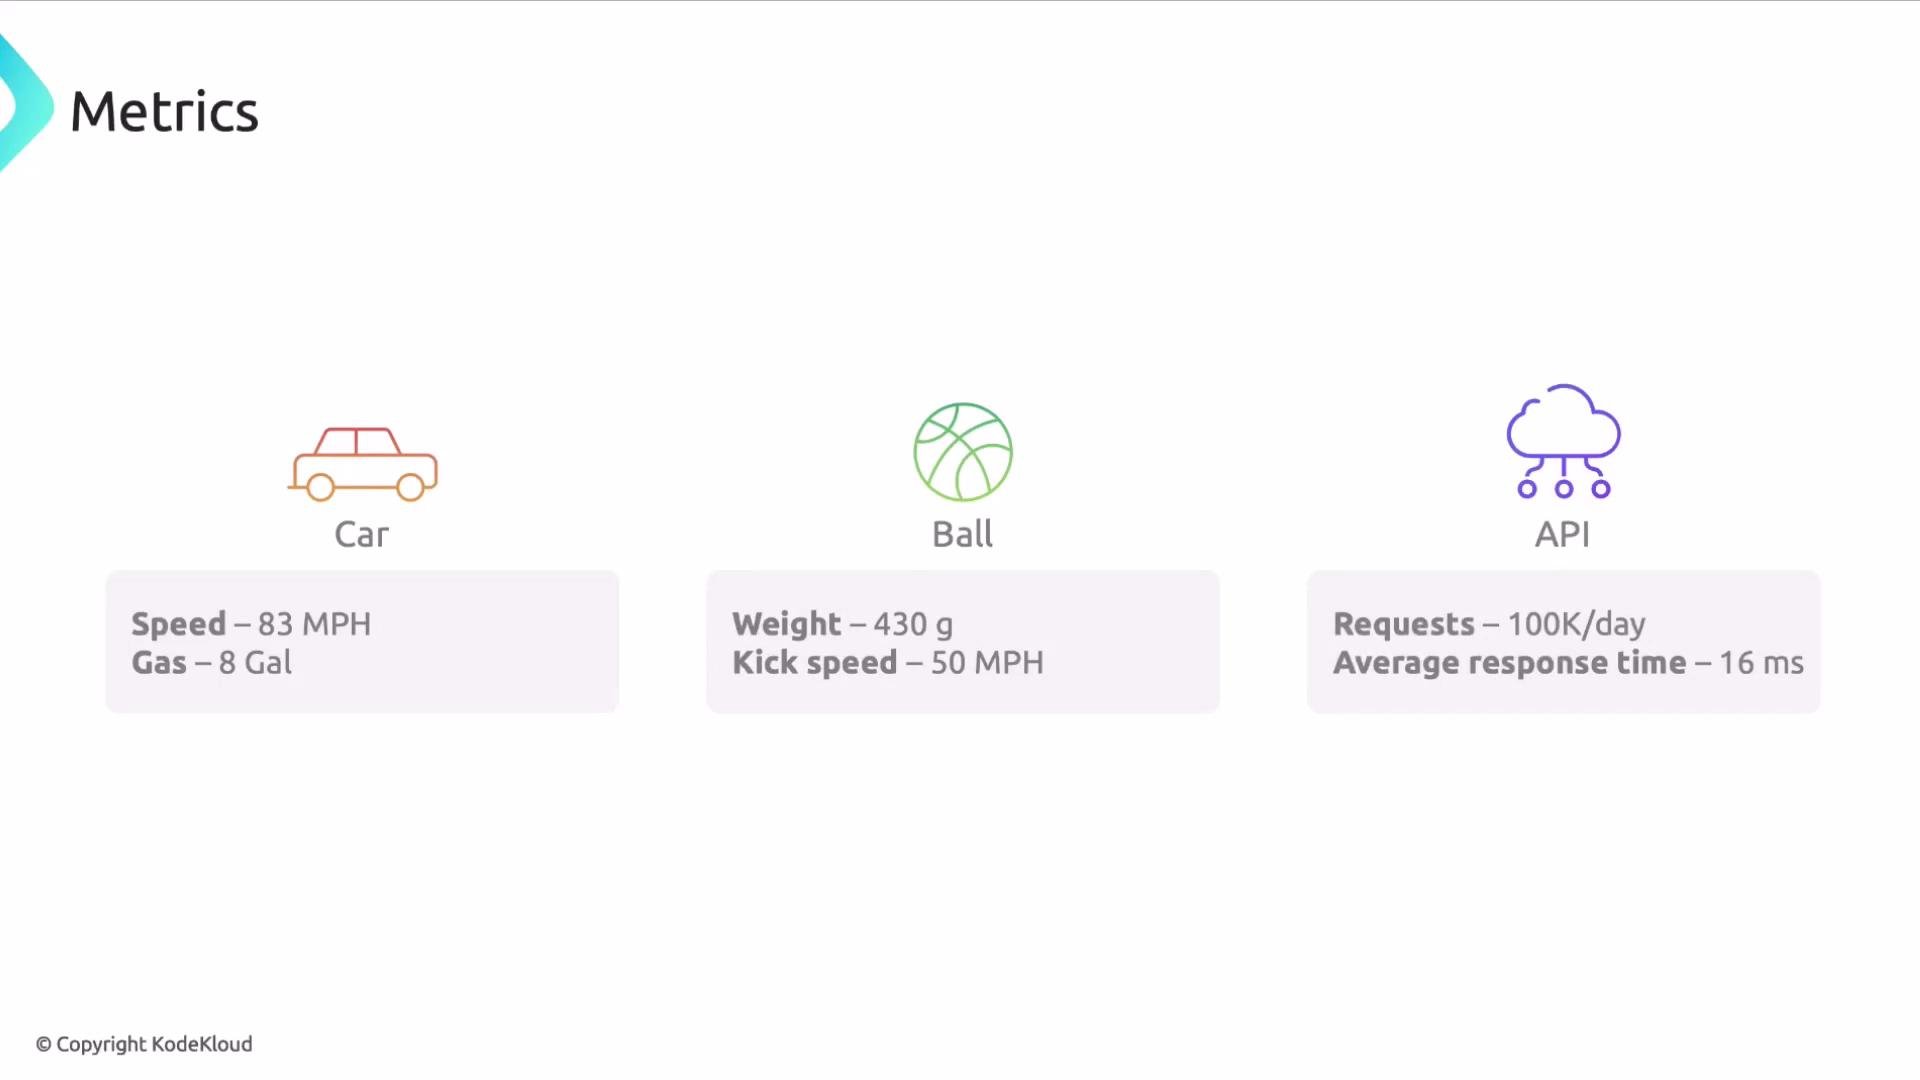
Metrics are numeric observations of system state recorded at specific timestamps. Think of a car speedometer: it tells you how fast you’re going at a moment in time. When you accelerate, the metric increases; when you brake, it decreases. Common metric types:- Gauges — instantaneous values (e.g., temperature, current heap size).
- Counters — monotonic counts that are typically converted to rates (e.g., requests served).
- Histograms / Summaries — distributions used for latency percentiles and value aggregation.
Logs
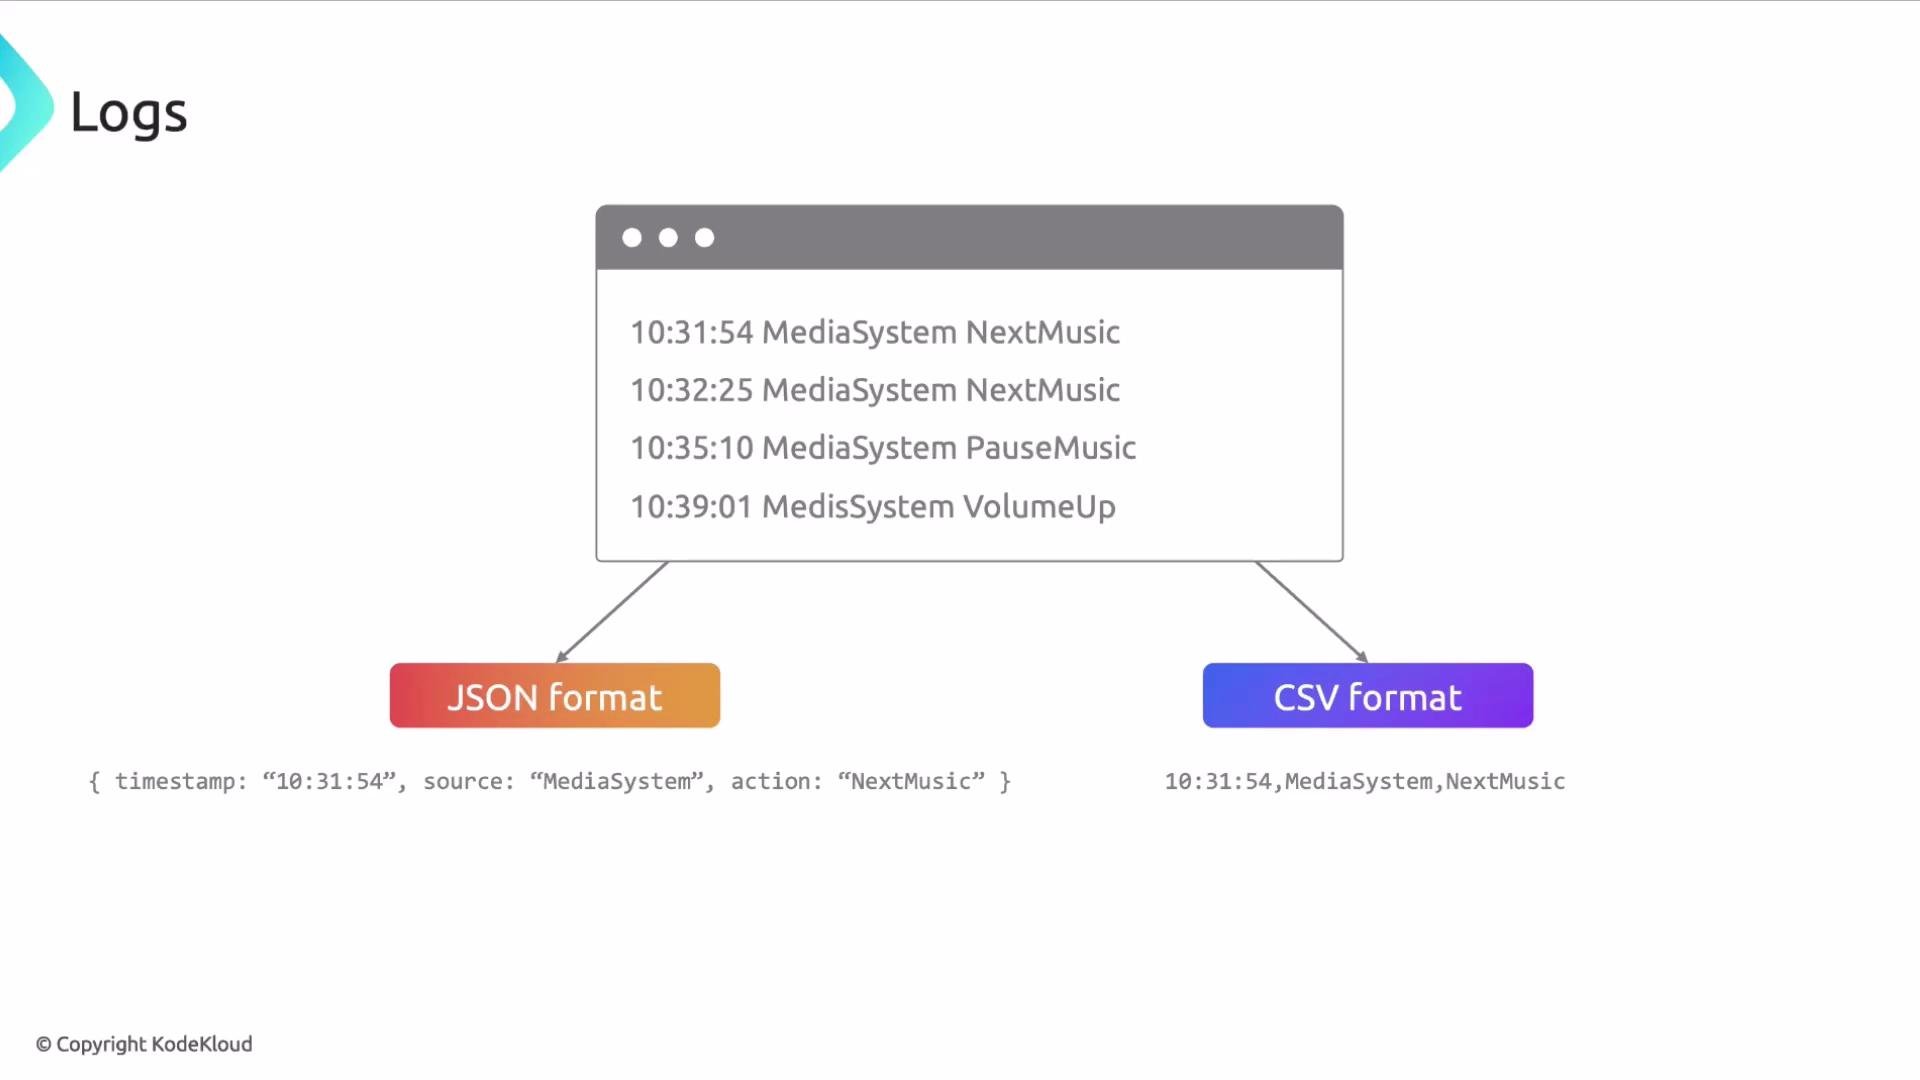
Logs are chronological records that describe discrete events with contextual fields. They are invaluable for reconstructing what happened during an incident and for storing rich diagnostic information.- Structured logs (JSON, key-value) are preferred because they make querying and correlation straightforward.
- Include context fields (request ID, user ID, component name) to link logs to traces and metrics.
Traces
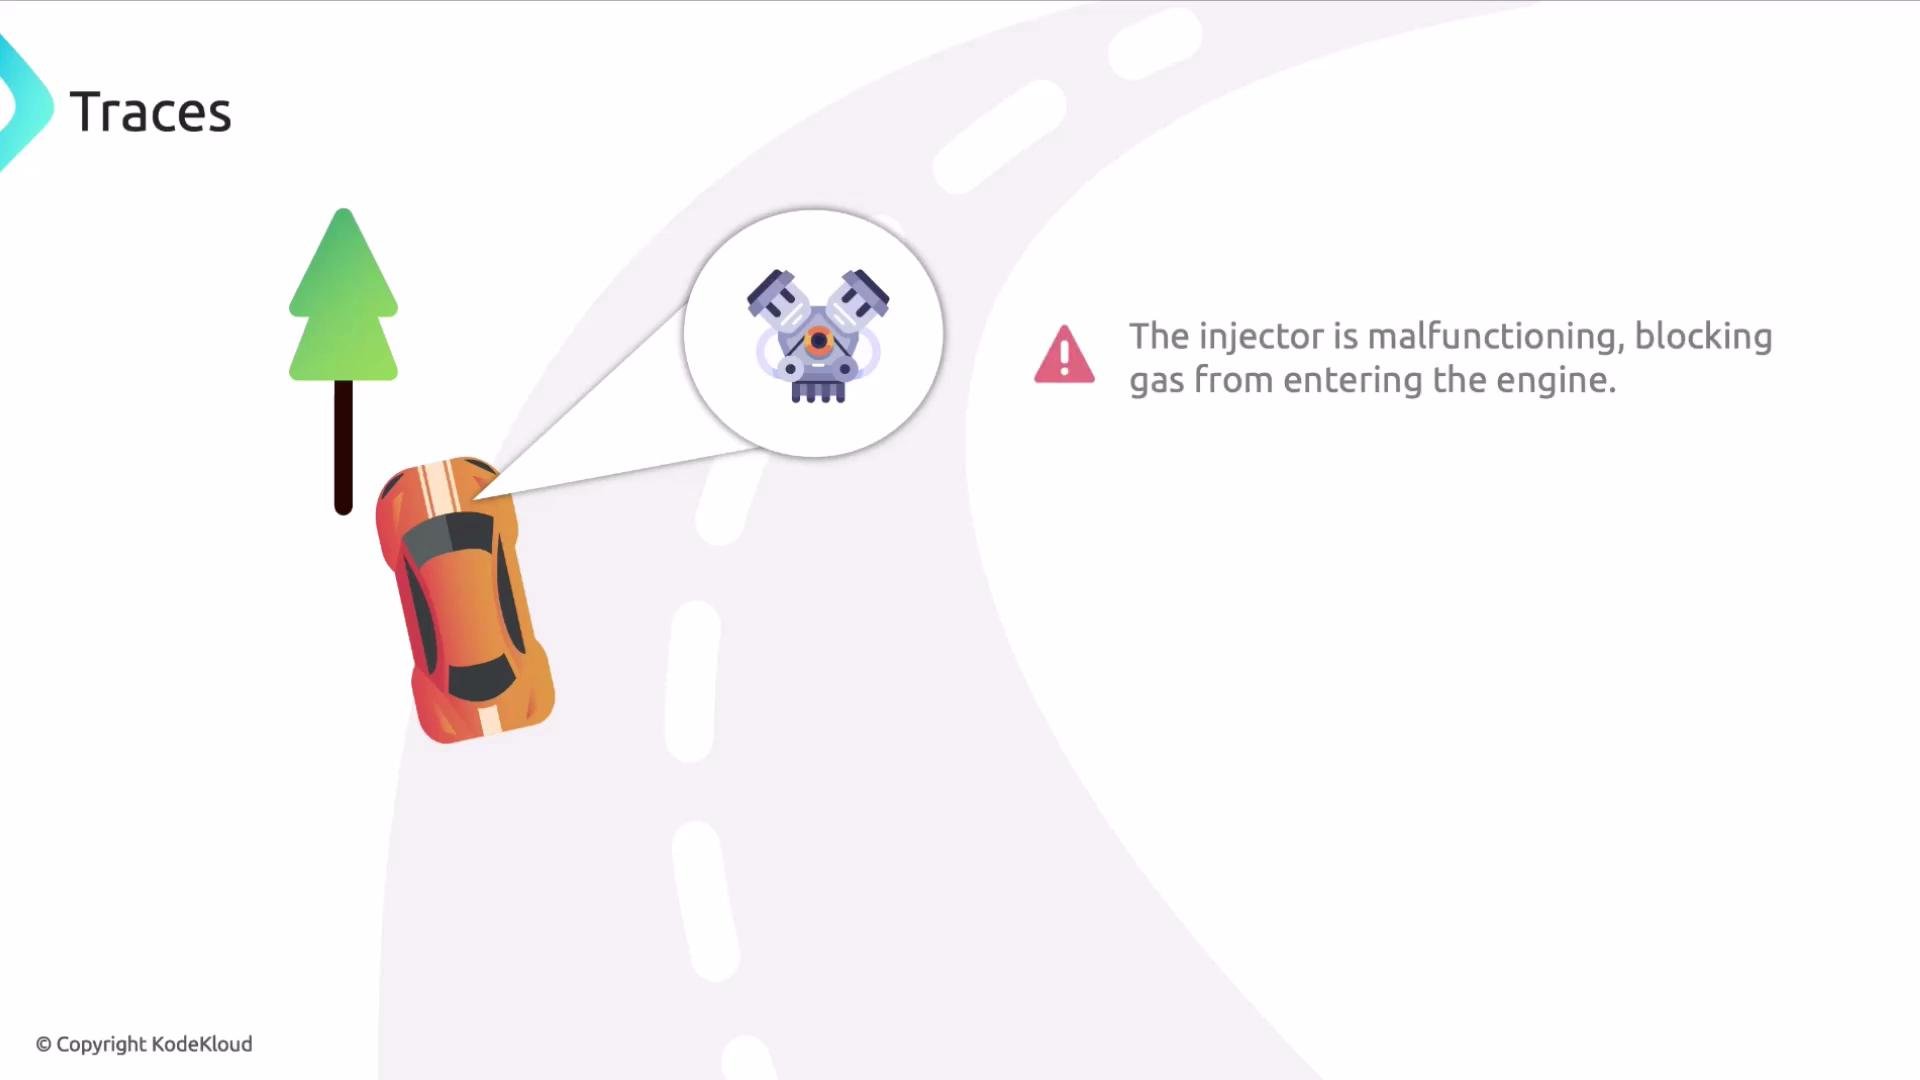
Traces record the end-to-end flow of a request through a distributed system. A trace is composed of spans; each span represents an operation, its start and end time, status, and metadata. Tracing helps you see ordering, cross-service latency, and where time is spent. Use cases:- Pinpoint slow services or downstream dependencies.
- Understand causality and the sequence of operations.
- Correlate traces with logs via trace IDs and with metrics for aggregate latency.
Profiles
Profiling captures continuous, low-overhead runtime information about resource usage (CPU sampling, memory allocations, blocking operations, I/O) so you can identify hotspots and inefficient code paths. Flame graphs are the common visualization for profiling data and make hot call stacks easy to spot.- Sampling profilers periodically capture stack traces with minimal runtime overhead.
- Instrumentation profilers record detailed allocation or lock events when deeper insight is required.
- Profiles complement traces: use traces to find which requests are slow and profiles to see which functions consume the most CPU or memory during those requests.
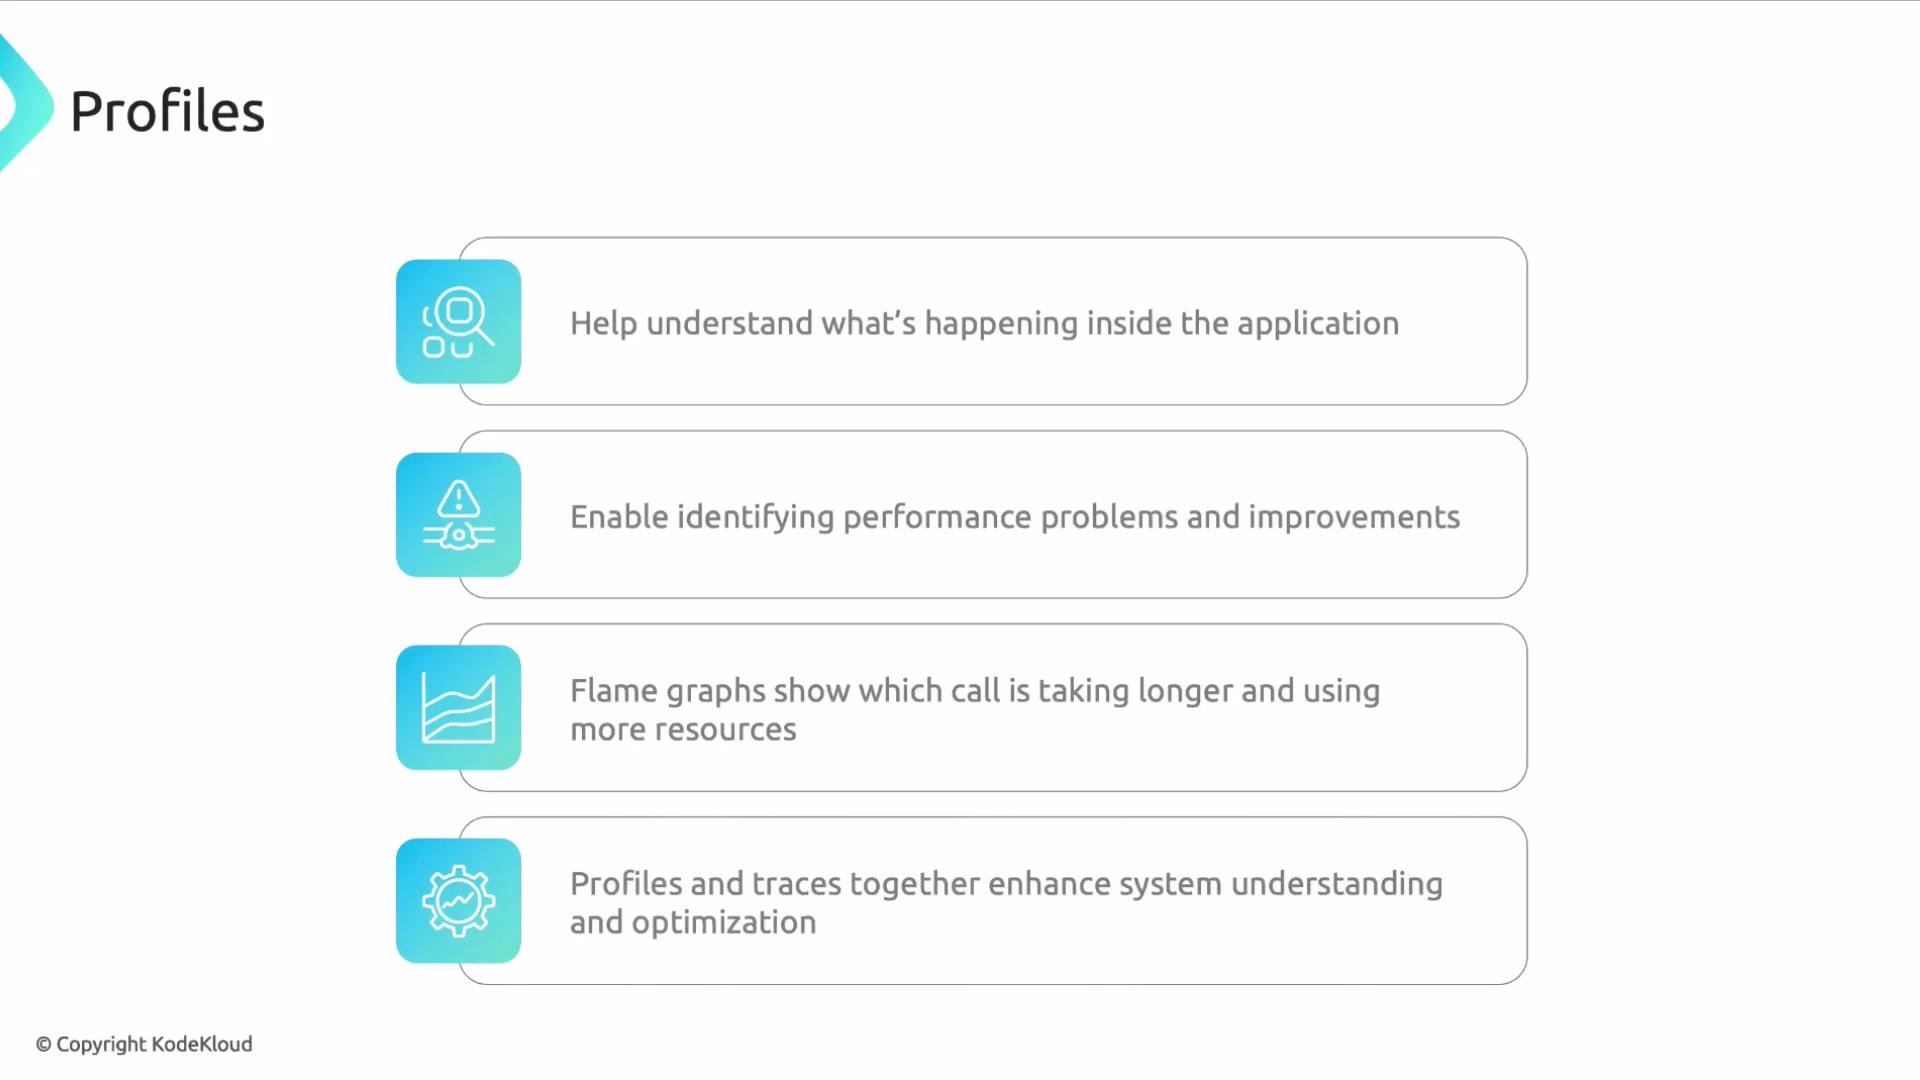
- Understand internal behavior of applications at the function-call level.
- Identify and prioritize performance improvements.
- Use flame graphs to quickly locate long-running or resource-heavy call stacks.
- Combine profiles with traces to connect slow requests to hot code paths.
Be mindful of data volume and sampling: high-cardinality metrics and verbose logs can increase costs, while overly aggressive profiling or tracing can add overhead. Use sampling, aggregation, and structured logging to balance observability depth with performance and cost.
- OpenTelemetry — vendor-neutral observability instrumentation.
- Prometheus — metrics collection and alerting.
- Jaeger — distributed tracing.
- Flame Graphs (Brendan Gregg) — profiling visualization techniques.