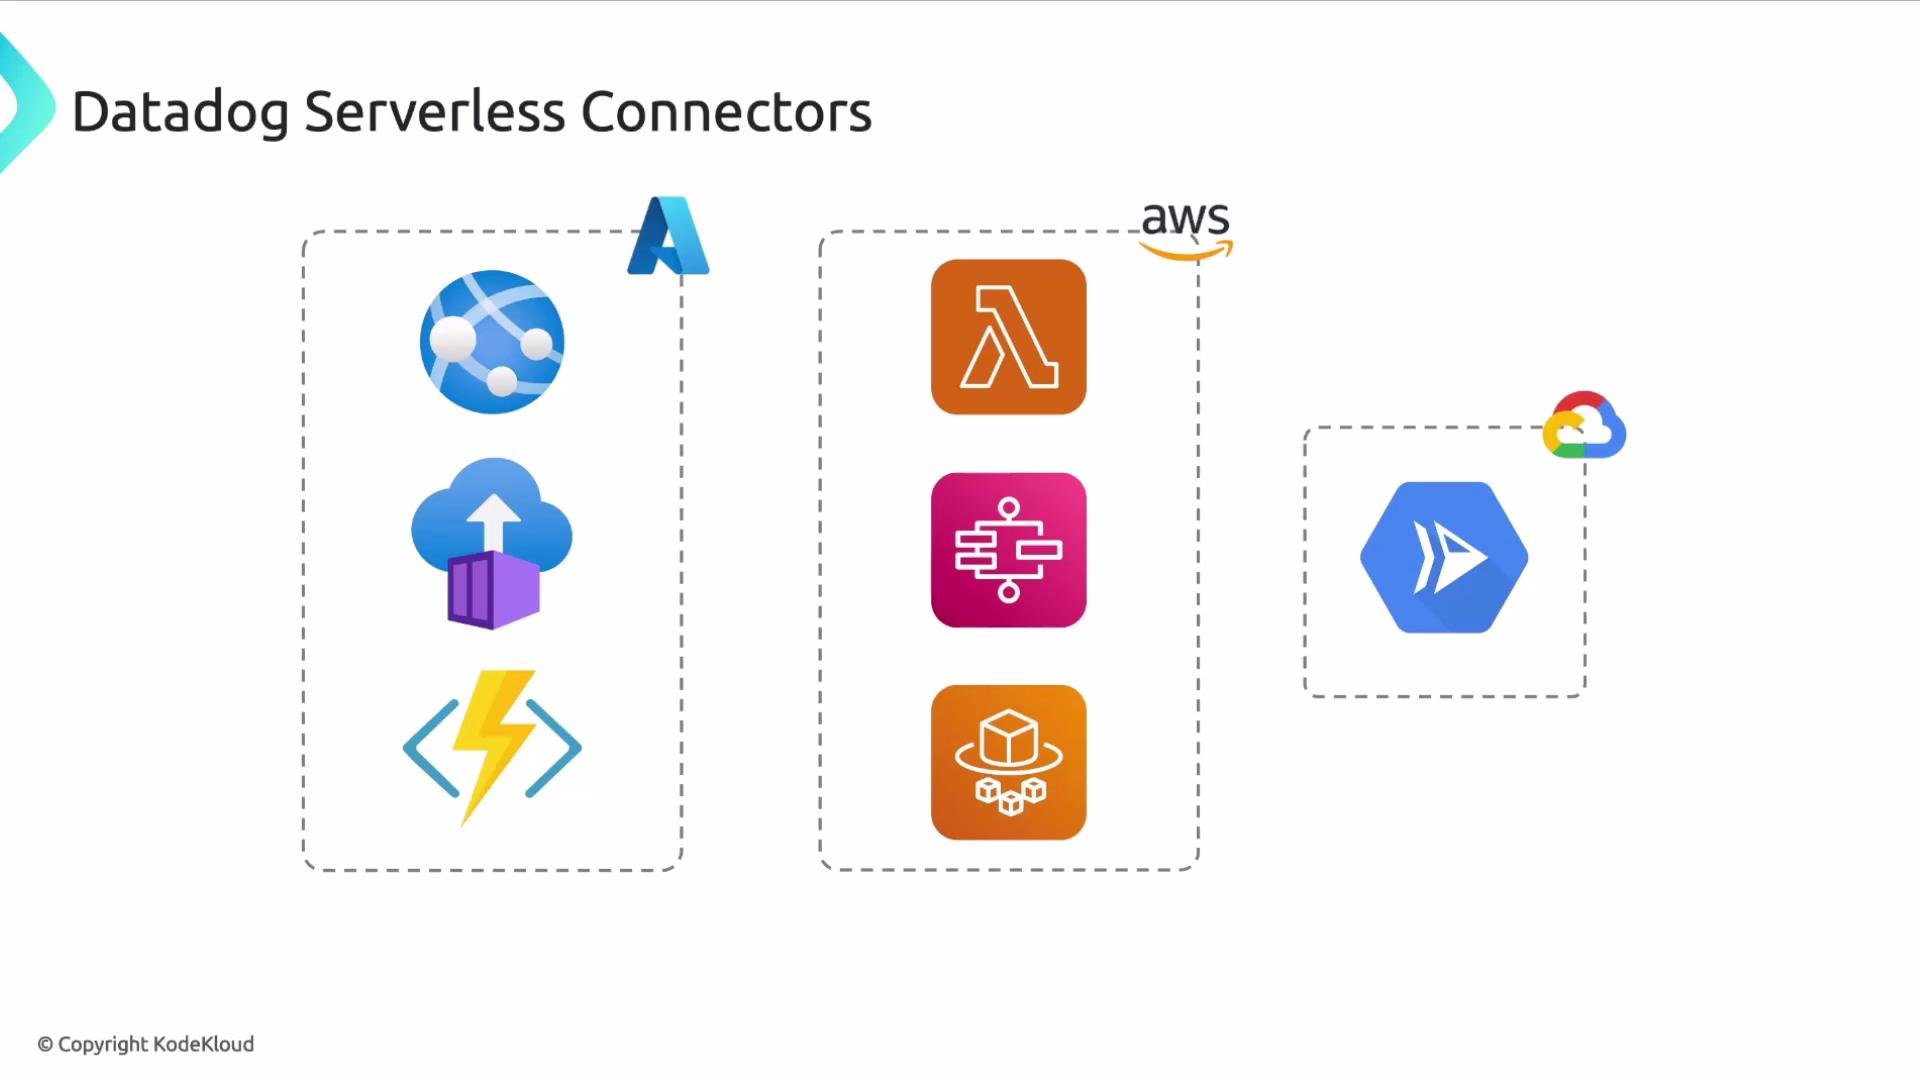
This lesson explains Datadog Serverless Connectors: how Datadog integrates with serverless platforms to collect telemetry (metrics, traces, logs, and profiles) from services that do not run on user-visible hosts. Serverless workloads are a central part of modern cloud-native architectures because of cost efficiency, automatic scaling, and simplified operations — but they require different instrumentation approaches than VMs or Kubernetes nodes. Datadog offers native Serverless Connectors to monitor services such as Azure Functions, Azure App Service, Azure Container Instances, AWS Lambda and Step Functions, AWS Fargate, and Google Cloud Run. For full provider- and runtime-specific instructions, see the official Datadog Serverless documentation: https://docs.datadoghq.com/serverless/.
The image shows a diagram labeled "Datadog Serverless Connectors" with icons representing serverless services from Azure, AWS, and Google Cloud.

Why Serverless Instrumentation Is Different

Traditional Datadog agents run on hosts or within Kubernetes nodes. Serverless platforms hide the underlying compute, so you must instrument the application code (or attach provider-specific extensions/layers) to emit telemetry directly. Instrumentation varies by cloud provider and runtime; Datadog provides runtime libraries and optional extensions to simplify this work.

Supported Platforms and Typical Use Cases

PlatformTypical Datadog IntegrationExample
AWS LambdaRuntime library + optional Lambda extension or layer; CloudWatch Logs subscription or extension for logshttps://docs.datadoghq.com/serverless/
AWS FargateDatadog agent sidecar or built-in integrationhttps://docs.datadoghq.com/integrations/
Azure Functions / App ServiceDatadog runtime libraries and Azure-specific extensions/integrationshttps://docs.datadoghq.com/serverless/
Google Cloud RunRuntime libraries + Logging/Trace integration with GCPhttps://docs.datadoghq.com/serverless/
Azure Container InstancesRuntime libraries and Azure integrationshttps://docs.datadoghq.com/serverless/

How Datadog Collects Telemetry from Serverless Functions

Using AWS Lambda as a concrete example helps illustrate the general pattern:
  • The Datadog runtime library embedded in the function generates metrics, traces, and profiles.
  • Where available, the Datadog Lambda extension or layer can forward those telemetry items more efficiently.
  • Logs are typically forwarded from the provider’s logging service (e.g., AWS CloudWatch). You can forward logs to Datadog via a CloudWatch Logs subscription, the Datadog CloudWatch integration, or — where supported — the Datadog Lambda extension that tails function logs and ships them directly.
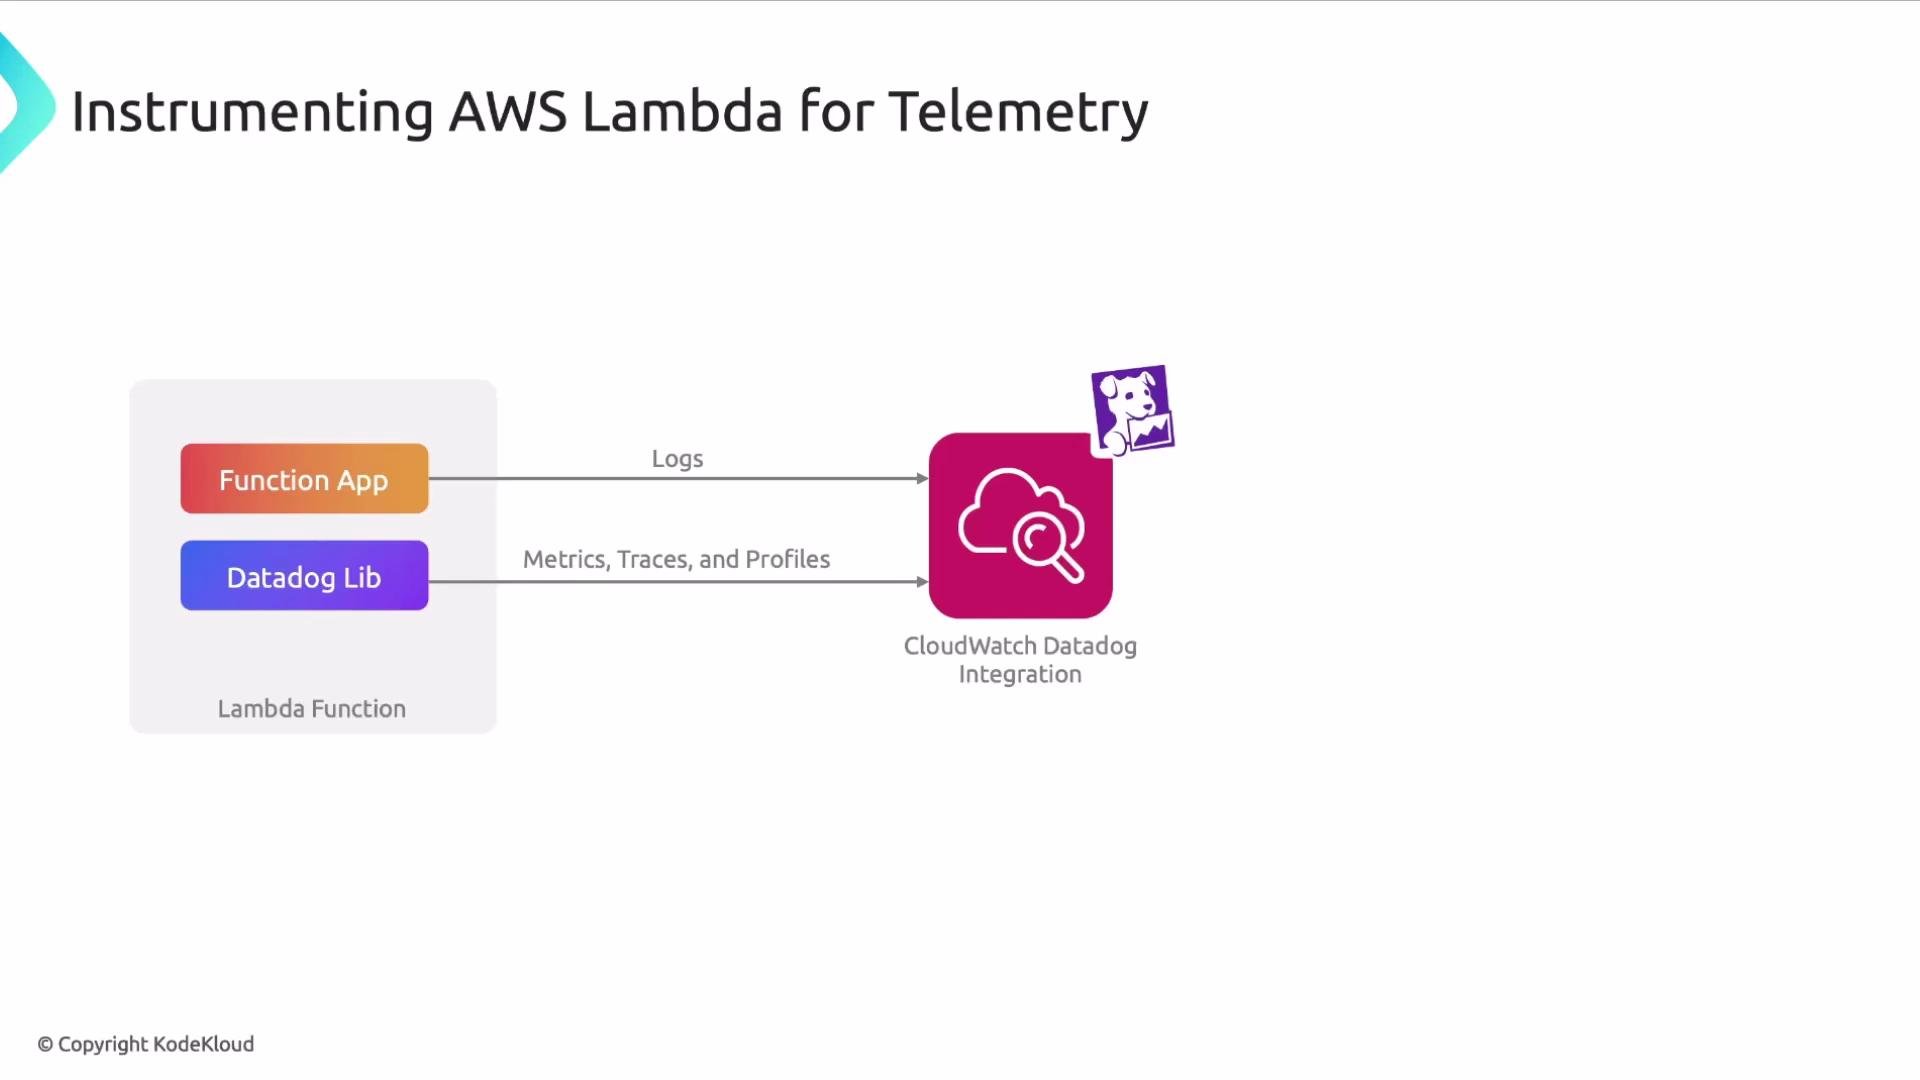
The following diagram shows these flows for an AWS Lambda function: the Datadog library embedded in the function produces metrics/traces/profiles while logs move through CloudWatch or the Datadog extension to Datadog.
The image is a flow diagram illustrating AWS Lambda telemetry instrumentation using Datadog, showing logs and metrics flowing from a function app and Datadog library to CloudWatch Datadog integration.

Runtime Libraries

Datadog provides runtime libraries for six common runtimes:
  • Python
  • Java
  • Go (Golang)
  • Node.js
  • Ruby
  • .NET
Add the appropriate library to your function package and follow Datadog’s runtime-specific instrumentation guide for that language. Libraries capture telemetry and, depending on configuration and platform support, forward data via an extension or directly to Datadog’s site.

Key Configuration Items

Common configuration settings you will need to set (usually via environment variables or a secrets manager):
  • Datadog site (for example, datadoghq.com, datadoghq.eu)
  • Datadog API key (authentication/authorization)
  • Service name, environment, and version tags (for proper correlation in traces and dashboards)
Never hardcode API keys in source control or commit them to repositories. Use secrets management solutions to inject credentials at runtime.
Do not hardcode API keys in production. Use environment variables populated from a secrets manager or the platform’s secure configuration mechanisms to keep credentials safe.
When forwarding logs via CloudWatch or other provider pipelines, ensure the function has the required IAM permissions and that you understand potential cost and retention impacts from log ingestion. Consider sampling and filtering to limit high-cardinality data.

Example: Read Datadog Configuration from Environment Variables (Python)

This minimal Python snippet demonstrates reading configuration from environment variables instead of hardcoding the API key:
import os
from datadog import initialize, statsd

options = {
    "api_key": os.environ.get("DD_API_KEY"),
    "site": os.environ.get("DD_SITE", "datadoghq.com")
}

initialize(**options)

# Send a simple metric
statsd.increment("my_lambda.invocations")
Best practices:
  • Store DD_API_KEY and other secrets in a secrets manager or encrypted store.
  • Use platform-native mechanisms to inject secrets into environment variables (e.g., AWS Secrets Manager, AWS KMS, Azure Key Vault, GCP Secret Manager).

Instrumentation Checklist (Quick Start)

StepAction
1Choose the appropriate Datadog runtime library and any required extension/layer for your platform and runtime.
2Add the library/layer to your function/package and follow the runtime-specific instrumentation guide.
3Configure the Datadog site and credentials via environment variables or your provider’s secret mechanism.
4Enable and configure the provider logging integration (e.g., CloudWatch Logs subscription) or use the Datadog extension where available to forward logs.
5Verify that metrics, traces, logs, and profiles appear in the Datadog UI and dashboards.

Validation and Troubleshooting

  • Confirm environment variables are present in deployed functions and not printed in logs.
  • Check the Datadog UI for incoming metrics and traces; use logs to debug missing instrumentation.
  • Validate CloudWatch Logs subscriptions or extension logs for any forwarding errors.
  • Use sampling and rate limits to avoid excessive ingestion costs.
That’s it for this lesson — you should now understand how Datadog Serverless Connectors collect telemetry from serverless platforms, the common configuration patterns, and the recommended security practices for handling credentials.

Watch Video